. 2022 Jun 28;12(1):10892.
doi: 10.1038/s41598-022-14516-z.

Single-cell transcriptional profiling reveals cellular and molecular divergence in human maternal-fetal interface

Affiliations

Single-cell transcriptional profiling reveals cellular and molecular divergence in human maternal-fetal interface

Quanlei Wang et al. Sci Rep. .

Abstract

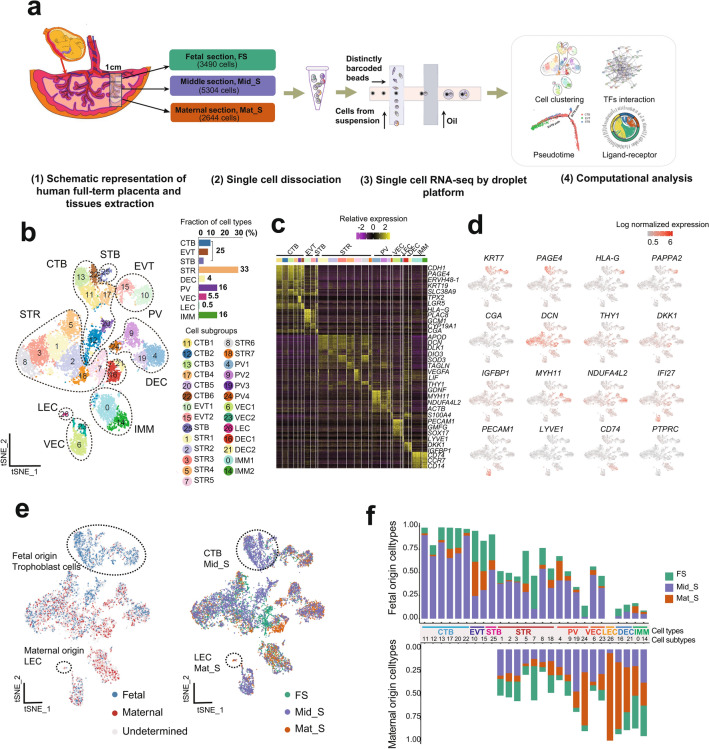
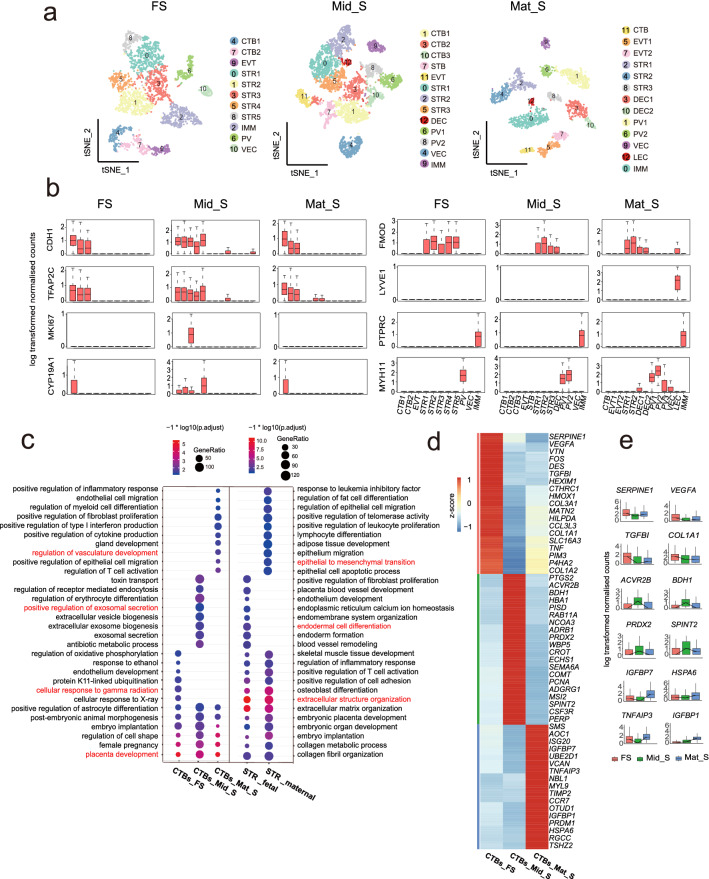
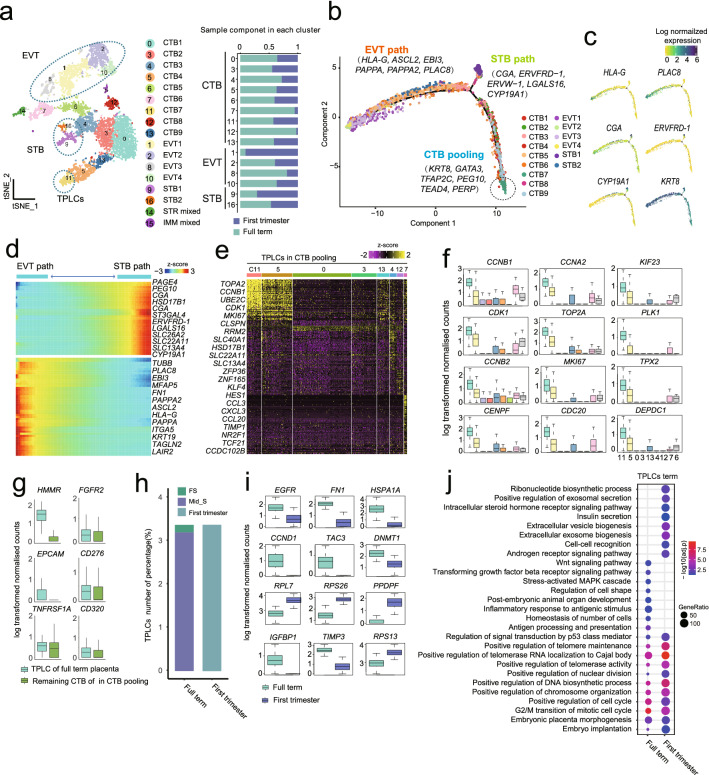
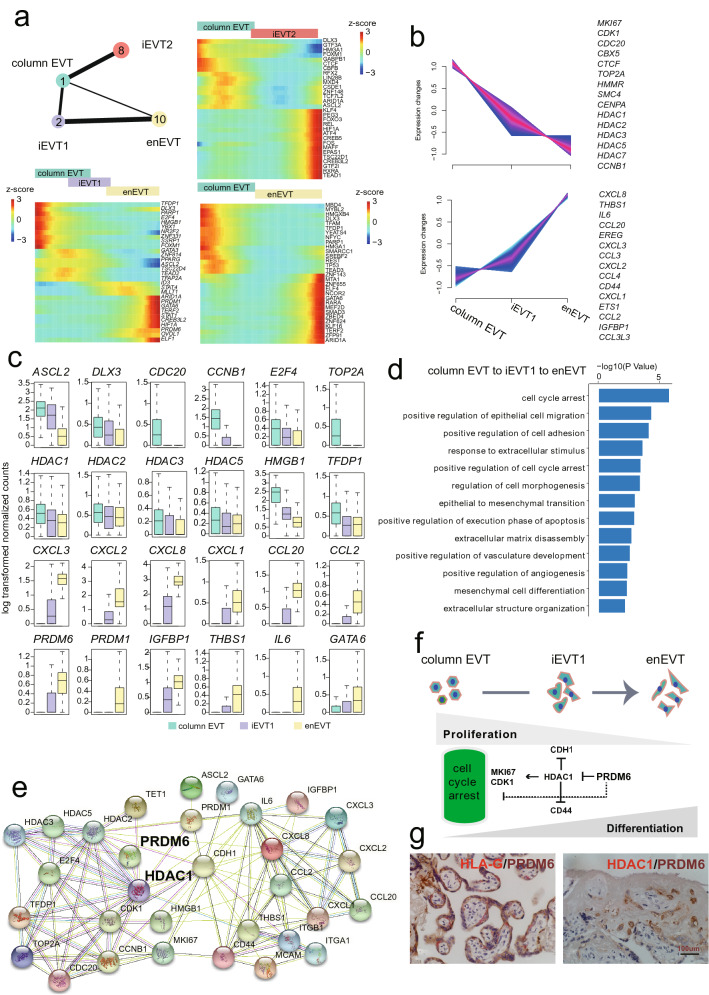
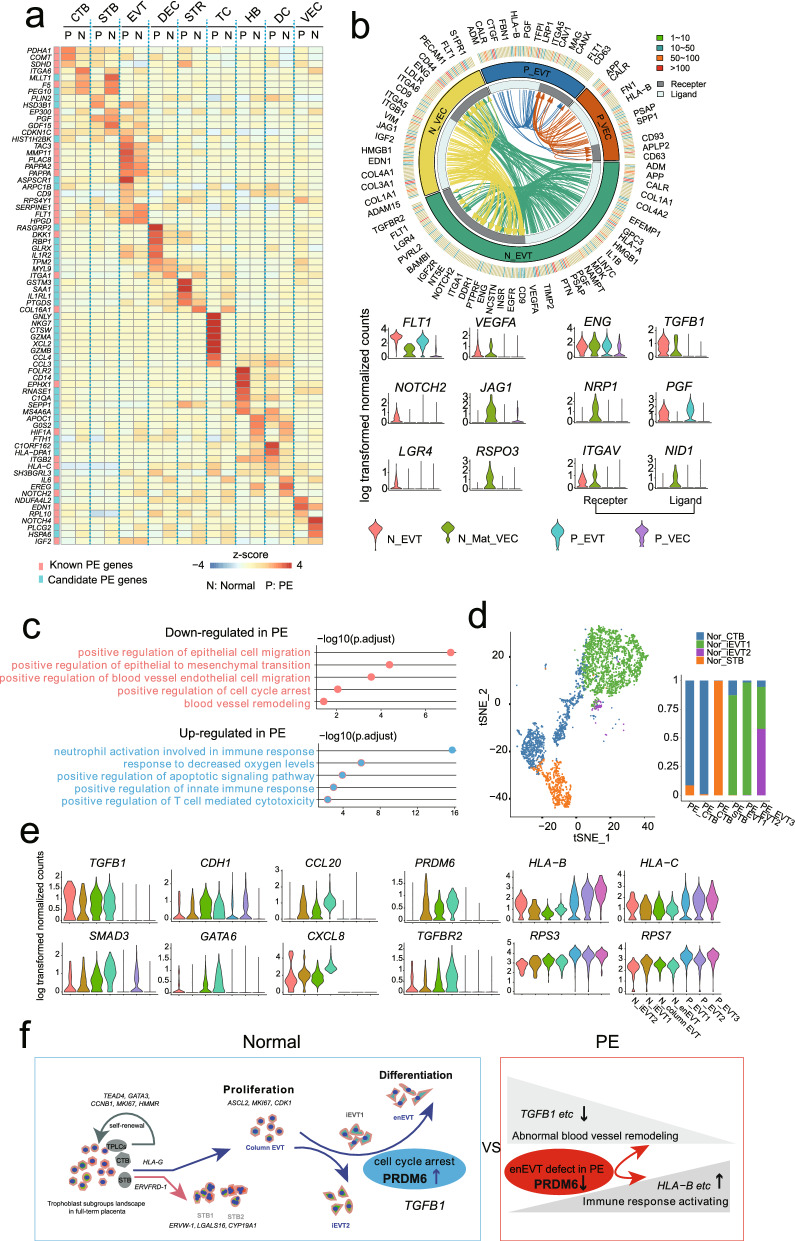
Placenta plays essential role in successful pregnancy, as the most important organ connecting and interplaying between mother and fetus. However, the cellular characteristics and molecular interaction of cell populations within the fetomaternal interface is still poorly understood. Here, we surveyed the single-cell transcriptomic landscape of human full-term placenta and revealed the heterogeneity of cytotrophoblast cell (CTB) and stromal cell (STR) with the fetal/maternal origin consecutively localized from fetal section (FS), middle section (Mid_S) to maternal section (Mat_S) of maternal-fetal interface. Then, we highlighted a subpopulation of CTB, named trophoblast progenitor-like cells (TPLCs) existed in the full-term placenta and mainly distributed in Mid_S, with high expression of a pool of putative cell surface markers. Further, we revealed the putative key transcription factor PRDM6 that might promote the differentiation of endovascular extravillous trophoblast cells (enEVT) by inhibiting cell proliferation, and down-regulation of PRDM6 might lead to an abnormal enEVT differentiation process in PE. Together, our study offers important resources for better understanding of human placenta and stem cell-based therapy, and provides new insights on the study of tissue heterogeneity, the clinical prevention and control of PE as well as the maternal-fetal interface.


Conflict of interest statement

The authors declare no competing interests.

Figures

Figure 1
Figure 1
Dissecting cellular heterogeneity of human full-term placenta. (a) Workflow of single-cell transcriptome profiling of human full-term placenta. (b) T-distributed stochastic neighbor embedding (t-SNE) analysis of human full-term placenta (Left). Each dot represents an individual cell. Colors indicate cell type or state. PV, perivascular cell; STR, stromal cell; IMM, immune cell; CTB, villous cytotrophoblast; EVT, extravillous trophoblast; STB, syncytiotrophoblast; VEC, vascular endothelial cell; LEC, lymphatic endothlial cell; DEC, decidual cell. The column chart shows the fraction of indicated cell types (Right). (c) Heatmap showing the top differentially expressed genes of each cell cluster. Color scheme is based on relative gene expression (z-score). (d) t-SNE plot showing the gene expression pattern of selected cell type-specific markers in human placenta. (e) Origin (Left) and location (Right) of each cell is shown using the same layout as in (b). Circles mark cell types with relatively specific origin or spatial localization. (f) Column chart showing the percentage of indicated cell types from fetal or maternal origin in specific spatial location, respectively.
Figure 2
Figure 2
Reconstruction of spatial heterogeneity of cell type and gene expression pattern in the maternal–fetal interface. (a) T-distributed stochastic neighbor embedding (t-SNE) plots shows single-cell transcriptomic clustering of three specific tissue locations (including FS, Mid_S, Mat_S) in full-term maternal–fetal interface, respectively. Each dot represents an individual cell. Cells are colored by cell-type cluster. (b) Boxplot showing the relative expression levels of selected markers for each cell cluster. (c) Selected Gene Ontology (GO) terms identified by highly expressed genes of CTB in FS, Mid_S, and Mat_S, and STR of fetal and maternal origin, respectively. (Highly expressed gene: expressed cell number > 20%; gene coefficient of variability (CV) < 1 and mean greater than 0 in each section). (d) Heatmap showing the selected differentially expressed genes of CTB subpopulations derived from FS, Mid_S and Mat_S. Red corresponds to a high expression level; blue and black correspond to low expression level (the differentially expressed genes were identified by FindAllMarker function in Seurat, P_val_adj < 0.05; avg_logFC > 0.25). (e) Boxplots showing the expression of selected genes from figure (d).
Figure 3
Figure 3
The trophoblast progenitor like cells (TPLCs) existed in human full-term placenta. (a) T-distributed stochastic neighbor embedding (t-SNE) visualization of trophoblast cells from integrated data of full-term placenta cells and the published first-trimester placenta cells shown in Supplementary Fig. 3a. On the right, the barplot shows the proportion of full-term placenta cells and first-trimester placenta cells in each cluster and each cell type. (b) Monocle 2 (version 2.10.1) for pseudotime ordering of trophoblast subgroups that reveals EVT and STB pathway and visualization in biaxial scatter plot. (c) Expression pattern of selected genes across trophoblast differentiation branches on the reconstructed trajectory. Color scheme is based on log-transformed, normalized expression levels. (d) Heatmap showing the expression levels of selected differentially expressed genes that are identified as significantly involved in EVT and STB differentiation pathway. Color scheme is based on relative gene expression (z-score). (e) Heatmap shows the differentially expressed genes among CTB subpopulations, in which one small cluster (C11, termed as TPLCs) shows highly expressed cell cycle-related genes. (f) Boxplot showing the log-transformed, normalized expression of genes selected from (e). (g) Boxplot showing the expression level of selected cell surface genes between TPLCs and other CTB clusters derived from full-term placenta in CTB branch of (b). Two-sided Wilcoxon rank sum test were calculated, *: P < 0.05; **: P < 0.01; ****: P < 0.0001. (h) Column chart showing the percentage of TPLCs derived from indicated gestation and spatial location of first-trimester and full-term placenta. (i) Boxplot showing the differentially expressed genes of TPLCs derived from first-trimester and full-term placenta. Genes were selected from top 50 differentially expressed genes identified by FindAllMarker function in Seurat, P_val_adj < 0.05; avg_logFC > 0). (j) Gene Ontology (GO) enrichment analysis showing the selected functional terms of TPLCs derived from first-trimester and full-term placenta.
Figure 4
Figure 4
Identification of key transcription factor (TFs) regulators during extravillous trophoblast cell differentiation. (a) Partition-based approximate graph abstraction (PAGA) analysis of EVT subpopulations, including column trophoblast cell (column EVT), interstitial extravillous trophoblast cells 1/2 (iEVT1/2), and endovascular extravillous trophoblast cells (enEVT). Lines show connections; line thickness corresponds to the level of connectivity (low (thin) to high (thick) PAGA connectivity). Heatmap showing min–max normalized expression of statistically significant (P < 0.001), dynamically variable TFs from pseudotime analysis for EVT trajectories. (b) The expression pattern of selected DEGs of column EVT, iEVT1 and enEVT. (c) Boxplot visualization of log-transformed, normalized expression of selected TFs in EVT subgroups. (d) Selected Gene Ontology (GO) terms of TFs differentially expressed in column EVT, iEVT1 and enEVT, respectively. (e) STRING database for the regulatory network analysis of selected TFs differentially expressed in column EVT, iEVT1 and enEVT. (f) Model of regulation loops of column EVT differentiation into enEVT. (g) Immunostaining of HLA-G, PRDM6 and HDAC1 in Mat_S of human full-term placenta. Scale bar represents 100 μm.
Figure 5
Figure 5
The transcriptional profiling reveals dysregulation of EVT and VEC in PE. (a) Heatmap showing the expression level of pregnancy disorder-associated genes downloaded from Online Mendelian Inheritance in Man (OMIM) website (https://omim.org/) in specific cell types of human normal and PE placenta. (b) The ligand-receptor interaction between EVT and VEC in normal and PE samples; genes expressed in more than 40% of cells for specific subtype were selected. Each arrow represents the paired ligand-receptor, and ligands with the same arrow color = belong to the common cell type; violin plots show the selected ligand-receptor pairs for EVT and VEC differentially expressed in normal and PE sample. (c) Gene Ontology (GO) term enrichment analysis of genes up-regulated (upper panel) and down-regulated (lower panel) in PE compared to normal placenta. (d) The T-distributed stochastic neighbor embedding (t-SNE) plot and column chart showing the consistency of trophoblast subtypes. (e) Boxplot showing the expression level of genes associated with EVT proliferation and differentiation in EVT subgroups between normal and PE samples. (f) Proposed schematic of trophoblast subtypes, the self-renewal and differentiation regulated by indicated genes and TFs in human normal and PE placenta.

Similar articles

Cited by

References

    1. Sood R, Zehnder JL, Druzin ML, Brown PO. Gene expression patterns in human placenta. Proc. Natl. Acad. Sci. USA. 2006;103:5478–5483. doi: 10.1073/pnas.0508035103. - DOI - PMC - PubMed
    1. Burton GJ, Jauniaux E. Viewpoint What is the placenta. Am. J. Obstet. Gynecol. 2015;213:S6.e1–S6.e4. doi: 10.1016/j.ajog.2015.07.050. - DOI - PubMed
    1. Ji L, et al. Placental trophoblast cell differentiation: Physiological regulation and pathological relevance to preeclampsia. Mol. Aspects Med. 2013;34:981–1023. doi: 10.1016/j.mam.2012.12.008. - DOI - PubMed
    1. Bs MG, et al. Preeclampsia: novel insights from global RNA profiling of&nbsp;trophoblast subpopulations. Am. J. Obstet. Gynecol. 2017;217(200):e1–200.e17. - PubMed
    1. Phipps EA, Thadhani R, Benzing T, Karumanchi SA. Pre-eclampsia: Pathogenesis, novel diagnostics and therapies. Nat. Rev. Nephrol. 2019;15:275–289. doi: 10.1038/s41581-019-0119-6. - DOI - PMC - PubMed

Publication types