. 2022 Oct;88(4):1673-1689.
doi: 10.1002/mrm.29309. Epub 2022 Jun 28.

Improving in situ acoustic intensity estimates using MR acoustic radiation force imaging in combination with multifrequency MR elastography

Affiliations

Improving in situ acoustic intensity estimates using MR acoustic radiation force imaging in combination with multifrequency MR elastography

Ningrui Li et al. Magn Reson Med. 2022 Oct.

Abstract

Purpose: Magnetic resonance acoustic radiation force imaging (MR-ARFI) enables focal spot localization during nonablative transcranial ultrasound therapies. As the acoustic radiation force is proportional to the applied acoustic intensity, measured MR-ARFI displacements could potentially be used to estimate the acoustic intensity at the target. However, variable brain stiffness is an obstacle. The goal of this study was to develop and assess a method to accurately estimate the acoustic intensity at the focus using MR-ARFI displacements in combination with viscoelastic properties obtained with multifrequency MR elastography (MRE).

Methods: Phantoms with a range of viscoelastic properties were fabricated, and MR-ARFI displacements were acquired within each phantom using multiple acoustic intensities. Voigt model parameters were estimated for each phantom based on storage and loss moduli measured using multifrequency MRE, and these were used to predict the relationship between acoustic intensity and measured displacement.

Results: Using assumed viscoelastic properties, MR-ARFI displacements alone could not accurately estimate acoustic intensity across phantoms. For example, acoustic intensities were underestimated in phantoms stiffer than the assumed stiffness and overestimated in phantoms softer than the assumed stiffness. This error was greatly reduced using individualized viscoelasticity measurements obtained from MRE.

Conclusion: We demonstrated that viscoelasticity information from MRE could be used in combination with MR-ARFI displacements to obtain more accurate estimates of acoustic intensity. Additionally, Voigt model viscosity parameters were found to be predictive of the relaxation rate of each phantom's time-varying displacement response, which could be used to optimize patient-specific MR-ARFI pulse sequences.

Keywords: MR-ARFI; MRgFUS; acoustic radiation force imaging; elastography; transcranial focused ultrasound.


Figures

FIGURE 1
FIGURE 1
(A) Timing of repeated bipolar MEGs are shown relative to three simulated ARF–induced displacement responses, which were modeled as inverse exponential curves with relaxation rates of either 0.1, 1, or 10 ms−1. Using Equation (10), simulated encoded displacement phases were normalized relative to the encoded displacement phase for a fully elastic response (with a relaxation rate of ∞ ms−1), with lower relative displacement phases associated with lower relaxation rates. (B) Encoded displacement phases were simulated for a range of ARF-induced displacement responses, from 10−2 to 102 ms−1, and multiple MEG lobe lengths, varying from 1 to 6 ms. As before, simulated encoded displacement phases were normalized to the encoded displacement phase measured for a fully elastic response. Encoded phases with the three varying relaxation rates (from A) and their loss, relative to the fully elastic response, are annotated by the colored arrows. The sensitivity of MR-ARFI displacements to the relaxation rate increases with shorter MEG lobes.
FIGURE 2
FIGURE 2
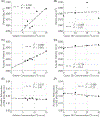
In the first set of phantoms, phantom densities increased with gelatin concentration (A) whereas the densities of castor oil phantoms did not significantly vary with castor oil concentration (B). Phantoms fabricated with increased gelatin concentrations were associated with slightly higher acoustic velocities (C) but higher castor oil concentrations did not result in significantly higher acoustic velocities (D). Finally, neither gelatin concentration (E) nor castor oil concentration (F) was associated with changes in the acoustic attenuation of the phantoms.
FIGURE 3
FIGURE 3
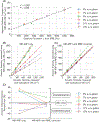
Displacements at the focal spot were measured with MR-ARFI across different phantoms with a range of applied powers. The relationship between measured time-averaged MR-ARFI displacements and the in situ acoustic intensity at the focal spot within each phantom varied with gelatin concentration. At the same estimated in situ acoustic intensity, MR-ARFI displacements varied up to 2–3× across phantoms, with higher MR-ARFI displacements associated with phantoms fabricated with lower gelatin concentrations.
FIGURE 4
FIGURE 4
(A–F) Storage and loss moduli were measured for each gelatin phantom at each actuation frequency. Measurements of the storage modulus are shown in blue, while loss moduli measurements are shown in red. Error bars represent SDs of each measurement. Estimates of the elasticity (μ) and viscosity (η) parameters from the Voigt model were acquired for each phantom, and dashed lines show the corresponding moduli estimates. Estimated elasticity (G) and viscosity (H) parameters increase with higher gelatin concentrations, whereas the relaxation rate parameter (defined as the ratio between elasticity and viscosity parameters) did not vary with gelatin concentration (I). Error bars represent SD errors of each parameter estimate.
FIGURE 5
FIGURE 5
(A–D) Four phantoms were fabricated with castor oil concentrations ranging from 0% to 30% wt/wt. As before, reconstructed maps of the complex shear modulus were acquired at four different actuation frequencies (40, 60, 70, and 80 Hz) for each phantom, and storage and loss moduli were measured at the targeted region within each phantom. Measurements of the storage modulus are shown in blue, while loss moduli measurements are shown in red. Error bars represent SDs of each measurement. Estimates of the elasticity (μ) and viscosity (η) parameters from the Voigt model were acquired for each phantom, and dashed lines show the corresponding moduli estimates. Estimated elasticity (E) and viscosity (F) parameters increased with higher castor oil concentrations, whereas the Voigt model relaxation-rate parameter decreased with castor oil concentration (G). Error bars represent SD errors of each parameter estimate.
FIGURE 6
FIGURE 6
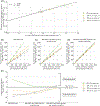
(A) The MR-ARFI-derived apparent stiffness constants were computed for each phantom as the in situ acoustic intensity needed to achieve 1 μm of displacement. Apparent stiffness constants were highly correlated (r2 = 0.983), with Voigt model elasticity parameters estimated from multifrequency magnetic resonance elastography (MRE). Different colors represent phantoms fabricated with varying gelatin concentrations, and error bars represent SD errors of parameter estimates. (B) A representative apparent stiffness constant was estimated with the mean Voigt model elasticity parameter across all phantoms, and time-averaged MR-ARFI displacements for each phantom were mapped to acoustic intensities, assuming all phantoms possessed this apparent stiffness constant. With this method, acoustic intensities were overestimated in phantoms that were softer than the assumed stiffness, whereas acoustic intensities were underestimated in phantoms that were stiffer than the assumed stiffness. (C) Individual apparent stiffness constants were estimated each phantom’s Voigt model elasticity parameters, and MR-ARFI displacements for each phantom were mapped to acoustic intensities using individualized apparent stiffness constants. With additional elasticity information from MRE, superior agreement between estimated and measured acoustic intensities were achieved across phantoms of varying stiffnesses. (D) Mean percent errors for acoustic intensity estimates were computed for each phantom by averaging across the four sonications, with the mean absolute percent error reduced from 36.3% to 8.4% following MRE correction. Error bars represent SDs in percent error.
FIGURE 7
FIGURE 7
Multiple MR-ARFI displacement phases were acquired in castor oil phantoms by varying the start of the FUS relative to the start of the second MEG lobe by −6 to 1 ms. Encoded displacement phases were simulated by assuming the displacement response imitated an inverse exponential curve following the onset and offset of FUS, and the relaxation rate of the ARF-induced displacement response of each phantom was estimated by minimizing the mean squared error between normalized simulated and measured displacement phases. Measured normalized displacement phases are represented by the colored dots, with different colors representing phantoms fabricated with varying amounts of castor oil. Correspondingly colored dashed lines represent normalized displacement phases predicted by the model, and the estimated relaxation rates for each phantom are displayed in the legend.
FIGURE 8
FIGURE 8
(A) Voigt model relaxation rate parameters were correlated of the relaxation rates of the displacement response measured by MR-ARFI (r2 = 0.965). (B) A representative apparent stiffness constant was estimated using the mean Voigt model elasticity parameter across this set of four phantoms fabricated with 0% to 30% wt/wt castor oil, and this apparent stiffness constant was used alongside MR-ARFI displacements for each phantom to produce naïve acoustic intensity estimates. As before, acoustic intensities were underestimated in phantoms stiffer than the assumed mean stiffness, whereas they were overestimated in phantoms softer than the assumed mean stiffness. (C) Next, acoustic intensities were predicted using individualized apparent stiffness constants computed using each phantom’s Voigt model elasticity parameter. The error in estimated acoustic intensities was low for the phantom fabricated without castor oil; however, acoustic intensities were underestimated in other phantoms due to additional dampening of ARF-induced displacement responses from increased viscosity. (D) A secondary correction was applied to account for differences in viscosity by multiplying acoustic intensity estimates by the ratio between encoded displacements in each phantom relative to those in the phantom fabricated without castor oil. Estimation errors in phantoms fabricated with castor oil were reduced following this correction. (E) Mean percent errors for acoustic intensity estimates were computed for each castor oil phantom by averaging across the four sonications, and error bars represent SDs in percent error. Following MRE elasticity correction, the mean absolute percent error decreased from 27.1% to 17.3%; however, absolute percent errors remained approximately the same for phantoms fabricated with castor oil. Mean absolute percent errors were significantly reduced further to 3.8% in castor oil phantoms following the secondary MRE viscosity correction.

Similar articles

Cited by

References

    1. Vyas U, Ghanouni P, Halpern CH, Elias J, Pauly KB. Predicting variation in subject thermal response during transcranial magnetic resonance guided focused ultrasound surgery: comparison in seventeen subject datasets. Med Phys 2016; 43:5170–5180. - PMC - PubMed
    1. Rieke V, Butts PK. MR thermometry. J Magn Reson Imaging 2008;27:376–390. - PMC - PubMed
    1. Boutet A, Ranjan M, Zhong J, et al. Focused ultrasound thalamotomy location determines clinical benefits in patients with essential tremor. Brain 2018;141:3405–14. - PubMed
    1. Dallapiazza RF, Timbie KF, Holmberg S, et al. Noninvasive neuromodulation and thalamic mapping with low-intensity focused ultrasound. J Neurosurg 2018;128:875–84. - PMC - PubMed
    1. Constans C, Mateo P, Tanter M, Aubry JF. Potential impact of thermal effects during ultrasonic neurostimulation: retrospective numerical estimation of temperature elevation in seven rodent setups. Phys Med Biol 2018;63:025003. - PubMed

Publication types