

Usefulness of Random Forest Algorithm in Predicting Severe Acute Pancreatitis
- PMID: 35755843
- PMCID: PMC9226542
- DOI: 10.3389/fcimb.2022.893294
Usefulness of Random Forest Algorithm in Predicting Severe Acute Pancreatitis
Abstract
Background and aims: This study aimed to develop an interpretable random forest model for predicting severe acute pancreatitis (SAP).
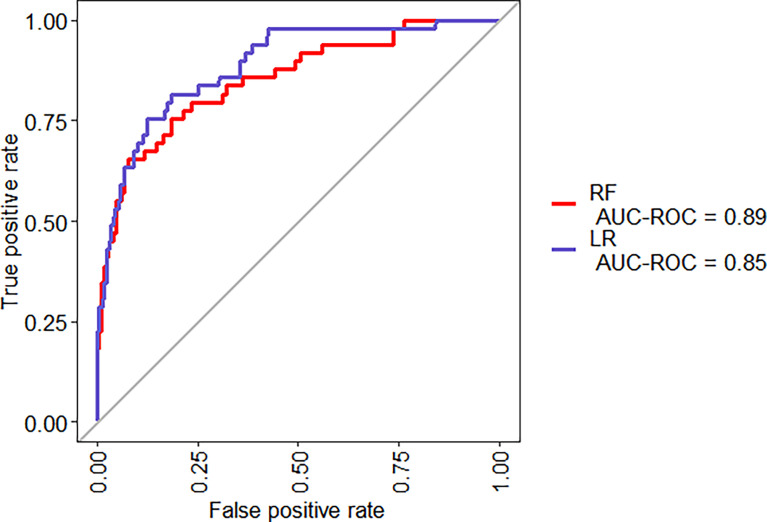
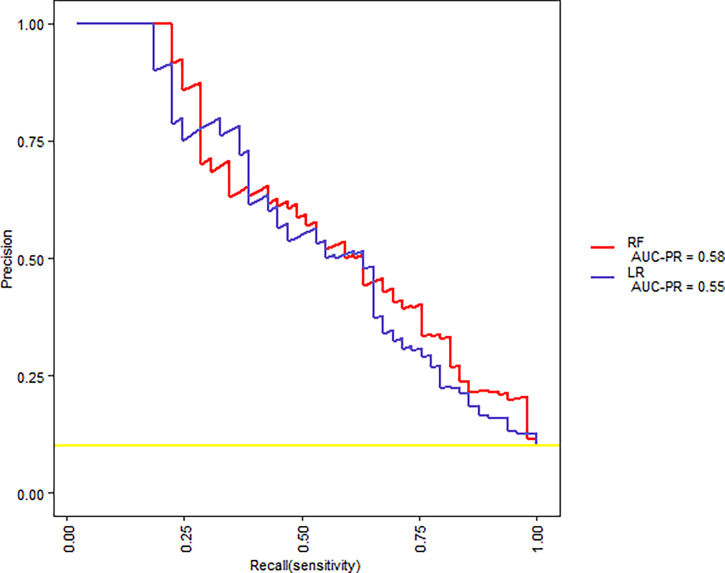
Methods: Clinical and laboratory data of 648 patients with acute pancreatitis were retrospectively reviewed and randomly assigned to the training set and test set in a 3:1 ratio. Univariate analysis was used to select candidate predictors for the SAP. Random forest (RF) and logistic regression (LR) models were developed on the training sample. The prediction models were then applied to the test sample. The performance of the risk models was measured by calculating the area under the receiver operating characteristic (ROC) curves (AUC) and area under precision recall curve. We provide visualized interpretation by using local interpretable model-agnostic explanations (LIME).
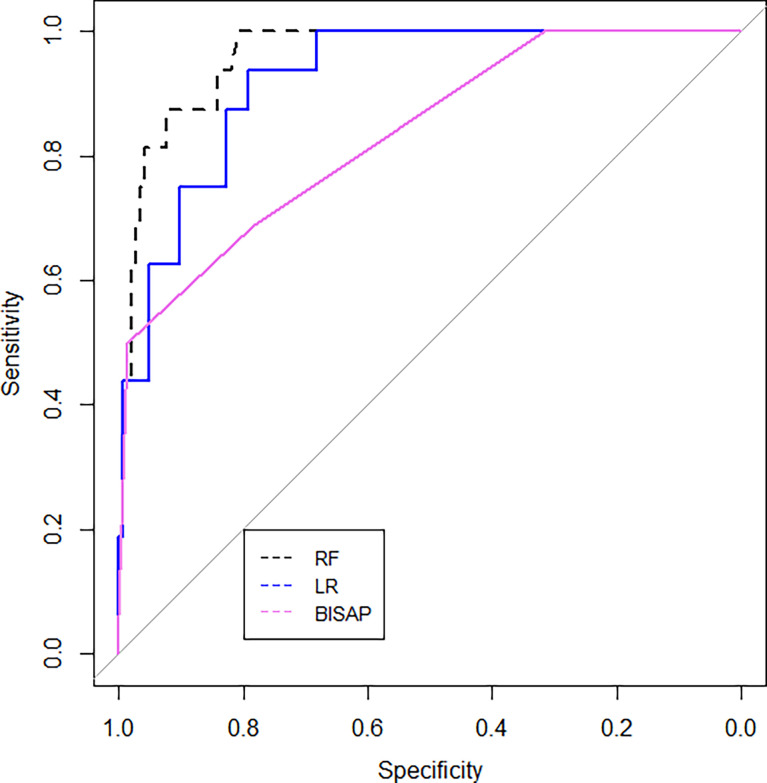
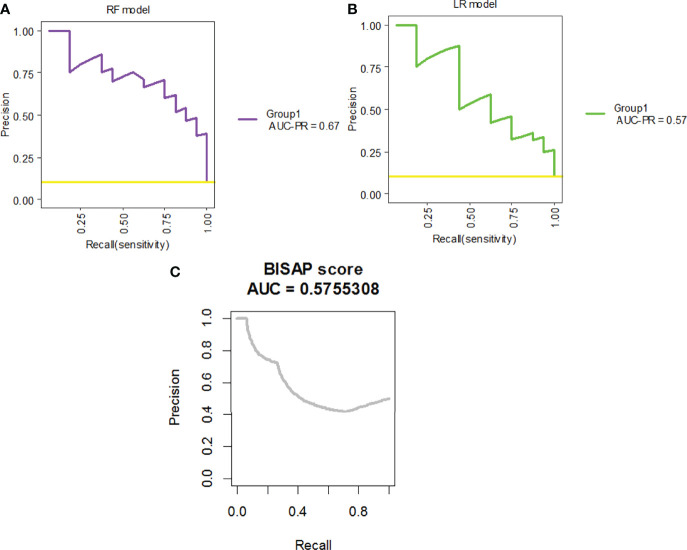
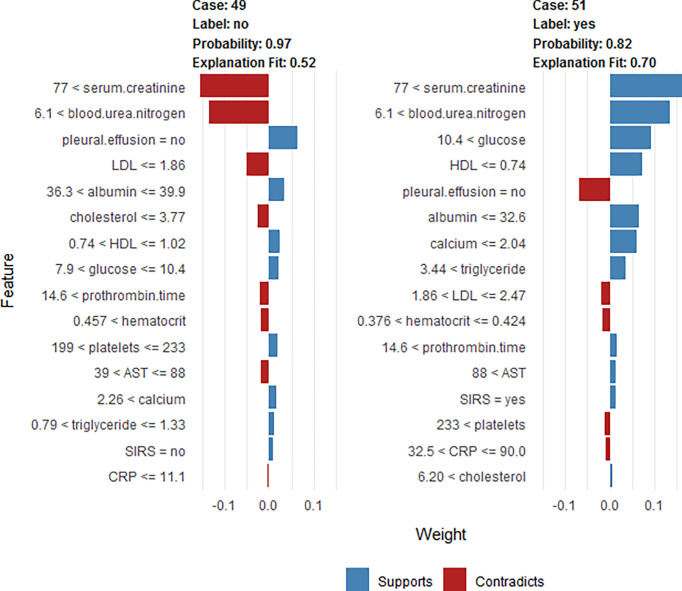
Results: The LR model was developed to predict SAP as the following function: -1.10-0.13×albumin (g/L) + 0.016 × serum creatinine (μmol/L) + 0.14 × glucose (mmol/L) + 1.63 × pleural effusion (0/1)(No/Yes). The coefficients of this formula were utilized to build a nomogram. The RF model consists of 16 variables identified by univariate analysis. It was developed and validated by a tenfold cross-validation on the training sample. Variables importance analysis suggested that blood urea nitrogen, serum creatinine, albumin, high-density lipoprotein cholesterol, low-density lipoprotein cholesterol, calcium, and glucose were the most important seven predictors of SAP. The AUCs of RF model in tenfold cross-validation of the training set and the test set was 0.89 and 0.96, respectively. Both the area under precision recall curve and the diagnostic accuracy of the RF model were higher than that of both the LR model and the BISAP score. LIME plots were used to explain individualized prediction of the RF model.
Conclusions: An interpretable RF model exhibited the highest discriminatory performance in predicting SAP. Interpretation with LIME plots could be useful for individualized prediction in a clinical setting. A nomogram consisting of albumin, serum creatinine, glucose, and pleural effusion was useful for prediction of SAP.
Keywords: LIME plot; acute pancreatitis; artificial intelligence; nomogram; predictor; random forest.
Copyright © 2022 Hong, Lu, Zhou, Jin, Pan, Lin, Yang, Basharat, Zippi and Goyal.
Conflict of interest statement
The authors declare that the research was conducted in the absence of any commercial or financial relationships that could be construed as a potential conflict of interest.
Figures


Similar articles
-
A Comparison of XGBoost, Random Forest, and Nomograph for the Prediction of Disease Severity in Patients With COVID-19 Pneumonia: Implications of Cytokine and Immune Cell Profile.Front Cell Infect Microbiol. 2022 Apr 12;12:819267. doi: 10.3389/fcimb.2022.819267. eCollection 2022. Front Cell Infect Microbiol. 2022. PMID: 35493729 Free PMC article.
-
[Application of machine learning model based on XGBoost algorithm in early prediction of patients with acute severe pancreatitis].Zhonghua Wei Zhong Bing Ji Jiu Yi Xue. 2023 Apr;35(4):421-426. doi: 10.3760/cma.j.cn121430-20221019-00930. Zhonghua Wei Zhong Bing Ji Jiu Yi Xue. 2023. PMID: 37308200 Chinese.
-
Automated Machine Learning for the Early Prediction of the Severity of Acute Pancreatitis in Hospitals.Front Cell Infect Microbiol. 2022 Jun 10;12:886935. doi: 10.3389/fcimb.2022.886935. eCollection 2022. Front Cell Infect Microbiol. 2022. PMID: 35755847 Free PMC article.
-
The Value of BISAP Score for Predicting Mortality and Severity in Acute Pancreatitis: A Systematic Review and Meta-Analysis.PLoS One. 2015 Jun 19;10(6):e0130412. doi: 10.1371/journal.pone.0130412. eCollection 2015. PLoS One. 2015. PMID: 26091293 Free PMC article. Review.
-
Prediction of moderately severe and severe acute pancreatitis in pregnancy: Several issues.World J Gastroenterol. 2022 Sep 7;28(33):4926-4928. doi: 10.3748/wjg.v28.i33.4926. World J Gastroenterol. 2022. PMID: 36156931 Free PMC article. Review.
Cited by
-
Relationship between Cholesterol-Related Lipids and Severe Acute Pancreatitis: From Bench to Bedside.J Clin Med. 2023 Feb 21;12(5):1729. doi: 10.3390/jcm12051729. J Clin Med. 2023. PMID: 36902516 Free PMC article. Review.
-
Development of a Novel Nomogram Incorporating Red Blood Cell Distribution Width-Albumin Ratio for the Prediction of 30-day Mortality in Acute Pancreatitis Patients.Emerg Med Int. 2022 Nov 28;2022:1573931. doi: 10.1155/2022/1573931. eCollection 2022. Emerg Med Int. 2022. PMID: 36478954 Free PMC article.
-
Fabp5 is a common gene between a high-cholesterol diet and acute pancreatitis.Front Nutr. 2023 Dec 22;10:1284985. doi: 10.3389/fnut.2023.1284985. eCollection 2023. Front Nutr. 2023. PMID: 38188879 Free PMC article.
-
Nomogram and Web Calculator Based on Lasso-Logistic Regression for Predicting Persistent Organ Failure in Acute Pancreatitis Patients.J Inflamm Res. 2024 Feb 7;17:823-836. doi: 10.2147/JIR.S445929. eCollection 2024. J Inflamm Res. 2024. PMID: 38344308 Free PMC article.
-
Application of machine learning in prediction of bone cement leakage during single-level thoracolumbar percutaneous vertebroplasty.BMC Surg. 2023 Mar 23;23(1):63. doi: 10.1186/s12893-023-01959-y. BMC Surg. 2023. PMID: 36959639 Free PMC article.
References
-
- Al’Aref S. J., Maliakal G., Singh G., Van Rosendael A. R., Ma X., Xu Z., et al. . (2020). Machine Learning of Clinical Variables and Coronary Artery Calcium Scoring for the Prediction of Obstructive Coronary Artery Disease on Coronary Computed Tomography Angiography: Analysis From the CONFIRM Registry. Eur. Heart J. 41, 359–367. doi: 10.1093/eurheartj/ehz565 - DOI - PMC - PubMed
Publication types
MeSH terms
Substances
LinkOut - more resources
Full Text Sources
Medical
Research Materials
Miscellaneous