. 2022 Sep;236(1):e13857.
doi: 10.1111/apha.13857. Epub 2022 Jul 2.

The highly expressed calcium-insensitive synaptotagmin-11 and synaptotagmin-13 modulate insulin secretion

Affiliations

The highly expressed calcium-insensitive synaptotagmin-11 and synaptotagmin-13 modulate insulin secretion

Jones K Ofori et al. Acta Physiol (Oxf). 2022 Sep.

Abstract

Aim: SYT11 and SYT13, two calcium-insensitive synaptotagmins, are downregulated in islets from type 2 diabetic donors, but their function in insulin secretion is unknown. To address this, we investigated the physiological role of these two synaptotagmins in insulin-secreting cells.

Methods: Correlations between gene expression levels were performed using previously described RNA-seq data on islets from 188 human donors. SiRNA knockdown was performed in EndoC-βH1 and INS-1 832/13 cells. Insulin secretion was measured with ELISA. Patch-clamp was used for single-cell electrophysiology. Confocal microscopy was used to determine intracellular localization.

Results: Human islet expression of the transcription factor PDX1 was positively correlated with SYT11 (p = 2.4e-10 ) and SYT13 (p < 2.2e-16 ). Syt11 and Syt13 both co-localized with insulin, indicating their localization in insulin granules. Downregulation of Syt11 in INS-1 832/13 cells (siSYT11) resulted in increased basal and glucose-induced insulin secretion. Downregulation of Syt13 (siSYT13) decreased insulin secretion induced by glucose and K+ . Interestingly, the cAMP-raising agent forskolin was unable to enhance insulin secretion in siSYT13 cells. There was no difference in insulin content, exocytosis, or voltage-gated Ca2+ currents in the two models. Double knockdown of Syt11 and Syt13 (DKD) resembled the results in siSYT13 cells.

Conclusion: SYT11 and SYT13 have similar localization and transcriptional regulation, but they regulate insulin secretion differentially. While downregulation of SYT11 might be a compensatory mechanism in type-2 diabetes, downregulation of SYT13 reduces the insulin secretory response and overrules the compensatory regulation of SYT11 in a way that could aggravate the disease.

Keywords: diabetes; exocytosis; insulin secretion; islet; synaptotagmin; type-2 diabetes.


Conflict of interest statement

The authors declare no conflict of interest.

Figures
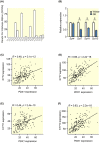
FIGURE 1
FIGURE 1
Gene expression of SYTs in human and GK islets and Spearman correlations between the most highly expressed SYTs and PDX1 in human islets. (A) Processed previously described RNA sequencing data obtained from publicly available repositories (GSE50398, GSE108072) showing SYT expression in islets from 188 human donors. Expression is shown as Reads Per Kilobase Million (RPKM). (B) qPCR data from GK rat islets (blue bars) and Wistar control islets (white bars) showing the relative expression of the four most highly expressed SYTs in (A). Spearman correlations between PDX1 and (C) SYT4, (D) SYT7, (E) SYT11, and (F) SYT13 using the data in (A) in RPKM. Data are presented as mean ± SEM of 188 donors in (A) and 7–8 rats in (B). *p ≤ 0.05, p ≤ 0.01, p < 0.001.
FIGURE 2
FIGURE 2
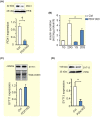
Effects of PDX1 downregulation on insulin secretion, SYT11, and SYT13 protein expression in EndoC‐βH1 cells. (A) Western Blot showing the effects of PDX‐1 downregulation in EndoC‐βH1 on the expression of PDX1. (B) Effect of PDX1 knockdown (blue bars) on insulin secretion at 1 mM glucose (1G) and 20 mM glucose (20G) as indicated in the figure. (C) Western Blot showing the effects of PDX1 knockdown on the protein expression of SYT11 and (D) SYT13. Data are presented as mean ± SEM of four individual experiments in (B–D). *p ≤ 0.05, p ≤ 0.01.
FIGURE 3
FIGURE 3
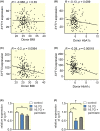
Spearman correlations between SYT11 or SYT13 and BMI and HbA1c, and the effect of glucolipotoxicity on their expression. (A) The Spearman correlation using gene expression values as RPKM between (A) SYT11 and BMI (B) SYT11 and HbA1c (C) SYT13 and BMI and (D) SYT13 and HbA1c in RNA sequencing data obtained from publicly available repositories (GSE50398, GSE108072) from 188 donors. (E) Relative expression of syt11 in INS‐1 832/13 cells treated with 16.7 mM glucose (16G; blue bars) or 16.7 mM glucose + 0.5 mM palmitate (16.7G + palmitate; gray bars) compared to control (control; white bars). (F) Relative expression of syt13 in INS‐1 832/13 cells treated with 16.7 mM glucose (16G; blue bars) or 16.7 mM glucose + 0.5 mM palmitate (16.7G + palmitate; gray bars) compared to control (control; white bars). Data are presented as mean ± SEM of four individual experiments in (E) and (F) *p ≤ 0.05, p ≤ 0.01.
FIGURE 4
FIGURE 4
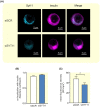
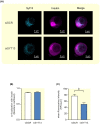
Colocalization between Syt11 and insulin in INS‐1 832/13 cells. (A) Representative confocal images of Syt11 (light blue) and insulin (violet) in INS‐1 832/13 control cells (siSCR) and cells treated with siRNA against Syt11 (siSYT11). (B) Colocalization of Syt11 and insulin quantified with Manders coefficient in siSCR (white bar) and siSYT11 (blue bar) cells. (C) Quantification of the mean fluorescence intensity of Syt11 in siSCR (white bar) and siSYT11 (blue bar) cells. Data are given as mean ± SEM from 21 to 24 cells. *p ≤ 0.05.
FIGURE 5
FIGURE 5
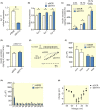
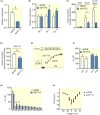
Knockdown of Syt11 and its effect on insulin secretion and exocytosis in INS‐1 832/13 cells. (A) Expression of Syt11 after silencing with siRNA (siSYT11; blue bar) relative to its expression using scramble control (siSCR; white bar). (B) Relative expression of Syt4, Syt7, and Syt13 in siSYT11 (blue bars) and siSCR (white bars) cells. (C) Insulin secretion in siSYT11 (blue bars) and siSCR (white bars) cells after stimulation for 1 h in 2.8 mM glucose (2.8G), 16.7 mM glucose (16.7G), or 16.7 mM glucose + 2.5 μM forskolin (16.7G + forsk) as indicated. (D) Insulin secretion in siSYT11 (blue bars) and siSCR (white bars) cells after stimulation with 50 mM K+ in 2.8 mM glucose for 15 min. (E) Representative traces of depolarization‐induced increases in membrane capacitance in siSYT11 (black trace) and siSCR (gray trace) cells. (F) Summed capacitance changes (sum) and the total capacitance change (total) for siSyt11 (blue bar) and siSCR (white bar) after a train of ten 500 ms long depolarisations. (G) The capacitance change for siSYT11 (blue bar) and siSCR (white bar) after each individual pulse in (F). (H) Charge–voltage relationships in siSYT11 cells (black circles) compared to their scramble control (black squares). Data are given as mean ± SEM from three to five experiments in (A–D) and 15 cells in (E–G). *p ≤ 0.05, p ≤ 0.01, p < 0.001.
FIGURE 6
FIGURE 6
Colocalization between Syt13 and insulin in INS‐1 832/13 cells. (A) Representative confocal images of Syt13 (light blue) and insulin (violet) in INS‐1 832/13 control cells (siSCR) and cells treated with siRNA against Syt13 (siSYT13). (B) Colocalization of Syt13 and insulin quantified with Manders coefficient in siSCR (white bar) and siSYT13 (blue bar) cells. (C) Quantification of the mean fluorescence intensity of Syt13 in siSCR (white bar) and siSYT13 (blue bar) cells. Data are given as mean ± SEM from 22 to 23 cells; p < 0.001.
FIGURE 7
FIGURE 7
Knockdown of Syt13 and its effect on insulin secretion and exocytosis in INS‐1 832/13 cells. (A) Expression of Syt13 after silencing with siRNA (siSYT13; blue bar) relative to its expression using scramble control (siSCR; white bar). (B) Relative expression of Syt4, Syt7, and Syt11 in siSYT13 (blue bars) and siSCR (white bars) cells (C) Insulin secretion in siSYT13 (blue bars) and siSCR (white bars) cells after stimulation for 1 h in 2.8 mM glucose (2.8G), 16.7 mM glucose (16.7G), or 16.7 mM glucose + 2.5 μM forskolin (16.7G + forsk) as indicated. (D) Insulin secretion in siSYT11 (blue bars) and siSCR (white bars) cells after stimulation with 50 mM K+ in 2.8 mM glucose for 15 min. (E) Representative traces of depolarization‐induced increases in membrane capacitance in siSYT13 (black trace) and siSCR (gray trace) cells. (F) Summed capacitance changes (sum) and the total capacitance change (total) for siSYT13 (blue bar) and siSCR (white bar) after a train of ten 500 ms long depolarisations. (G) The capacitance change for siSYT13 (blue bar) and siSCR (white bar) after each individual pulse in (F). (H) Charge—voltage relationships siSYT13 cells (black circles) compared to scramble controls (black squares). Data are given as mean ± SEM from three to five experiments in (A–D) and 28–29 cells in (E–H). *p ≤ 0.05, p ≤ 0.01, p < 0.001.
FIGURE 8
FIGURE 8
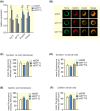
Expression of exo‐ and endocytotic genes in siSYT11 and siSYT13. (A) Relative expression of selected exocytotic genes in siSYT11 (blue bars) and siSYT13 (gray bars) compared to control (siSCR; white bars). (B) Representative confocal images of Syntaxin 1a (Stx1a;green), Clathrin (red), and Insulin (yellow) in a INS‐1 832/13 control cells (siSCR) a siSYT11 cell and a siSYT13 cell. Amount of syntaxin 1a estimated by mean fluorescence intensity in (C) the cell membrane and (D) the whole cell. Amount of clathrin estimated by mean fluorescence intensity in (C) the cell membrane and (D) the whole cell. Data are given as mean ± SEM from four experiments in (A) and 22–26 cells in (C–F). *p ≤ 0.05, p ≤ 0.01, p < 0.001.
FIGURE 9
FIGURE 9
Double knockdown of Syt11 and Syt13 and its effect on insulin secretion in INS‐1 832/13 cells. (A) Expression of Syt11 and Syt13 (blue bar) after double silencing with siRNA (siDKD) relative to its expression using scramble control (siSCR; white bar). (B) Relative expression of Syt4 and Syt7 in siDKD (blue bars) and siSCR (white bars) cells. (C) Relative expression of selected exocytotic genes in siDKD (blue bars) compared to control (siSCR; white bars). (D) Insulin secretion in siDKD (blue bars) and siSCR (white bars) cells after stimulation for 1 h in 2.8 mM or 16.7 mM glucose as indicated. (E) Insulin secretion in siDKD (blue bars) and siSCR (white bars) cells after stimulation with 50 mM K+ in 2.8 mM glucose for 15 min. Data are given as mean ± SEM from four experiments. *p ≤ 0.05, p ≤ 0.01, p < 0.001.

Similar articles

Cited by

References

    1. Rorsman P, Ashcroft FM. Pancreatic β‐cell electrical activity and insulin secretion: of mice and men. Physiol Rev. 2018;98(1):117‐214. - PMC - PubMed
    1. Gustavsson N, Lao Y, Maximov A, et al. Impaired insulin secretion and glucose intolerance in synaptotagmin‐7 null mutant mice. Proc Natl Acad Sci. 2008;105(10):3992‐3997. - PMC - PubMed
    1. Wolfes AC, Dean C. The diversity of synaptotagmin isoforms. Curr Opin Neurobiol. 2020;63:198‐209. - PubMed
    1. Iezzi M, Eliasson L, Fukuda M, Wollheim CB. Adenovirus‐mediated silencing of synaptotagmin 9 inhibits Ca2+‐dependent insulin secretion in islets. FEBS Lett. 2005;579(23):5241‐5246. - PubMed
    1. Gauthier BR, Wollheim CB. Synaptotagmins bind calcium to release insulin. Am J Physiol Endocrinol Metab. 2008;295(6):E1279‐E1286. - PubMed

Publication types