. 2022 Jun 28;119(26):e2116738119.
doi: 10.1073/pnas.2116738119. Epub 2022 Jun 24.

Harnessing anti-cytomegalovirus immunity for local immunotherapy against solid tumors

Affiliations

Harnessing anti-cytomegalovirus immunity for local immunotherapy against solid tumors

Nicolas Çuburu et al. Proc Natl Acad Sci U S A. .

Abstract

Tumor infiltration by T cells profoundly affects cancer progression and responses to immunotherapy. However, the tumor immunosuppressive microenvironment can impair the induction, trafficking, and local activity of antitumor T cells. Here, we investigated whether intratumoral injection of virus-derived peptide epitopes could activate preexisting antiviral T cell responses locally and promote antitumor responses or antigen spreading. We focused on a mouse model of cytomegalovirus (CMV), a highly prevalent human infection that induces vigorous and durable T cell responses. Mice persistently infected with murine CMV (MCMV) were challenged with lung (TC-1), colon (MC-38), or melanoma (B16-F10) tumor cells. Intratumoral injection of MCMV-derived T cell epitopes triggered in situ and systemic expansion of their cognate, MCMV-specific CD4+ or CD8+ T cells. The MCMV CD8+ T cell epitopes injected alone provoked arrest of tumor growth and some durable remissions. Intratumoral injection of MCMV CD4+ T cell epitopes with polyinosinic acid:polycytidylic acid (pI:C) preferentially elicited tumor antigen-specific CD8+ T cells, promoted tumor clearance, and conferred long-term protection against tumor rechallenge. Notably, secondary proliferation of MCMV-specific CD8+ T cells correlated with better tumor control. Importantly, intratumoral injection of MCMV-derived CD8+ T cell-peptide epitopes alone or CD4+ T cell-peptide epitopes with pI:C induced potent adaptive and innate immune activation of the tumor microenvironment. Thus, CMV-derived peptide epitopes, delivered intratumorally, act as cytotoxic and immunotherapeutic agents to promote immediate tumor control and long-term antitumor immunity that could be used as a stand-alone therapy. The tumor antigen-agnostic nature of this approach makes it applicable across a broad range of solid tumors regardless of their origin.

Keywords: antigen spreading; antiviral immunity; cytomegalovirus; intratumoral immunotherapy; tumor microenvironment.


Conflict of interest statement

Competing interest statement: The authors declare a competing interest. N.C. and J.T.S. have filed an employee invention report through the National Cancer Institute, NIH, related to Novel Cancer Treatment Utilizing Preexisting Microbial Immunity.

Figures

Fig. 1.
Fig. 1.
Memory phenotype and cytokine production by MCMV-specific T cells in MCMV infected C57BL/6 mice. (A) representative fluorescence-activated cell sorting plot of IE3 and m45 tetramer staining of CD8+ T cells and expression of CD127 and CD62L by tetramer-positive CD8+ T cells in blood. (B) IE3 and m45 tetramer+ CD8+ T cells for each individual mice are shown at 1 mo and 5 mo after infection. (C) Production of IFN-γ, TNF-α, and IL2 by CD8+ T cells after in vitro stimulation of splenocytes with a pool of seven MCMV peptides (IE3, m38, m45, m57, m139, m141, and m164). (D and E) Production of IFN-γ by spleen (D) CD8+ T cells and (E) CD4+ T cells after in vitro stimulation with indicated MCMV peptides. Statistical significance was assessed by paired Student t test. *P < 0.05, representative of two experiments (n = 10). n.s., not significant.
Fig. 2.
Fig. 2.
Inflationary and noninflationary MCMV-specific CD8+ T cells infiltrate solid tumors. (A) C57BL/6 mice were infected with MCMV and implanted 6 mo later with TC-1 tumors. When tumor reached 100 mm3, infiltration by MCMV T cells was assessed by tetramer staining. (B) Representative fluorescence-activated cell sorting plot of IE3 and m45 tetramer staining of CD8+ T cells in lymph nodes, spleen, salivary gland, and tumor tissues, and expression of CD69 and CD103 by tetramer-positive CD8+ T cells. (C) Data are shown as mean percentage ± SD of expression of CD69 (blue bars) and CD103 (red bars) by MCMV tetramer-positive and bulk CD8+ T cells in tumor-draining lymph nodes, spleen, salivary gland, and tumors. Statistical significance was assessed by Dunn test. ***P < 0.001, **P < 0.01, *P < 0.05, representative of two experiments (n = 4). i.p., intraperitoneal; ns, not significant; s.c., subcutaneous.
Fig. 3.
Fig. 3.
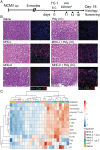
Intratumoral administration of MCMV epitopes induces profound changes in the nature of the tumor cellular immune infiltrate. (A) Experimental design. MCMV-infected C57BL/6 mice were transplanted with TC-1 tumors. When tumors reached 100 mm3, they were injected i.t. three times with saline, pI:C– (50 μg), MHC-I– (1 μg each: IE3, m38, and m45), and MHC-II– (3 μg, m139) restricted peptides with or without pI:C. (B) Hematoxylin and eosin staining and immunofluorescence microscopy analysis of CD8+ and CD4+ T cells in the tumor bed. (C) Heat map of z-scores of cellular immune infiltrate scores deconvoluted from the Nanostring PanCancer Immune profiling data set; single experiment (n = 4). DC, dendritic cell; Treg, T regulatory cell; i.p., intraperitoneal; s.c., subcutaneous.
Fig. 4.
Fig. 4.
Intratumoral administration of MCMV epitopes induces broad cellular infiltration and local immune activation of the tumor microenvironment. (A) MCMV-infected C57BL/6 mice were transplanted with TC-1 tumors. When tumors reached 100 mm3, they were injected i.t. three times with saline, pI:C– (50 μg), MHC-I– (1 μg each: IE3, m38, and m45), and MHC-II– (3 μg, m139) restricted peptides with or without pI:C. Tumor RNA was extracted 48 h after the third injection and analyzed with the Nanostring PanCancer Immune Profiling panel (n = 4). (B) Volcano plot representation of the differential expression of each group compared with saline. Adjusted (adj.) P values were generated using the Benjamini–Yekutieli procedure. (C) Representative differentially regulated genes after i.t. injection for T cell function, antigen presentation, tissue damage, and inflammation. Statistical significance was assessed by Dunn test. ****P < 0.0001, ***P < 0.001, **P < 0.01, *P < 0.05. Single experiment (n = 4). i.p., intraperitoneal; s.c., subcutaneous.
Fig. 5.
Fig. 5.
Intratumoral injection of MHC-I restricted MCMV epitopes delays tumor growth. (A) Experimental design. C57BL/6 mice were transplanted with TC-1 tumors 6 mo after MCMV infection. Tumor growth was monitored every second day. Tumors were injected six times with saline, pI:C (50 μg), and IE3, m38, and m45 MHC-I epitopes with or without pI:C (B and C) with 1 μg of each peptide or (D and E) with 0.01 μg or 0.1 μg of each peptide. Tumor volume was monitored two to three times a week. (B and D) Tumor growth is shown as mean tumor volume for each group and SE. (C and E) Survival curve for each group is shown. (X indicates treatment immune-related toxicity). Statistical significance was assessed by Mantel–Cox test for survival analysis and Dunn's test for tumor volume analysis. ***P < 0.001, **P < 0.01, *P < 0.05, representative of two experiments (n = 5). i.p., intraperitoneal; n.s., not significant; s.c., subcutaneous.
Fig. 6.
Fig. 6.
Sequential i.t. administration of MHC-II– and MHC-I–restricted MCMV epitopes promotes long-term tumor control and antitumor immunity. (A) Experimental design. MCMV-infected C57BL/6 mice were transplanted with TC-1 tumors. Tumors were injected six times with MCMV-derived peptides plus pI:C. Saline (n = 6 times), MHC-I (IE3, m38, and m45, 1 μg each; n = 6 times), MHC-II (m139, 3 μg; n = 6 times), sequentially MHC-II (m139, 3 μg; n = 3 times), then MHC-I (IE3, m38, and m45, 1 μg each; n = 3 times), sequentially MHC-I (IE3, m38, and m45, 1 μg each; n = 3 times) then MHC-II (m139, 3 μg; n = 3 times), or MHC-I (IE3, m38, and m45, 1 μg each) admixed with MHC-II (m139, 3 μg; n = 6 times). (B) Tumor volume measurement and (C) survival (X indicates treatment immune-related toxicity). (D) E7-specific tetramer+CD8+ T cells in blood 48 h after treatment (complete cure, circled). (E) TC-1 tumor rechallenge of long-term survivors 4 mo after clearance of primary tumor. Tumor volume was monitored two to three times a week. (B and E) Tumor growth is shown as mean tumor volume for each group and SE. (C) Survival curve for each group is shown (n = 6). Statistical significance was assessed by Mantel–Cox test for survival analysis and Dunn’s test for tumor-volume analysis. ***P < 0.001, **P < 0.01, *P < 0.05, representative of two experiments (n = 6). i.p., intraperitoneal; n.s., not significant; s.c., subcutaneous.
Fig. 7.
Fig. 7.
Tumor regression upon i.t. injection with MCMV MHC-I–restricted epitopes conferred by noninflationary epitopes. (A) Experimental design. Mice were treated six times with MCMV-derived peptides plus pI:C (50 μg). Group treatments were as follows: saline (n = 6 times), MHC-II (1 μg; n = 6 times), MHC-II admixed with MHC-I MCMV pool (IE3, m38, and m45, 1 μg each; n = 6 times) or individually (1 μg; n = 6 times). (B) Survival curves (X indicates treatment immune-related toxicity). (C) Tumor volume was monitored three times a week and is shown as mean tumor volume for each group and SE. (B and C) Statistical significance was assessed by Mantel–Cox test for survival analysis w and Dunn's test for tumor-volume analysis. P values are shown directly in the survival graph and next to the legend for the tumor growth analysis (****P < 0.0001, ***P < 0.001, n.s.: not significant), representative of a single experiment (n = 7). FACS, fluorescence-activated cell sorting; i.p., intraperitoneal; s.c., subcutaneous.
Fig. 8.
Fig. 8.
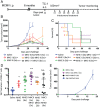
Intratumoral injection of MCMV-derived epitopes in poorly immunogenic B16-F10 melanoma delays tumor growth and induces in situ infiltration and broad immune activation. (A) Experimental design. MCMV-infected C57BL/6 mice were transplanted with B16-F10 tumors. Mice were treated six times with saline pI:C (50 μg) alone or admixed with MHC-I– (m45 alone; 1 μg; or a mixture of m38, m45, and IE3, 0.1 μg each) and MHC-II– (m139; 1 μg) restricted peptides. (B) Survival was monitored. (C) Tumor growth is shown as the mean of tumor volume for each group with SE. (DF) For the tumor microenvironment analysis, mice were treated twice, and samples were collected between 24 h and 36 h after the second i.t. injection. (D) Tumor-cell suspension was analyzed by fluorescence-activated cell sorting (FACS) to assess the presence of the indicated cells: m45-tetramer+CD3+CD8+ (m45-tetramer), CD3+CD8+ (CD8 T cells), CD3+CD4+ (CD4 T cells), CD3+CD4CD8 (nonconventional T cells), CD3NK1.1+ (NK), CD3+NK1.1+(NKT), CD19+ (B cells), CD11b+LyG+ (granulocytic cells), and CD11b+Ly6C+Ly6G (monocytic cells), and MHC-II+CD11c+ (dendritic cells). The pie charts represent the average proportion of each cell type in each treatment group. (E and F) Cytokine/chemokine production was measured using Legendplex cytokine release syndrome panel. (E) Tumor lysate (pg/50 μg total protein) and (F) plasma production (pg/mL plasma) of IFN-γ, CXCL-9, and CXCL-10. Data are shown as individual values and mean ± SEM (n = 4–8, two independent experiments). Statistical significance was assessed by one-way ANOVA followed by Tukey’s test for multiple comparison analysis. ****P < 0.0001, ***P < 0.001, **P < 0.01, *P < 0.05. i.d., intradermal; i.p., intraperitoneal; ns, not significant.

Similar articles

Cited by

References

    1. Hanahan D., Weinberg R. A., Hallmarks of cancer: The next generation. Cell 144, 646–674 (2011). - PubMed
    1. Alexandrov L. B., Nik-Zainal S., Siu H. C., Leung S. Y., Stratton M. R., A mutational signature in gastric cancer suggests therapeutic strategies. Nat. Commun. 6, 8683 (2015). - PMC - PubMed
    1. Ott P. A., et al. , An immunogenic personal neoantigen vaccine for patients with melanoma. Nature 547, 217–221 (2017). - PMC - PubMed
    1. Sahin U., et al. , Personalized RNA mutanome vaccines mobilize poly-specific therapeutic immunity against cancer. Nature 547, 222–226 (2017). - PubMed
    1. van Montfoort N., et al. , NKG2A blockade potentiates CD8 T cell immunity induced by cancer vaccines. Cell 175, 1744–1755.e15 (2018). - PMC - PubMed

MeSH terms