. 2022 Dec;29(12):2429-2444.
doi: 10.1038/s41418-022-01029-5. Epub 2022 Jun 23.

Aberrant activation of p53/p66Shc-mInsc axis increases asymmetric divisions and attenuates proliferation of aged mammary stem cells

Affiliations

Aberrant activation of p53/p66Shc-mInsc axis increases asymmetric divisions and attenuates proliferation of aged mammary stem cells

Chiara Priami et al. Cell Death Differ. 2022 Dec.

Abstract

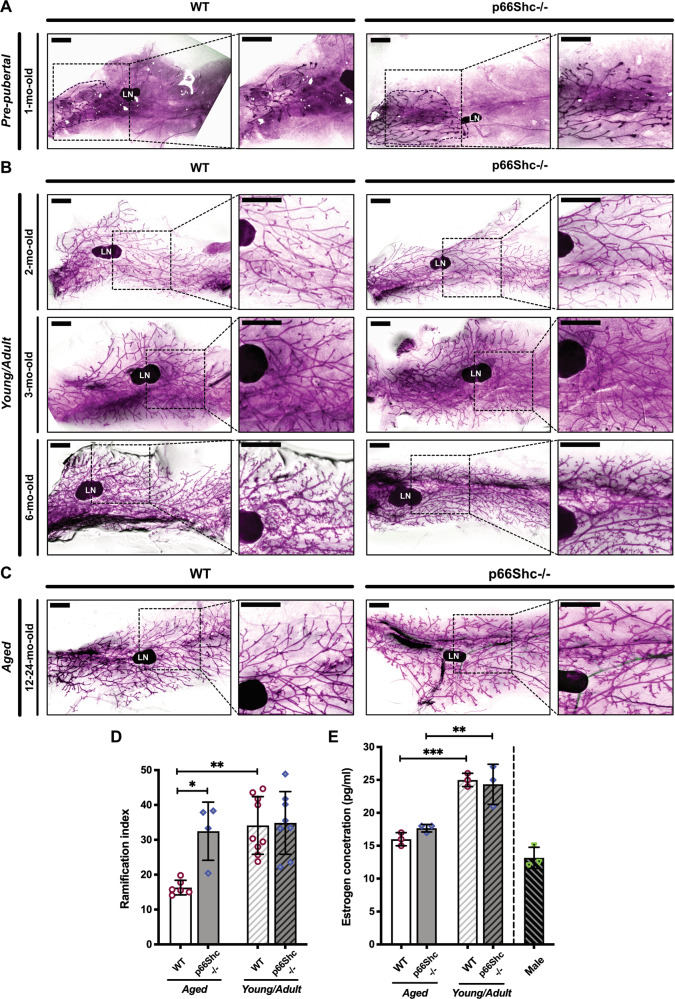
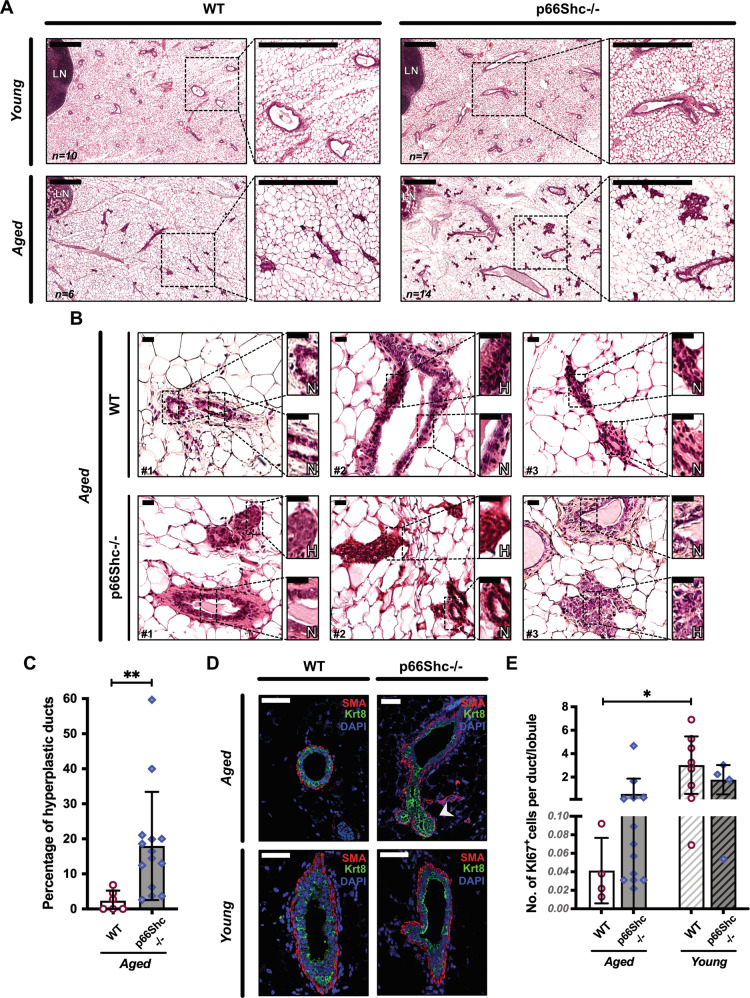
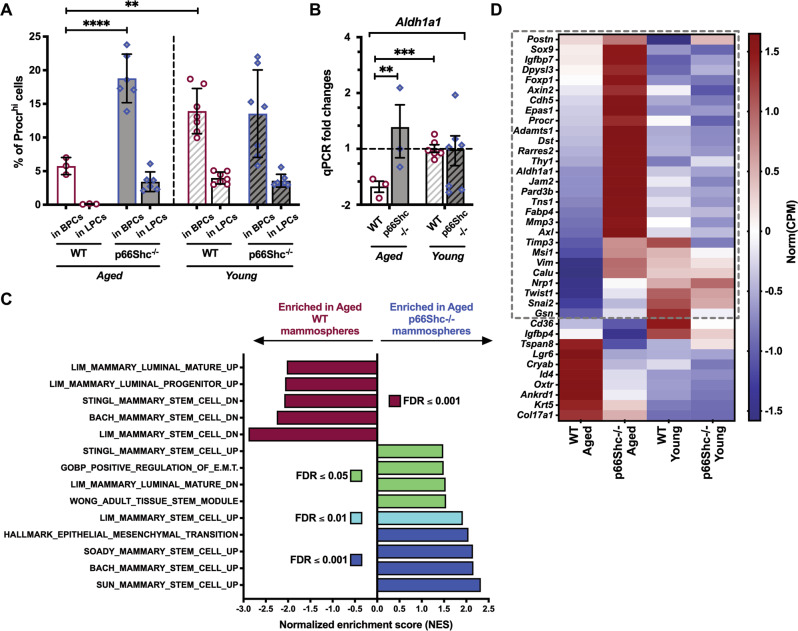
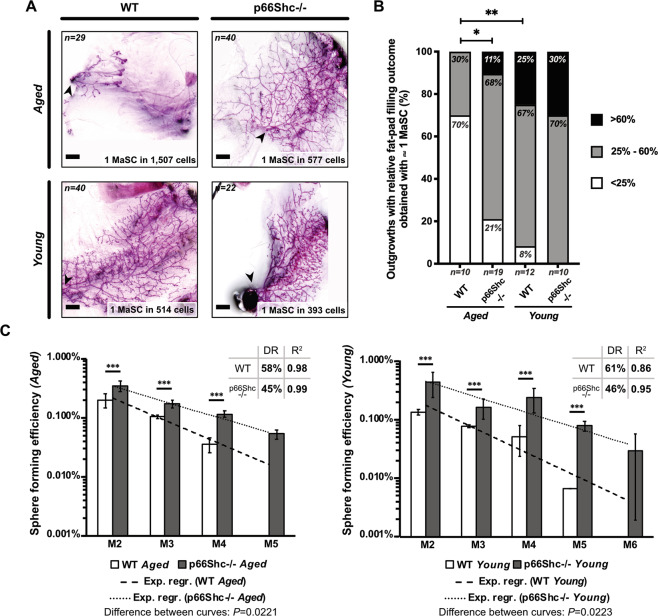
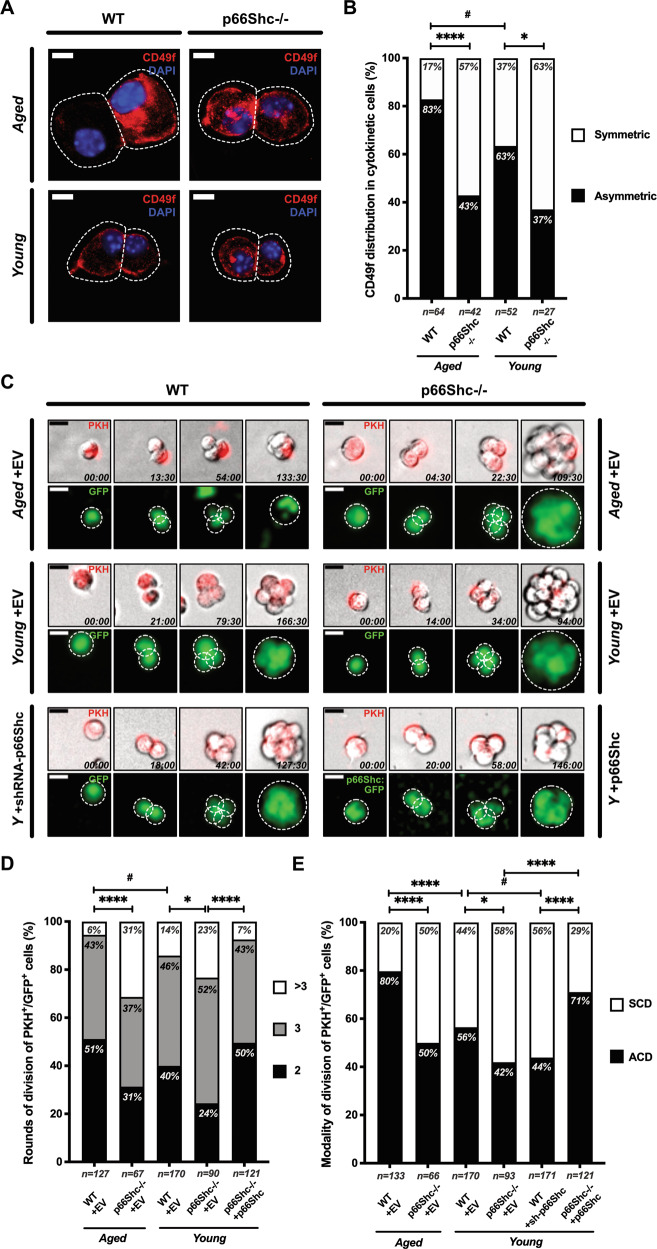
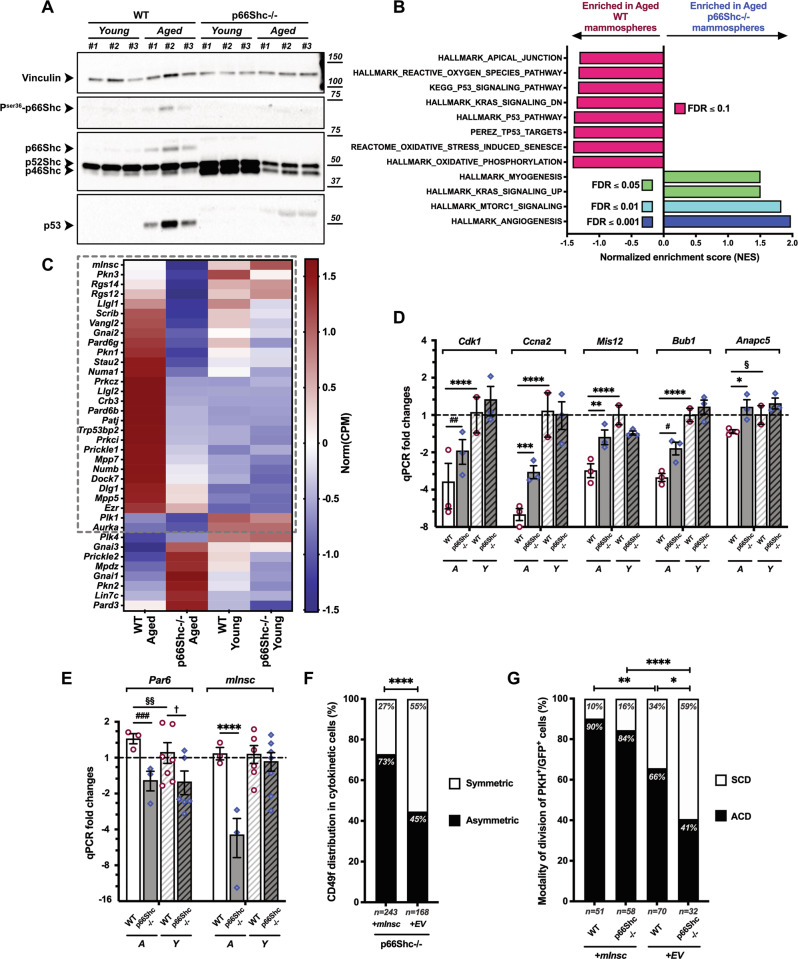
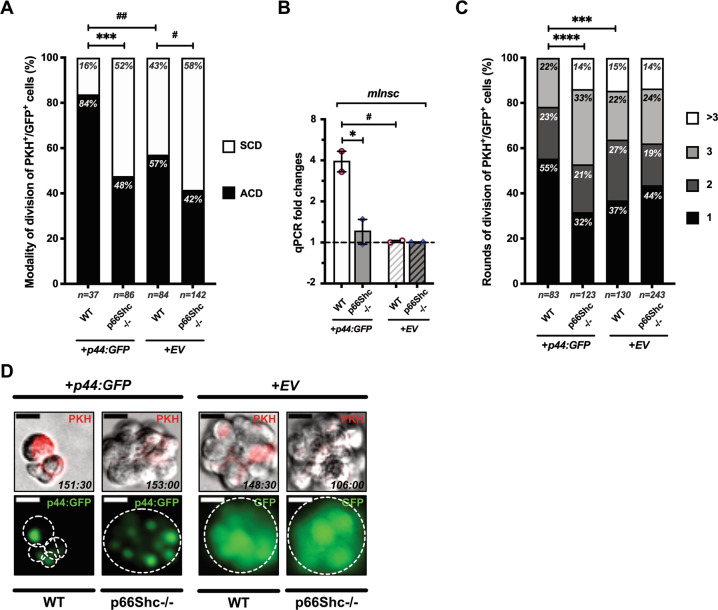
Aging is accompanied by the progressive decline in tissue regenerative capacity and functions of resident stem cells (SCs). Underlying mechanisms, however, remain unclear. Here we show that, during chronological aging, self-renewing mitoses of mammary SCs (MaSCs) are preferentially asymmetric and that their progeny divides less frequently, leading to decreased number of MaSCs and reduced regenerative potential. Underlying mechanisms are investigated in the p66Shc-/- mouse, which exhibits several features of delayed aging, including reduced involution of the mammary gland (MG). p66Shc is a mitochondrial redox sensor that activates a specific p53 transcriptional program, in which the aging-associated p44 isoform of p53 plays a pivotal role. We report here that aged p66Shc-/- MaSCs show increased symmetric divisions, increased proliferation and increased regenerative potential, to an extent reminiscent of young wild-type (WT) MaSCs. Mechanistically, we demonstrate that p66Shc, together with p53: (i) accumulates in the aged MG, (ii) sustains expression of the cell polarity determinant mInscuteable and, concomitantly, (iii) down-regulates critical cell cycle genes (e.g.,: Cdk1 and Cyclin A). Accordingly, overexpression of p53/p44 increases asymmetric divisions and decreases proliferation of young WT MaSCs in a p66Shc-dependent manner and overexpression of mInsc restores WT-like levels of asymmetric divisions in aged p66Shc-/- MaSCs. Notably, deletion of p66Shc has negligible effects in young MaSCs and MG development. These results demonstrate that MG aging is due to aberrant activation of p66Shc, which induces p53/p44 signaling, leading to failure of symmetric divisions, decreased proliferation and reduced regenerative potential of MaSCs.


Conflict of interest statement

The authors declare no competing interests.

Figures

Fig. 1
Fig. 1. Delayed age-related involution of mammary gland (MG) in p66Shc−/− mice.
A–C Carmine-stained whole-mounts of inguinal MGs from pre-pubertal (A), young/adult (B) and aged (C) WT or p66Shc−/− nulliparous mice, as indicated (see Materials and Methods for details). In each panel, the boxed area on the left is shown at higher magnification on the right. LN: lymph node. Scale bar = 1.5 mm. D Quantification of ductal branching in MGs from aged (12–24-mo-old) WT (n = 6) or p66Shc−/− (n = 4) mice and young/adult (2–6-mo-old) WT (n = 9) or p66Shc−/− (n = 8) mice. Data are represented as mean ± SD of ramification index (Sholl analysis; [63]) and analyzed by two-way ANOVA and Tukey post-hoc test; *: P = 0.016; **: P = 0.009. E Estrogen levels in aged (24-mo-old) and young/adult (3-mo-old) WT or p66Shc−/− nulliparous mice (n = 3 each, including control males), represented as mean ± SD of serum 17-β-estradiol concentrations analyzed by one-way ANOVA and Tukey post-hoc test; **: P = 0.006; ***: P = 0.0005.
Fig. 2
Fig. 2. Benign ductal hyperplasia and increased epithelial proliferation in aged p66Shc−/− mammary glands (MGs).
A H&E staining of inguinal MGs from young (2-mo-old) WT (n = 10) or p66Shc−/− (n = 7) and aged (24-mo-old) WT (n = 6) or p66Shc−/− (n = 14) mice. In each panel, the boxed area on the left is shown at higher magnification on the right. LN: lymph node. Scale bar = 0.5 mm. B H&E images showing areas of normal (N) or hyperplastic (H) epithelium. Scale bar = 20 µm. C Quantification of epithelial hyperplasia in aged WT or p66Shc−/− mice (same as in B), represented as mean ± SD of percentages of hyperplastic ducts and analyzed by two-tailed Mann–Whitney test; **: P = 0.003. D Confocal images of basal (SMA, red) and luminal (Krt8, green) markers in MGs from aged WT (n = 3) or p66Shc−/− (n = 5) and young WT or p66Shc−/− mice (n = 3 each). Nuclei are stained by DAPI (blue). Scale bar = 50 µm; arrow-head: accumulation of Krt8+-cells. E Quantification of epithelial proliferation, represented as mean ± SD of number of Ki67+cells per duct or lobule in MGs from aged WT (n = 4) or p66Shc−/− (n = 13) and young WT (n = 8) or p66Shc−/− (n = 4) mice (same MGs as in A, B and D). Data are analyzed by two-way ANOVA and Tukey post-hoc test; *: P = 0.031.
Fig. 3
Fig. 3. Increased expression of mammary stem cell (MaSC) markers in aged p66Shc−/− mammospheres.
A FACS-quantification of Procrhi cells among basal (BPCs) and luminal (LPCs) progenitors in M2-mammosphere independent preparations (n ≥ 3 each, as indicated) from aged and young, WT or p66Shc−/− mice. BPCs and LPCs are identified as CD24medCD49fhi and CD24hiCD49fmed, respectively. Data are represented as mean ± SD of Procrhi cell-percentages and analyzed by two-way ANOVA and Tukey post-hoc test; **: P = 0.005; ****: P < 0.0001. B Aldh1a1 mRNA levels in M2-mammosphere independent preparations (n ≥ 3 each) from aged and young, WT or p66Shc−/− mice. Data are represented in semi-logarithmic axis as mean ± SEM of qPCR fold-changes (FCs); 0 < FC < 1 are expressed as (−1/FC); “young WT” group is used as calibrator. Statistical analysis: multiple t-test performed on Table S3 (see Materials and Methods for further details); FDR = 5%; **: Q = 0.003; ***: Q = 0.0008. C Histogram representation of top-enriched, MaSC-related datasets obtained by Gene Set Enrichment Analysis [30] of aged p66Shc−/− (blue) vs aged WT (red) mammosphere RNA preparations (n = 3 each), analyzed by bulk RNA-sequencing. Raw expression levels were compared for enrichment in gene-sets listed in Dataset 1 (see Materials and Methods for further details); FDR: False Discovery Rate. D Heat-map representation of normalized expression levels of 38 MaSC-genes differentially expressed in aged p66Shc−/− vs aged WT mammosphere RNA preparations (n = 3 each), analyzed by bulk RNA-sequencing. Blue means low expression levels and red high expression levels. CPM: Counts Per Million mapped reads. The dashed gray box indicates genes upregulated in aged p66Shc−/− mammospheres (28 out of 38; see Dataset 2for details).
Fig. 4
Fig. 4. Increased mammary stem cell (MaSC) frequency and regenerative potential in aged p66Shc−/− mammospheres.
A Outgrowths obtained by limiting-dilution transplantation of M2-mammosphere cell suspensions. MaSC frequencies were calculated with ELDA [71] and indicated. Scale bar = 1 mm; arrow-head: injection site. B Frequencies of outgrowths obtained by transplantation of ∼1 MaSC (same experiment as in A), categorized according to the percentage of repopulated area (<25%, 25–60% and >60%) and analyzed by pairwise Chi-square test; *: P = 0.03; **: P = 0.008. C Representation in semi-logarithmic axis of sphere forming efficiency upon serial re-plating of mammary epithelial cells from aged (left) and young (right) WT or p66Shc−/− mice. Data are represented as mean ± SEM of three independent experiments. Statistical analysis: differences at each passage are calculated by two-way ANOVA and Tukey post-hoc test; ***: P < 0.001. Differences between fit-lines are calculated by simple linear regression after transformation of exponential curves into straight lines; P values are indicated. DR: decrease rate; R2: coefficient of determination.
Fig. 5
Fig. 5. Increased symmetric divisions and proliferation rate of p66Shc−/− aged mammary stem cells (MaSCs).
A CD49f distribution in cytokinetic cell-doublets from M2-mammospheres of aged and young, WT or p66Shc−/− mice (n ≥ 3 for each preparation). CD49f (red) is either asymmetrically or symmetrically distributed. Cells and cleavage sites are outlined. Nuclei are shown by DAPI (blue). Scale bar = 10 µm. B Frequencies of either asymmetrical (black) or symmetrical (white) CD49f distribution (same as in A). Numbers of scored doublets are indicated. Statistical analysis: pairwise Chi-square test with Yates’ correction. #: P = 0.031; *: P = 0.046; ****: P < 0.0001. C Time-lapse microscopy images of PKH+/GFP+ cells from M2-mammospheres infected with either empty- (+EV), or p66Shc-silencing- (+shRNA-p66Shc), or p66Shc:GFP-expressing- (+p66Shc) vectors. Early and late divisions are shown. Shooting-times are indicated as hours:minutes. Cells and spheroids are outlined. Scale bar = 20 µm. D Proliferation rates of PKH+GFP+ cells (same as in C), expressed as frequencies of rounds of division (2, 3 or >3) entered over 7 days. Numbers of scored cells are indicated. Statistical analysis: pairwise Chi-square test; #: P = 0.026; *: P = 0.024; ****: P < 0.0001. E Frequencies of either asymmetrical (ACD, black) or symmetrical (SCD, white) cell division (same experiment as in C). Numbers of scored cells are indicated. Statistical analysis: pairwise Chi-square test with Yates’ correction. *: P = 0.034; #: P = 0.026; ****: P < 0.0001.
Fig. 6
Fig. 6. Increased symmetric divisions of aged p66Shc−/− mammary stem cells (MaSCs) are due to impaired expression of mInsc and other cell polarity genes.
A Western blot on mammary epithelial cells from young and aged, WT or p66Shc−/− mice (n = 3 each). Vinculin is used as loading control. B Histogram representation of top-enriched, aging-related datasets obtained by Gene Set Enrichment Analysis [30] of aged p66Shc−/− (blue) vs aged WT (red) mammosphere RNA preparations (n = 3 each), analyzed by bulk RNA-sequencing. Raw expression levels were compared for enrichment in gene-sets listed in Dataset 1 (see Materials and Methods for further details); FDR: False Discovery Rate. C Heat-map representation of normalized expression levels of 36 cell polarity-genes differentially expressed in aged p66Shc−/− vs aged WT mammosphere RNA preparations (n = 3 each), analyzed by bulk RNA-sequencing. Blue means low expression levels and red high expression levels. CPM: Counts Per Million mapped reads. The dashed gray box indicates genes upregulated in aged p66Shc−/− vs aged WT mammospheres (28 out of 36; see Dataset 3for details). D, E mRNA levels of 5/30 p53/p66Shc mitotic signature-genes (D) and 2/6 cell polarity-genes (E) differentially regulated between young (Y) or aged (A), WT and p66Shc−/− M2-mammosphere independent preparations (n ≥ 3 for each group, see Table S3). Data are represented in semi-logarithmic axis as mean ± SEM of qPCR FCs; 0 < FC < 1 are expressed as (−1/FC); “young WT” group is used as calibrator. Statistical analysis: multiple t-test performed on Table S3 (see Materials and Methods for details); FDR = 5%; *: Q = 0.0347; #: Q = 0.0136; §: Q = 0.0393; : Q = 0.0234; **: Q = 0.0044; ##: Q = 0.0023; §§: Q = 0.0087; ***: Q = 0.0003; ###: Q = 0.0001; ****: Q < 0.000001. F, G Effects of mInsc expression on MaSC division. Mammospheres from aged p66Shc−/− (F) and from young WT or p66Shc−/− (G) mice (n ≥ 3 for each preparation) were infected at M1-passage with either empty- (+EV) or mInsc- (+mInsc) expressing vectors. PKH+GFP+-MaSCs were analyzed for frequencies of asymmetrical (black) vs symmetrical (white) CD49f distribution in cytokinetic cell-doublets (F), or asymmetrical (ACD, black) vs symmetrical (SCD, white) cell division by time-lapse microscopy (G). Numbers of scored cells are indicated. Statistical analysis: pairwise Chi-square test with Yates’ correction. *: P = 0.038; **: P = 0.004; ****: P < 0.0001.
Fig. 7
Fig. 7. Effects of p44 overexpression on mammary stem cell (MaSC) division.
A Mammospheres from young WT or p66Shc−/− mice (n ≥ 3 for each preparation) were infected at M1-passage with either empty- (+EV) or p44:GFP- (+p44:GFP) expressing vectors. PKH+GFP+-MaSCs were analyzed for frequencies of asymmetrical (ACD, black) vs symmetrical (SCD, white) cell division by time-lapse microscopy. Numbers of scored cells are indicated. Statistical analysis: pairwise Chi-square test with Yates’ correction. #: P = 0.033; ##: P = 0.009; ***: P = 0.0004. B mInsc mRNA levels in either p44:GFP-overexpressing- (+p44) or empty- (+EV) vector-infected WT or p66Shc−/− M2-mammospheres (n = 2 independent infection experiments). Data are represented as mean ± SEM of qPCR FCs; 0 < FC < 1 are expressed as (−1/FC); Statistical analysis: two-way ANOVA and Tukey post-hoc test; *: P = 0.019; #: P = 0.015. C Proliferation rate of PKH+GFP+-cells (same as in A), expressed as frequencies of rounds of division (1, 2, 3 or >3) entered over 7 days. Numbers of scored cells are indicated. Statistical analysis: pairwise Chi-square test; ***: P = 0.0009; ****: P < 0.0001. D Mammospheres obtained in the same experiment as in (A and C). PKH is shown in red. Spheroids are outlined. Shooting-times are indicated as hours:minutes. Note p44:GFP nuclear localization.

Similar articles

Cited by

References

    1. Jones DL, Rando TA. Emerging models and paradigms for stem cell ageing. Nat Cell Biol. 2011;13:506–12.. doi: 10.1038/ncb0511-506. - DOI - PMC - PubMed
    1. Lugert S, Basak O, Knuckles P, Haussler U, Fabel K, Gotz M, et al. Quiescent and active hippocampal neural stem cells with distinct morphologies respond selectively to physiological and pathological stimuli and aging. Cell Stem Cell. 2010;6:445–56. doi: 10.1016/j.stem.2010.03.017. - DOI - PubMed
    1. Hwang AB, Brack AS. Muscle Stem Cells and Aging. Curr Top Dev Biol. 2018;126:299–322. doi: 10.1016/bs.ctdb.2017.08.008. - DOI - PubMed
    1. Gross KM, Zhou W, Breindel JL, Ouyang J, Jin DX, Sokol ES, et al. Loss of Slug Compromises DNA Damage Repair and Accelerates Stem Cell Aging in Mammary Epithelium. Cell Rep. 2019;28:394–407.e6. doi: 10.1016/j.celrep.2019.06.043. - DOI - PubMed
    1. Molofsky AV, Slutsky SG, Joseph NM, He S, Pardal R, Krishnamurthy J, et al. Increasing p16INK4a expression decreases forebrain progenitors and neurogenesis during ageing. Nature. 2006;443:448–52.. doi: 10.1038/nature05091. - DOI - PMC - PubMed

Publication types

MeSH terms

Substances