. 2022 Jun;130(6):67007.
doi: 10.1289/EHP10393. Epub 2022 Jun 22.

Exposure to Per- and Polyfluoroalkyl Substances and Mortality in U.S. Adults: A Population-Based Cohort Study

Affiliations

Exposure to Per- and Polyfluoroalkyl Substances and Mortality in U.S. Adults: A Population-Based Cohort Study

Xue Wen et al. Environ Health Perspect. 2022 Jun.

Abstract

Background: Per- and polyfluoroalkyl substances (PFAS) are widespread environmental contaminants associated with diseases such as cancer and dyslipidemia. However, few studies have investigated the association between PFAS mixture exposure and mortality in general populations.

Objectives: This study aimed to explore the association between PFAS mixture, perfluorooctanoic acid (PFOA), and perfluorooctane sulfonic acid (PFOS) and mortality in U.S. adults by a nationally representative cohort.
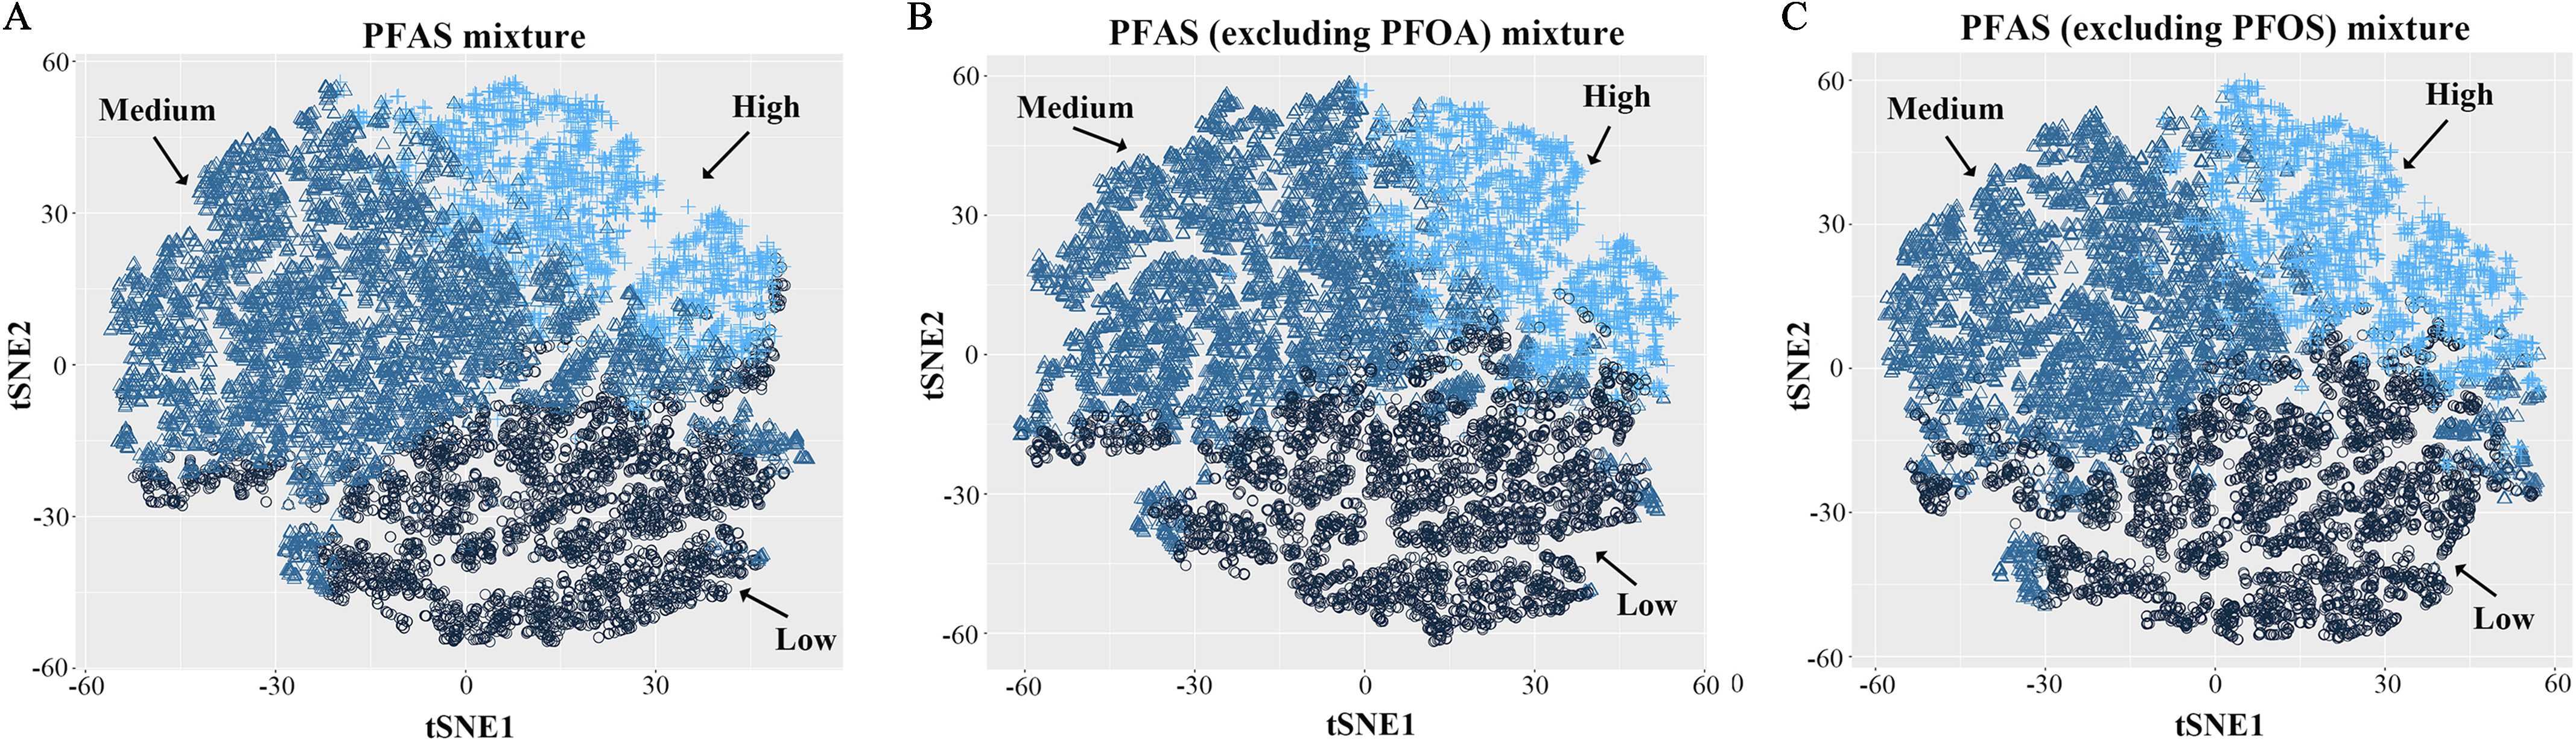
Methods: Adults 18 years of age who were enrolled in the National Health and Nutrition Examination Survey (NHANES) (1999-2014) were included in our study. Baseline serum concentrations of seven PFAS were measured and individuals were followed up to 31 December 2015. Hazard ratios (HRs) and confidence intervals (CIs) were estimated using Cox proportional hazards models. Association between PFAS mixture exposure and mortality was analyzed using the k-means method by clustering PFAS mixtures into subgroups. Association between PFOA/PFOS exposure and mortality was subsequently analyzed in both continuous and categorical models.

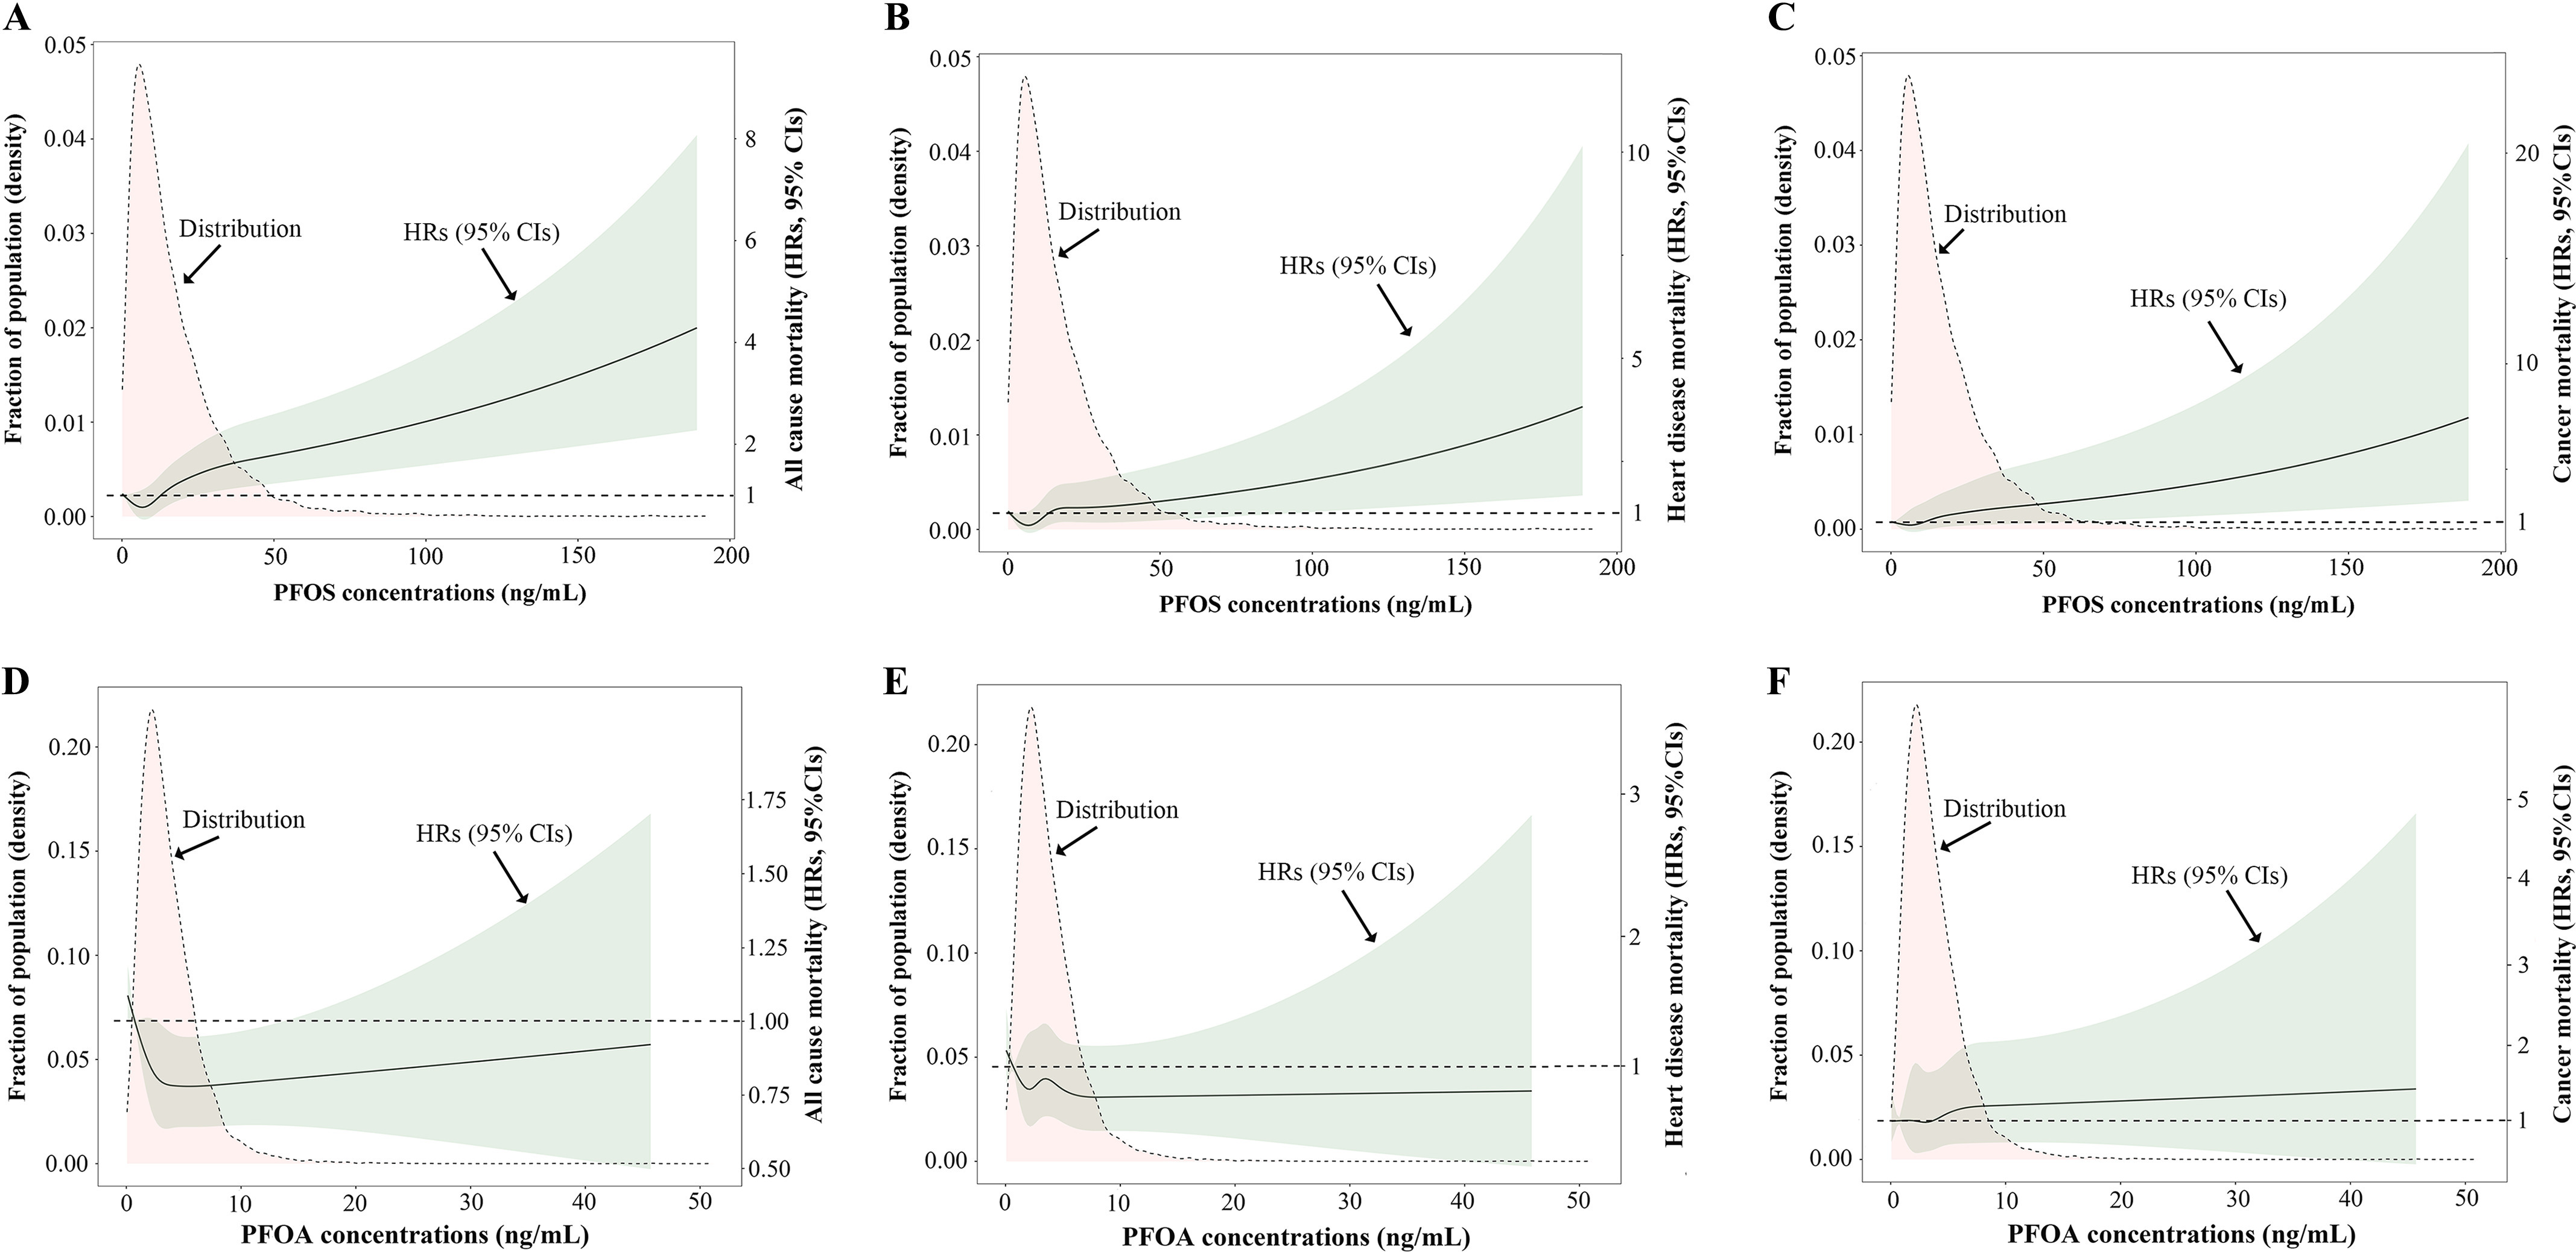
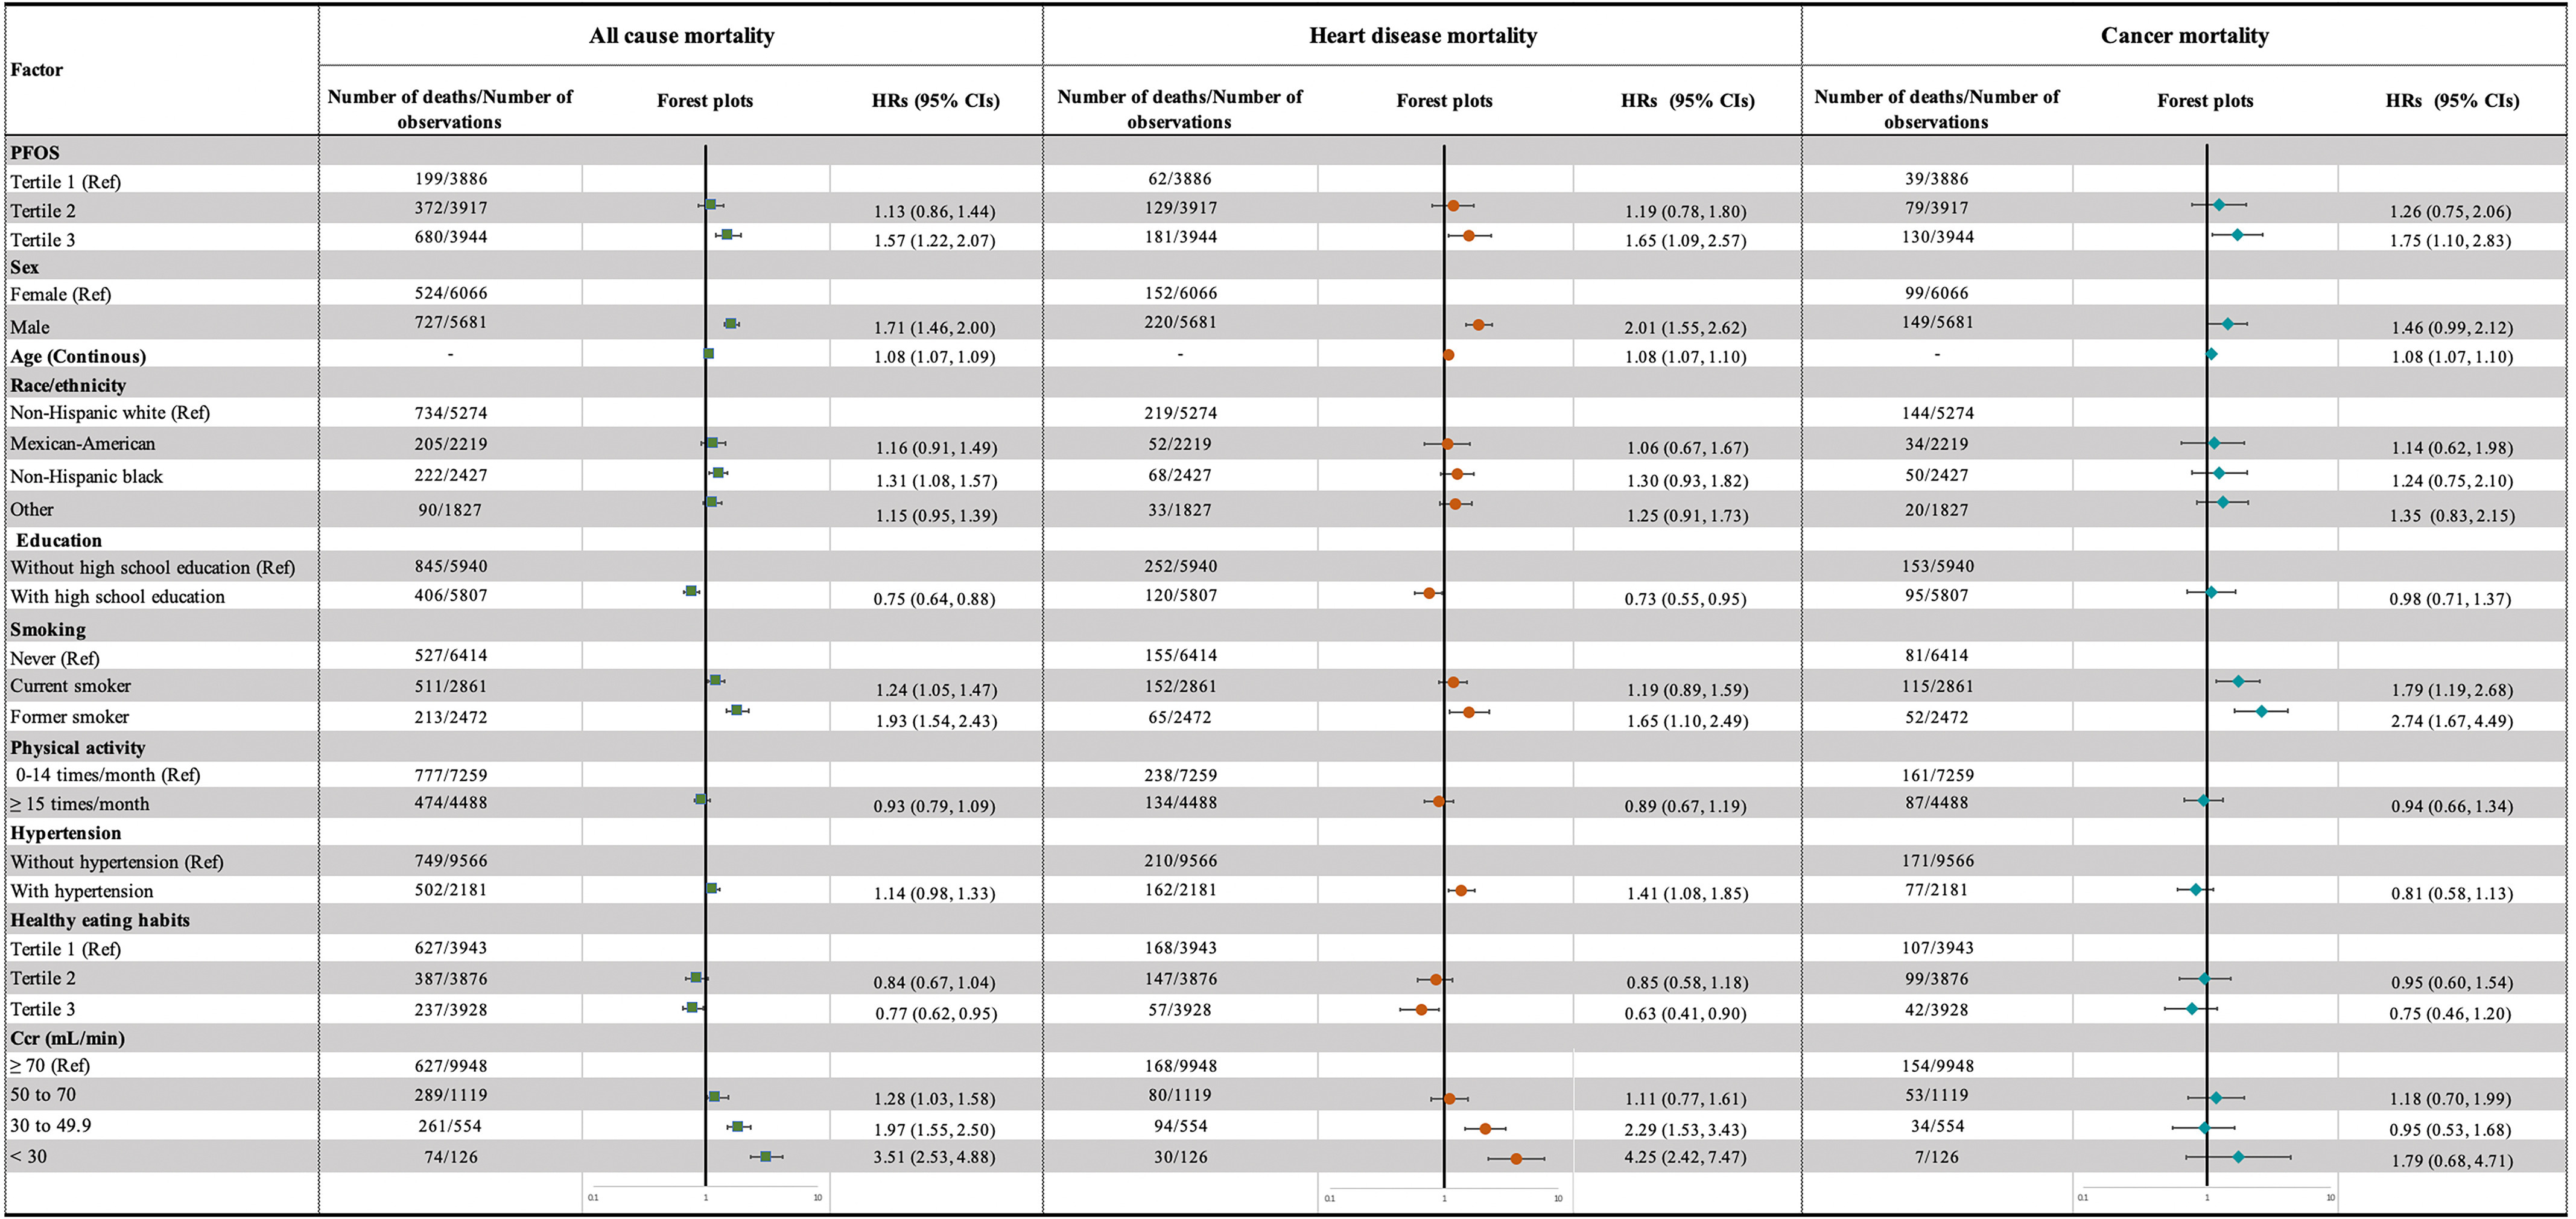
Results: During the follow-up period, 1,251 participants died. In the mixture analysis, the k-means algorithm clustered participants into low-, medium-, and high-exposure groups. Compared with the low-exposure group, participants in the high-exposure group showed significantly higher risks for all-cause mortality (HR=1.38; 95% CI: 1.07, 1.80), heart disease mortality (HR=1.58; 95% CI: 1.05, 2.51), and cancer mortality (HR=1.70; 95% CI: 1.08, 2.84). In single PFAS analysis, PFOS was found to be positively associated with all-cause mortality (third vs. first tertile HR=1.57; 95% CI: 1.22, 2.07), heart disease mortality (third vs. first tertile HR=1.65; 95% CI: 1.09, 2.57), and cancer mortality (third vs. first tertile HR=1.75; 95% CI: 1.10, 2.83), whereas PFOA exposure had no significant association with mortality. Assuming the observed association is causal, the number of deaths associated with PFOS exposure (17.1 vs. <7.9 ng/mL) was 382,000 (95% CI: 176,000, 588,000) annually between 1999 and 2015, and it decreased to 69,000 (95% CI: 28,000, 119,000) annually between 2015 and 2018. The association between PFOS and mortality was stronger among women and people without diabetes.

Discussion: We observed a positive association between PFAS mixture exposure and mortality among U.S. adults. Limitations of this study include the potential for unmeasured confounding, selection bias, a relatively small number of deaths, and only measuring PFAS at one point in time. Further studies with serial measures of PFAS concentrations and longer follow-ups are necessary to elucidate the association between PFAS and mortality from specific causes. https://doi.org/10.1289/EHP10393.


Figures

Figures 1 depicts the Pearson correlation analysis with seven columns, namely, 2-(N-methyl-perfluorooctane sulfonamido) acetic acid, perfluorodecanoic acid, perfluorohexane sulfonate acid, perfluorononanoic acid, perfluorooctanoic acid, perfluorooctane sulfonic acid, and perfluoroundecanoic acid, and seven rows, namely, 2-(N-methyl-perfluorooctane sulfonamido) acetic acid, perfluorodecanoic acid, perfluorohexane sulfonate acid, perfluorononanoic acid, perfluorooctanoic acid, perfluorooctane sulfonic acid, and perfluoroundecanoic acid. A color scale is ranging from negative 1 to 1 in increments of 0.2.
Figure 1.
Pearson correlation analysis on serum concentrations of seven PFAS in NHANES participants (1999–2014, n=11,747). The most significant correlation was observed between serum concentrations of PFUA and PFDE (correlation=0.830). Serum concentrations of other PFAS showed weak-to-moderate correlations (0.02<correlation0.50). Samples with serum PFAS concentrations below the LOQ were substituted with the value of the LOQ divided by the square root of 2. Note: LOQ, limit of quantification; MPAH, 2-(N-methyl-perfluorooctane sulfonamido) acetic acid; NHANES, National Health and Nutrition Examination Survey; PFAS, per- and polyfluoroalkyl substances; PFDE, perfluorodecanoic acid; PFHS, perfluorohexane sulfonate acid; PFNA, perfluorononanoic acid; PFOA, perfluorooctanoic acid; PFOS, perfluorooctane sulfonic acid; PFUA, perfluoroundecanoic acid.
Figures 2A to 2C are graphs titled per- and polyfluoroalkyl substances mixture, per- and polyfluoroalkyl substances (excluding perfluorooctanoic acid) mixture, and polyfluoroalkyl substances (excluding perfluorooctane sulfonic acid) mixture, plotting t-Distributed Stochastic Neighbor Embedding 2, ranging from negative 60 to 60 in increments of 30 (y-axis) across t-Distributed Stochastic Neighbor Embedding 1, ranging from negative 60 to 60 in increments of 30 (x-axis) for low, medium, and high, respectively.
Figure 2.
t-SNE visualization of k-means clustering of NHANES participants (1999–2014, n=11,747) based on serum concentrations of PFAS. Three subgroups (low-, medium-, and high-exposure groups) were obtained based on the mixture of (A) total PFAS, (B) PFAS excluding PFOA, and (C) PFAS excluding PFOS. Samples with serum PFAS concentrations below the LOQ were substituted with the value of the LOQ divided by the square root of 2. Note: LOQ, limit of quantification; NHANES, National Health and Nutrition Examination Survey; PFAS, per- and polyfluoroalkyl substances; PFOA, perfluorooctanoic acid; PFOS, perfluorooctane sulfonic acid; t-SNE, t-Distributed Stochastic Neighbor Embedding.
Figures 3A to 3F are area graphs, plotting Fraction of population (density), ranging from 0.00 to 0.05 in increments of 0.01; 0.00 to 0.05 in increments of 0.01; 0.00 to 0.05 in increments of 0.01; 0.00 to 0.20 in increments of 0.05; 0.00 to 0.20 in increments of 0.05; and 0.00 to 0.20 in increments of 0.05 (left y-axis) and All cause mortality ranging from 1 to 2 in unit increments and 2 to 8 in increments of 2; Heart disease mortality ranging from 1 to 10 in increments of 5; Cancer mortality ranging from 1 to 20 in increments of 1; All cause mortality ranging from 0.50 to 1.75 in increments of 0.25; Heart disease mortality ranging from 1 to 3 in unit increments; and Cancer mortality ranging from 1 to 5 in unit increments (right y-axis) across perfluorooctane sulfonic acid concentration (nanograms per milliliter), ranging from 0 to 200 in increments of 50; perfluorooctane sulfonic acid concentration (nanograms per milliliter), ranging from 0 to 200 in increments of 50; perfluorooctane sulfonic acid concentration (nanograms per milliliter), ranging from 0 to 200 in increments of 50; perfluorooctanoic acid concentration (nanograms per milliliter), ranging from 0 to 50 in increments of 10; perfluorooctanoic acid concentration (nanograms per milliliter), ranging from 0 to 50 in increments of 10; and perfluorooctanoic acid concentration (nanograms per milliliter), ranging from 0 to 50 in increments of 10 (x-axis) for distribution and hazard ratios (95 percent confidence intervals).
Figure 3.
Distributions of serum PFOA/PFOS concentrations and dose-response curves of serum PFOA/PFOS concentrations and mortality in the NHANES follow-up study from 1999–2014 to 31 December 2015 (n=11,747). Distributions of serum PFOS concentrations and adjusted HRs with 95% CIs for (A) all-cause mortality, (B) heart disease mortality, and (C) cancer mortality. Distributions of serum PFOA concentrations and adjusted HRs with 95% CIs for (D) all-cause mortality, (E) heart disease mortality, and (F) cancer mortality. HRs were estimated using Cox proportional hazards models and were weight adjusted using NHANES-specified sampling weights. HRs for PFOS exposure were further adjusted for PFAS excluding PFOS (categorized into three groups based on k-means algorithm), sex, age, race/ethnicity, education, smoking status, physical activity, hypertension, healthy eating index, Ccr, serum total cholesterol, and serum cotinine. HRs for PFOA exposure were further adjusted for PFAS excluding PFOA (categorized into three groups based on k-means algorithm), sex, age, race/ethnicity, smoking status, alcohol intake, physical activities, hypertension, diabetes, healthy eating index, Ccr, serum total cholesterol, and serum cotinine. Missing data on covariates were processed using multiple imputation algorithm. Samples with test values below the LOQ were substituted with the value of the LOQ divided by the square root of 2. Note: Ccr, creatinine clearance rate; CI, confidence interval; HR, hazard ratio; LOQ, limit of quantification; NHANES, National Health and Nutrition Examination Survey; PFAS, per- and polyfluoroalkyl substances; PFOA, perfluorooctanoic acid; PFOS, perfluorooctane sulfonic acid.
Figure 4 is a set of three forest plots titled All-cause mortality, heart disease mortality, and cancer mortality, plotting factor (bottom to top), including creatinine clearance rate (milliliters per minute): less than 30, 30 to 49.9, 50 to 70, greater than or equal to 70 (reference); Healthy eating habits: Tertile 3, Tertile 2, and Tertile 1 (reference); Hypertension: with hypertension and without hypertension (reference); Physical activity: greater than or equal to 15 times per month and 0 to 14 times per month (reference); Smoking: Former smoker, current smoker, and never (reference); Education: with high school education, without high school education (reference); Race or Ethnicity: Other, non-Hispanic Black, Mexican American, non-Hispanic White (reference); Age; Sex: Male and Female (reference); and Perfluorooctane sulfonic acid: Tertile 3, Tertile 2, Tertile 1 (reference) (y-axis) across Adjusted Hazard ratios with 95 percent Confidence intervals, ranging from 0.1 to 1 in increments of 0.9 and 1 to 10 in increments of 9 (x-axis) for number of deaths per number of observations, respectively.
Figure 4.
Adjusted HRs with 95% CIs for all-cause, heart disease, and cancer mortality in the NHANES follow-up study from 1999–2014 to 31 December 2015 (n=11,747). Adjusted HRs are shown as green squares, orange dots, and cyan diamonds and 95% CIs as horizontal lines for all-cause, heart disease, and cancer mortality, respectively. Age variables were treated as continuous values. HRs were estimated using Cox proportional hazards models and were weight adjusted using NHANES-specified sampling weights. Other adjusted variables include PFAS excluding PFOS (categorized into three groups based on k-means algorithm), sex, age, race/ethnicity, high school education, smoking status, hypertension, healthy eating index, serum total cholesterol, and serum cotinine. Missing data on covariates were processed using multiple imputation algorithm. Samples with test values below the LOQ were substituted with the value of the LOQ divided by the square root of 2. Note: CI, confidence interval; Ccr, creatinine clearance rate; HR, hazard ratio; LOQ, limit of quantification; NHANES, National Health and Nutrition Examination Survey; PFAS, per- and polyfluoroalkyl substances; PFOS, perfluorooctane sulfonic acid; Ref, reference.

Similar articles

Cited by

References

    1. Pelch KE, Reade A, Wolffe TAM, Kwiatkowski CF. 2019. PFAS health effects database: protocol for a systematic evidence map. Environ Int 130:104851, PMID: , 10.1016/j.envint.2019.05.045. - DOI - PubMed
    1. Fenton SE, Ducatman A, Boobis A, DeWitt JC, Lau C, Ng C, et al. . 2021. Per- and polyfluoroalkyl substance toxicity and human health review: current state of knowledge and strategies for informing future research. Environ Toxicol Chem 40(3):606–630, PMID: , 10.1002/etc.4890. - DOI - PMC - PubMed
    1. Steenland K, Winquist A. 2021. PFAS and cancer, a scoping review of the epidemiologic evidence. Environ Res 194:110690, PMID: , 10.1016/j.envres.2020.110690. - DOI - PMC - PubMed
    1. Averina M, Brox J, Huber S, Furberg AS. 2021. Exposure to perfluoroalkyl substances (PFAS) and dyslipidemia, hypertension and obesity in adolescents. The Fit Futures study. Environ Res 195:110740, PMID: , 10.1016/j.envres.2021.110740. - DOI - PubMed
    1. Ding N, Harlow SD, Randolph JF Jr, Loch-Caruso R, Park SK. 2020. Perfluoroalkyl and polyfluoroalkyl substances (PFAS) and their effects on the ovary. Hum Reprod Update 26(5):724–752, PMID: , 10.1093/humupd/dmaa018. - DOI - PMC - PubMed