

Affinity of disordered protein complexes is modulated by entropy-energy reinforcement
- PMID: 35727975
- PMCID: PMC9245678
- DOI: 10.1073/pnas.2120456119
Affinity of disordered protein complexes is modulated by entropy-energy reinforcement
Abstract
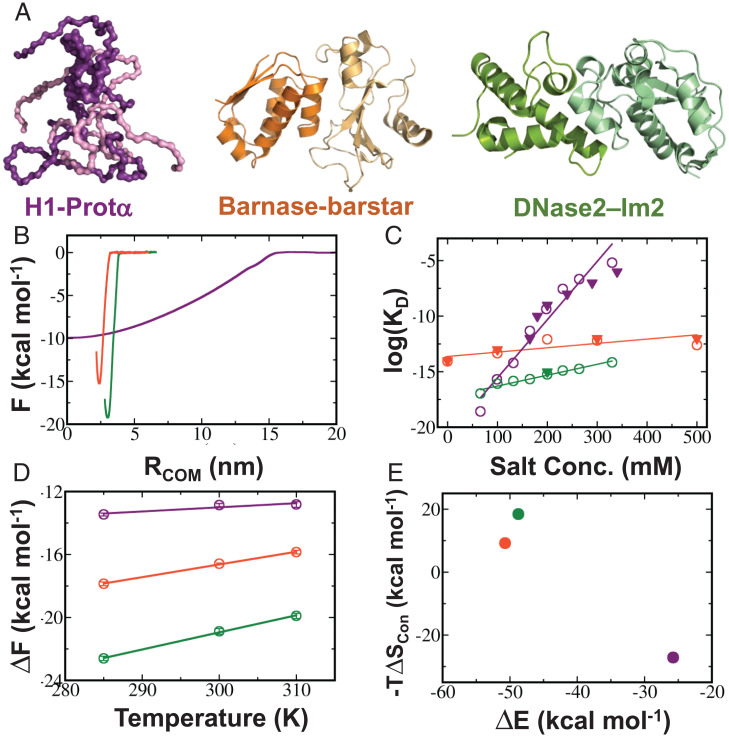
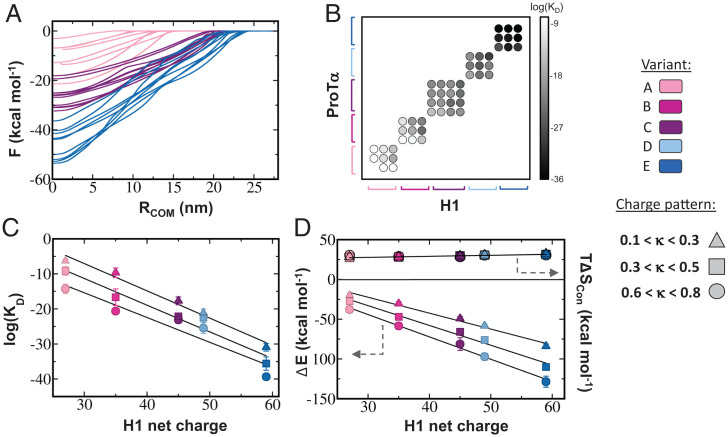
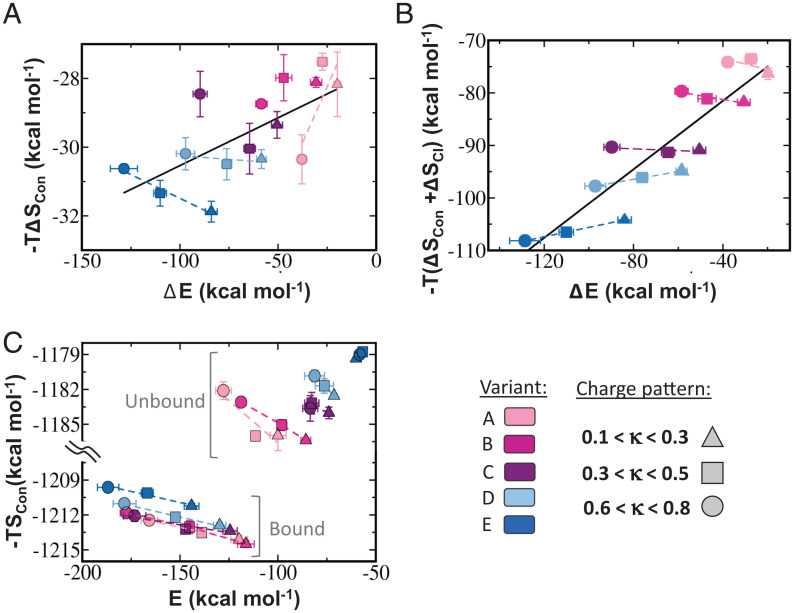
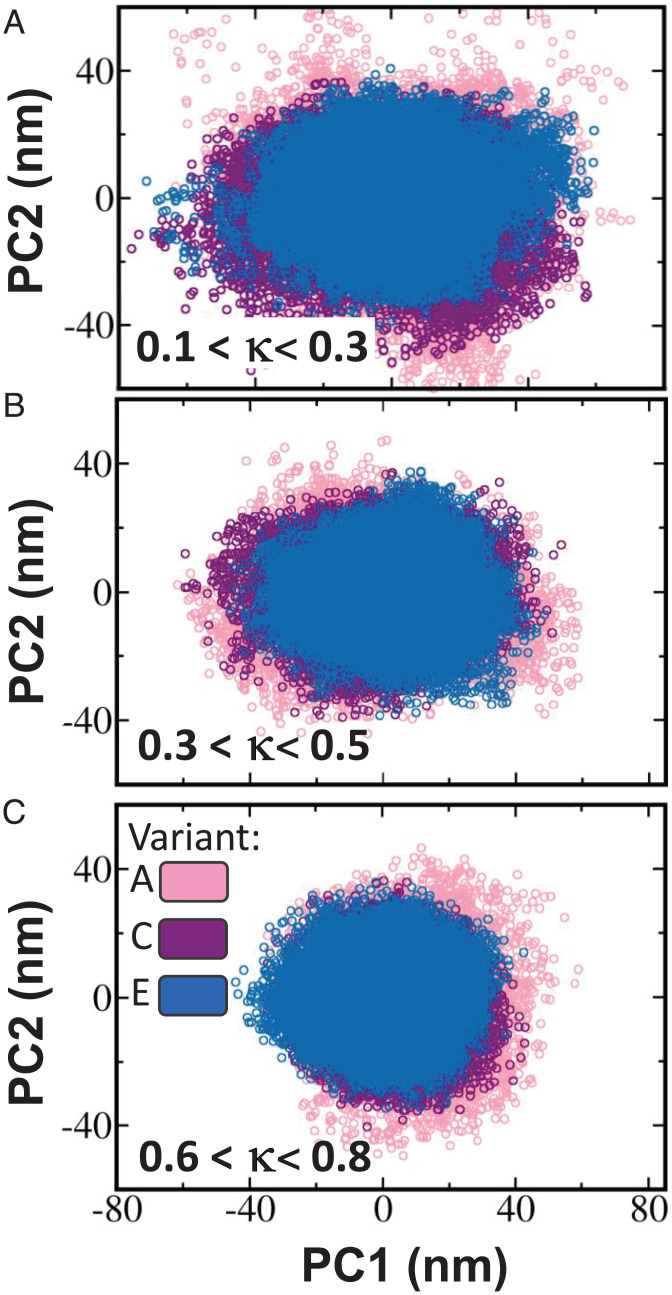
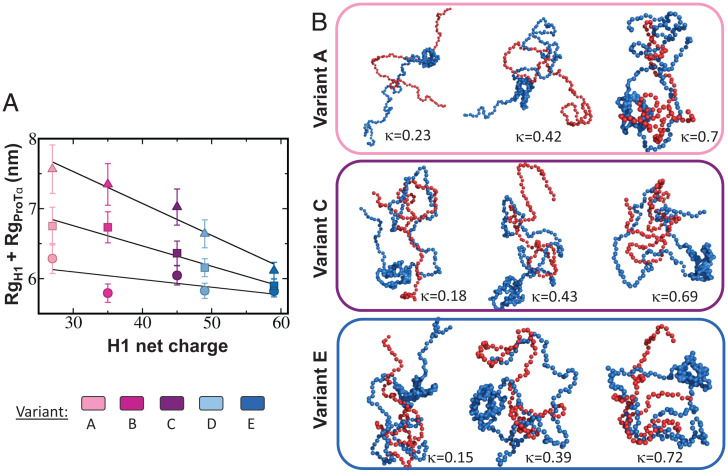
The association between two intrinsically disordered proteins (IDPs) may produce a fuzzy complex characterized by a high binding affinity, similar to that found in the ultrastable complexes formed between two well-structured proteins. Here, using coarse-grained simulations, we quantified the biophysical forces driving the formation of such fuzzy complexes. We found that the high-affinity complex formed between the highly and oppositely charged H1 and ProTα proteins is sensitive to electrostatic interactions. We investigated 52 variants of the complex by swapping charges between the two oppositely charged proteins to produce sequences whose negatively or positively charged residue content was more homogeneous or heterogenous (i.e., polyelectrolytic or polyampholytic, having higher or lower absolute net charges, respectively) than the wild type. We also changed the distributions of oppositely charged residues within each participating sequence to produce variants in which the charges were segregated or well mixed. Both types of changes significantly affect binding affinity in fuzzy complexes, which is governed by both enthalpy and entropy. The formation of H1-ProTa is supported by an increase in configurational entropy and by entropy due to counterion release. The latter can be twice as large as the former, illustrating the dominance of counterion entropy in modulating the binding thermodynamics. Complexes formed between proteins with greater absolute net charges are more stable, both enthalpically and entropically, indicating that enthalpy and entropy have a mutually reinforcing effect. The sensitivity of the thermodynamics of the complex to net charge and the charge pattern within each of the binding constituents may provide a means to achieve binding specificity between IDPs.
Keywords: counterion entropy; high-affinity binding; intrinsically disordered proteins; polyelectrolytes; protein association.
Conflict of interest statement
The authors declare no competing interest.
Figures
Comment in
-
Electrostatics tunes protein interactions to context.Proc Natl Acad Sci U S A. 2022 Aug 2;119(31):e2209201119. doi: 10.1073/pnas.2209201119. Epub 2022 Jul 15. Proc Natl Acad Sci U S A. 2022. PMID: 35858387 Free PMC article. No abstract available.
Similar articles
-
Driving forces of the complex formation between highly charged disordered proteins.Proc Natl Acad Sci U S A. 2023 Oct 10;120(41):e2304036120. doi: 10.1073/pnas.2304036120. Epub 2023 Oct 5. Proc Natl Acad Sci U S A. 2023. PMID: 37796987 Free PMC article.
-
Analytical Theory for Sequence-Specific Binary Fuzzy Complexes of Charged Intrinsically Disordered Proteins.J Phys Chem B. 2020 Aug 6;124(31):6709-6720. doi: 10.1021/acs.jpcb.0c04575. Epub 2020 Jul 27. J Phys Chem B. 2020. PMID: 32639157
-
Electrostatically accelerated encounter and folding for facile recognition of intrinsically disordered proteins.PLoS Comput Biol. 2013;9(11):e1003363. doi: 10.1371/journal.pcbi.1003363. Epub 2013 Nov 21. PLoS Comput Biol. 2013. PMID: 24278008 Free PMC article.
-
Binding without folding - the biomolecular function of disordered polyelectrolyte complexes.Curr Opin Struct Biol. 2020 Feb;60:66-76. doi: 10.1016/j.sbi.2019.12.006. Epub 2019 Dec 23. Curr Opin Struct Biol. 2020. PMID: 31874413 Review.
-
Conformational entropy in molecular recognition of intrinsically disordered proteins.Curr Opin Struct Biol. 2023 Dec;83:102697. doi: 10.1016/j.sbi.2023.102697. Epub 2023 Sep 14. Curr Opin Struct Biol. 2023. PMID: 37716093 Review.
Cited by
-
Driving forces of the complex formation between highly charged disordered proteins.Proc Natl Acad Sci U S A. 2023 Oct 10;120(41):e2304036120. doi: 10.1073/pnas.2304036120. Epub 2023 Oct 5. Proc Natl Acad Sci U S A. 2023. PMID: 37796987 Free PMC article.
-
The influence of tag sequence on recombinant humanized collagen (rhCol) and the evaluation of rhCol on Schwann cell behaviors.Regen Biomater. 2023 Oct 16;10:rbad089. doi: 10.1093/rb/rbad089. eCollection 2023. Regen Biomater. 2023. PMID: 38020236 Free PMC article.
-
Electrostatics tunes protein interactions to context.Proc Natl Acad Sci U S A. 2022 Aug 2;119(31):e2209201119. doi: 10.1073/pnas.2209201119. Epub 2022 Jul 15. Proc Natl Acad Sci U S A. 2022. PMID: 35858387 Free PMC article. No abstract available.
-
Active learning of the thermodynamics-dynamics trade-off in protein condensates.Sci Adv. 2024 Jan 5;10(1):eadj2448. doi: 10.1126/sciadv.adj2448. Epub 2024 Jan 5. Sci Adv. 2024. PMID: 38181073 Free PMC article.
-
Cross-Talk of Cation-π Interactions with Electrostatic and Aromatic Interactions: A Salt-Dependent Trade-off in Biomolecular Condensates.J Phys Chem Lett. 2023 Sep 28;14(38):8460-8469. doi: 10.1021/acs.jpclett.3c01642. Epub 2023 Sep 18. J Phys Chem Lett. 2023. PMID: 37721444 Free PMC article.
References
-
- Wojdyla J. A., Fleishman S. J., Baker D., Kleanthous C., Structure of the ultra-high-affinity colicin E2 DNase–Im2 complex. J. Mol. Biol. 417, 79–94 (2012). - PubMed
-
- Keeble A. H., Kleanthous C., The kinetic basis for dual recognition in colicin endonuclease-immunity protein complexes. J. Mol. Biol. 352, 656–671 (2005). - PubMed
-
- Wallis R., et al. , Protein-protein interactions in colicin E9 DNase-immunity protein complexes. 2. Cognate and noncognate interactions that span the millimolar to femtomolar affinity range. Biochemistry 34, 13751–13759 (1995). - PubMed
-
- Keeble A. H., Kirkpatrick N., Shimizu S., Kleanthous C., Calorimetric dissection of colicin DNase–immunity protein complex specificity. Biochemistry 45, 3243–3254 (2006). - PubMed
MeSH terms
Substances
LinkOut - more resources
Full Text Sources
