. 2022 Aug 8;7(15):e160989.
doi: 10.1172/jci.insight.160989.

Markers of fungal translocation are elevated during post-acute sequelae of SARS-CoV-2 and induce NF-κB signaling

Affiliations

Markers of fungal translocation are elevated during post-acute sequelae of SARS-CoV-2 and induce NF-κB signaling

Leila B Giron et al. JCI Insight. .

Erratum in

  • Markers of fungal translocation are elevated during post-acute sequelae of SARS-CoV-2 and induce NF-κB signaling.
    Giron LB, Peluso MJ, Ding J, Kenny G, Zilberstein NF, Koshy J, Hong KY, Rasmussen H, Miller GE, Bishehsari F, Balk RA, Moy JN, Hoh R, Lu S, Goldman AR, Tang HY, Yee BC, Chenna A, Winslow JW, Petropoulos CJ, Kelly JD, Wasse H, Martin JN, Liu Q, Keshavarzian A, Landay A, Deeks SG, Henrich TJ, Abdel-Mohsen M. Giron LB, et al. JCI Insight. 2022 Sep 22;7(18):e164813. doi: 10.1172/jci.insight.164813. JCI Insight. 2022. PMID: 36134654 Free PMC article. No abstract available.

Abstract

Long COVID, a type of post-acute sequelae of SARS-CoV-2 (PASC), has been associated with sustained elevated levels of immune activation and inflammation. However, the mechanisms that drive this inflammation remain unknown. Inflammation during acute coronavirus disease 2019 could be exacerbated by microbial translocation (from the gut and/or lung) to blood. Whether microbial translocation contributes to inflammation during PASC is unknown. We did not observe a significant elevation in plasma markers of bacterial translocation during PASC. However, we observed higher levels of fungal translocation - measured as β-glucan, a fungal cell wall polysaccharide - in the plasma of individuals experiencing PASC compared with those without PASC or SARS-CoV-2-negative controls. The higher β-glucan correlated with higher inflammation and elevated levels of host metabolites involved in activating N-methyl-d-aspartate receptors (such as metabolites within the tryptophan catabolism pathway) with established neurotoxic properties. Mechanistically, β-glucan can directly induce inflammation by binding to myeloid cells (via Dectin-1) and activating Syk/NF-κB signaling. Using a Dectin-1/NF-κB reporter model, we found that plasma from individuals experiencing PASC induced higher NF-κB signaling compared with plasma from negative controls. This higher NF-κB signaling was abrogated by piceatannol (Syk inhibitor). These data suggest a potential targetable mechanism linking fungal translocation and inflammation during PASC.

Keywords: COVID-19; Tight junctions; Virology.


Conflict of interest statement

Conflict of interest: AC, BCY, JWW, and CJP are employees of Monogram Biosciences, Inc., a division of Labcorp. SGD reports grants and/or personal fees from Gilead Sciences, Merck & Co., ViiV Healthcare, AbbVie, Eli Lilly & Co., BryoLogyx, and Enochian BioSciences. TJH reports grants from Merck and Co. and Bristol Myers Squibb.

Figures

Figure 1
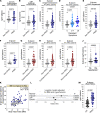
Figure 1. BMI and hypertension differentiate PASC from non-PASC in a subset of the UCSF LIINC cohort.
Demographic and clinical characteristics of 117 individuals from the UCSF LIINC cohort. Out of these 117 individuals, 61 individuals were experiencing 2 or more COVID-19–attributed symptoms 4 months following SARS-CoV-2 infection (PASC), whereas 56 individuals were not experiencing any ongoing symptoms (non-PASC). (AC) Mann-Whitney U comparisons of (A) age, (B) BMI, and (C) overall health/quality of life (QoL) score between PASC and non-PASC within the 117 individuals from the UCSF LIINC cohort. Median and IQR are displayed. (D) Fisher’s exact test comparisons of the indicated demographic and clinical characteristics between PASC and non-PASC within the 117 individuals from the UCSF LIINC cohort. + = yes; — = no.
Figure 2
Figure 2. PASC is associated with elevated levels of plasma markers of fungal translocation.
(A) Levels of zonulin in the plasma of 117 individuals from the UCSF LIINC cohort. Median and IQR are displayed. (B) Levels of LBP in the plasma. Median and IQR are displayed. (CF) Plasma levels of β-glucan. Levels of β-glucan are higher in PASC compared with non-PASC when analyzing all individuals (C), dividing the PASC group into individuals with 2–7 symptoms (n = 40) or ≥8 symptoms (n = 21) (D), analyzing only samples from individuals who were cared for as outpatients during their acute COVID-19 illness (E), or analyzing only samples from individuals hospitalized during their acute COVID-19 illness (F). Mann-Whitney U tests. Median and IQR are displayed. (GI) PASC was divided to 3 PASC phenotypes based on clinical symptom clusters, defined as having at least 1 symptom in the cluster — GI (nausea, diarrhea, loss of appetite, abdominal pain, vomiting), cardiopulmonary (cough, dyspnea, chest pain, palpitations), and neurocognitive (headache, concentration problems, dizziness, balance problems, neuropathy, vision problems). Levels of β-glucan were higher in individuals experiencing each of the 3 PASC symptom clusters compared with non-PASC. Mann-Whitney U tests. Median and IQR are displayed. (J) Mann-Whitney U comparison of the levels of β-glucan in individuals with or without a history of hypertension. Median and IQR are displayed. (K) Spearman’s rank correlation between BMI and the plasma levels of β-glucan. (L) A multivariate logistic model showing that the higher levels of β-glucan and zonulin (OR per 5-unit increase) can differentiate PASC from non-PASC within the UCSF LIINC cohort after adjusting for both BMI and hypertension. (M) Levels of β-glucan in individuals experiencing PASC in an independent validation cohort (Rush PASC cohort) compared with SARS-CoV-2–negative controls (matched for age and sex); Mann-Whitney U test. Median and IQR are displayed.
Figure 3
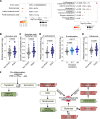
Figure 3. Fungal translocation correlates with inflammation during PASC.
(A) Three correlation heatmaps showing associations between β-glucan, LBP, or zonulin (in rows) and the number of symptoms during PASC, overall health/quality of life (QoL) score, and plasma levels of several inflammatory markers (in columns) measured in all (n = 117; top), non-PASC (n = 56; middle), and PASC (n = 61; bottom) groups from the UCSF LIINC cohort. The color of the square represents the strength of the Spearman’s rank correlation, where blue shades represent negative correlations and red shades represent positive correlations. *P < 0.05; **P < 0.01; ***P < 0.001. GFAP, glial fibrillary acidic protein; NFL, neurofilament; MCP1, monocyte chemoattractant protein 1; IP-10, IFN-γ–inducible protein of 10 kDa. (BG) Examples of the correlations between β-glucan and number of symptoms (UCSF LIINC cohort) (B), β-glucan and overall health/QoL score (UCSF LIINC cohort) (C), β-glucan and TNF-α or IL-6 (UCSF LIINC cohort) (D and E), and β-glucan and TNF-α or IL-6 (Rush PASC cohort) (F and G). Spearman’s rank correlation tests were used for statistical analysis. Blue = PASC, and gray = non-PASC in BE.
Figure 4
Figure 4. Plasma from individuals with PASC induces NF-κB signaling, which is dampened by the spleen tyrosine kinase inhibitor piceatannol.
(A) A schematic of the Dectin-1 receptor reporter cell line. This cell line stably expresses the Dectin-1 receptor and an NF-κB reporter linked to SEAP so that Dectin-1 receptor stimulation by β-glucan can be measured by quantifying SEAP activity. Syk, spleen tyrosine kinase. (B) The Dectin-1 receptor reporter cells were treated with plasma from individuals with PASC or SARS-CoV-2–negative controls in the presence or absence of the Syk inhibitor piceatannol. NF-κB signaling was detected (OD620 nm) 24 hours later. The comparison between the SARS-CoV-2–negative controls and PASC samples without piceatannol was performed using Mann-Whitney U test, and the comparisons between the conditions with and without piceatannol were performed using Wilcoxon’s signed rank tests. (C) Spearman’s rank correlation between levels of β-glucan in the plasma during PASC and NF-κB signaling induced by PASC plasma, using the Dectin-1 receptor reporter system.
Figure 5
Figure 5. PASC is associated with elevated levels of host metabolic agonists of NMDA receptors with established neurotoxic properties.
(A) Unbiased enrichment analyses of the 12 plasma metabolites whose levels differed between PASC and non-PASC groups within the UCSF LIINC cohort. Analysis was performed using MetaboAnalyst 5.0 (http://www.metaboanalyst.ca/). Left image: enrichment of certain classes of metabolites. Right image: enrichment of certain metabolic pathways using the Kyoto Encyclopedia of Genes and Genomes database. (BE) Mann-Whitney U comparisons of the plasma levels of quinolinic acid (B), quinolinic acid/tryptophan (Q/T) ratio (C), S-sulfocysteine (D), or l-glutamine (E) in PASC and non-PASC groups from the UCSF LIINC cohort. Median and IQR are displayed. (F) A model depicting 8 plasma metabolites whose levels differed between PASC from non-PASC groups (red indicates higher in PASC than non-PASC, and green indicates lower in PASC than non-PASC) within the UCSF LIINC cohort and their relationship to both the tryptophan catabolism pathway and the activation of the NMDA receptors. IDO, indoleamine 2,3-dioxygenase.
Figure 6
Figure 6. Levels of plasma host metabolites correlate with inflammation during PASC.
(A) Three correlation heatmaps showing associations between Q/T ratio, K/T ratio, and levels of selected metabolites (in rows) to levels of plasma β-glucan, the number of symptoms during PASC, overall health/QoL score, and plasma levels of several inflammatory markers (in columns) measured in all (n = 117; top), non-PASC (n = 56; middle), and PASC (n = 61; bottom) individuals from the UCSF LIINC cohort. The color of the square represents the strength of the Spearman’s rank correlation, with blue shades representing negative correlations and red shades representing positive correlations. *P < 0.05; **P < 0.01; ***P < 0.001. (B) Examples of the correlations between Q/T ratio and overall health/QoL score or β-glucan. (C) Examples of the correlations between quinolinic acid and overall health/QoL score or β-glucan. (D) Examples of the correlations between K/T ratio and overall health/QoL score or β-glucan. Spearman’s rank correlation tests were used for statistical analysis. Blue = PASC, and gray = non-PASC in BD.
Figure 7
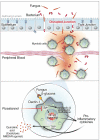
Figure 7. Model of how fungal translocation may contribute to inflammation during PASC.
Top: Our data suggest that during PASC there are elevated levels of fungal translocation from the gut and/or lung to the blood (possibly driven by increases in the tight junction permeability driver, zonulin). Bottom: The translocated β-glucans (fungal cell wall polysaccharides) bind to Dectin-1 on myeloid cells to activate the cellular inflammasome via the NF-κB pathway. Blocking the Syk pathway (using piceatannol) prevents the β-glucan–mediated myeloid inflammation in vitro and may prevent it during PASC. Finally, the inflammation (proinflammatory cytokines) can activate the tryptophan (TRP) catabolism pathway, and cause other metabolic dysregulations, to induce levels of host metabolic agonists of the NMDA receptors (NMDARs; such as quinolinic acid) with established neurotoxic properties.

Similar articles

Cited by

  • The microbiome in post-acute infection syndrome (PAIS).
    Guo C, Yi B, Wu J, Lu J. Guo C, et al. Comput Struct Biotechnol J. 2023 Aug 5;21:3904-3911. doi: 10.1016/j.csbj.2023.08.002. eCollection 2023. Comput Struct Biotechnol J. 2023. PMID: 37602232 Free PMC article. Review.
  • The gut-lung axis: the impact of the gut mycobiome on pulmonary diseases and infections.
    Sey EA, Warris A. Sey EA, et al. Oxf Open Immunol. 2024 Jul 24;5(1):iqae008. doi: 10.1093/oxfimm/iqae008. eCollection 2024. Oxf Open Immunol. 2024. PMID: 39193472 Free PMC article. Review.
  • Long COVID manifests with T cell dysregulation, inflammation, and an uncoordinated adaptive immune response to SARS-CoV-2.
    Yin K, Peluso MJ, Luo X, Thomas R, Shin MG, Neidleman J, Andrew A, Young K, Ma T, Hoh R, Anglin K, Huang B, Argueta U, Lopez M, Valdivieso D, Asare K, Deveau TM, Munter SE, Ibrahim R, Ständker L, Lu S, Goldberg SA, Lee SA, Lynch KL, Kelly JD, Martin JN, Münch J, Deeks SG, Henrich TJ, Roan NR. Yin K, et al. bioRxiv [Preprint]. 2023 Aug 4:2023.02.09.527892. doi: 10.1101/2023.02.09.527892. bioRxiv. 2023. Update in: Nat Immunol. 2024 Feb;25(2):218-225. doi: 10.1038/s41590-023-01724-6 PMID: 36798286 Free PMC article. Updated. Preprint.
  • Biomarkers in long COVID-19: A systematic review.
    Lai YJ, Liu SH, Manachevakul S, Lee TA, Kuo CT, Bello D. Lai YJ, et al. Front Med (Lausanne). 2023 Jan 20;10:1085988. doi: 10.3389/fmed.2023.1085988. eCollection 2023. Front Med (Lausanne). 2023. PMID: 36744129 Free PMC article.
  • Researching COVID to Enhance Recovery (RECOVER) adult study protocol: Rationale, objectives, and design.
    Horwitz LI, Thaweethai T, Brosnahan SB, Cicek MS, Fitzgerald ML, Goldman JD, Hess R, Hodder SL, Jacoby VL, Jordan MR, Krishnan JA, Laiyemo AO, Metz TD, Nichols L, Patzer RE, Sekar A, Singer NG, Stiles LE, Taylor BS, Ahmed S, Algren HA, Anglin K, Aponte-Soto L, Ashktorab H, Bassett IV, Bedi B, Bhadelia N, Bime C, Bind MC, Black LJ, Blomkalns AL, Brim H, Castro M, Chan J, Charney AW, Chen BK, Chen LQ, Chen P, Chestek D, Chibnik LB, Chow DC, Chu HY, Clifton RG, Collins S, Costantine MM, Cribbs SK, Deeks SG, Dickinson JD, Donohue SE, Durstenfeld MS, Emery IF, Erlandson KM, Facelli JC, Farah-Abraham R, Finn AV, Fischer MS, Flaherman VJ, Fleurimont J, Fonseca V, Gallagher EJ, Gander JC, Gennaro ML, Gibson KS, Go M, Goodman SN, Granger JP, Greenway FL, Hafner JW, Han JE, Harkins MS, Hauser KSP, Heath JR, Hernandez CR, Ho O, Hoffman MK, Hoover SE, Horowitz CR, Hsu H, Hsue PY, Hughes BL, Jagannathan P, James JA, John J, Jolley S, Judd SE, Juskowich JJ, Kanjilal DG, Karlson EW, Katz SD, Kelly JD, Kelly SW, Kim AY, Kirwan JP, Knox KS, Kumar A, Lamendola-Essel MF, Lanca M, Lee-Lannotti JK, Lefebvre RC, Levy BD, Lin JY, Logarbo BP Jr, Logue JK, Longo MT, Luciano CA, Lutrick K, Malakooti SK, Ma… See abstract for full author list ➔ Horwitz LI, et al. PLoS One. 2023 Jun 23;18(6):e0286297. doi: 10.1371/journal.pone.0286297. eCollection 2023. PLoS One. 2023. PMID: 37352211 Free PMC article.

References

    1. Liu Y, et al. Viral dynamics in mild and severe cases of COVID-19. Lancet Infect Dis. 2020;20(6):656–657. doi: 10.1016/S1473-3099(20)30232-2. - DOI - PMC - PubMed
    1. Zhu N, et al. A novel coronavirus from patients with pneumonia in China, 2019. N Engl J Med. 2020;382(8):727–733. doi: 10.1056/NEJMoa2001017. - DOI - PMC - PubMed
    1. Mahase E. Long covid could be four different syndromes, review suggests. BMJ. 2020;371:m3981. - PubMed
    1. Halpin SJ, et al. Postdischarge symptoms and rehabilitation needs in survivors of COVID-19 infection: a cross-sectional evaluation. J Med Virol. 2020;93(2):1013–1022. - PubMed
    1. Huang Y, et al. Impact of coronavirus disease 2019 on pulmonary function in early convalescence phase. Respir Res. 2020;21(1):163. doi: 10.1186/s12931-020-01429-6. - DOI - PMC - PubMed

Publication types