

Integrated Microbiome and Host Transcriptome Profiles Link Parkinson's Disease to Blautia Genus: Evidence From Feces, Blood, and Brain
- PMID: 35722294
- PMCID: PMC9204254
- DOI: 10.3389/fmicb.2022.875101
Integrated Microbiome and Host Transcriptome Profiles Link Parkinson's Disease to Blautia Genus: Evidence From Feces, Blood, and Brain
Abstract
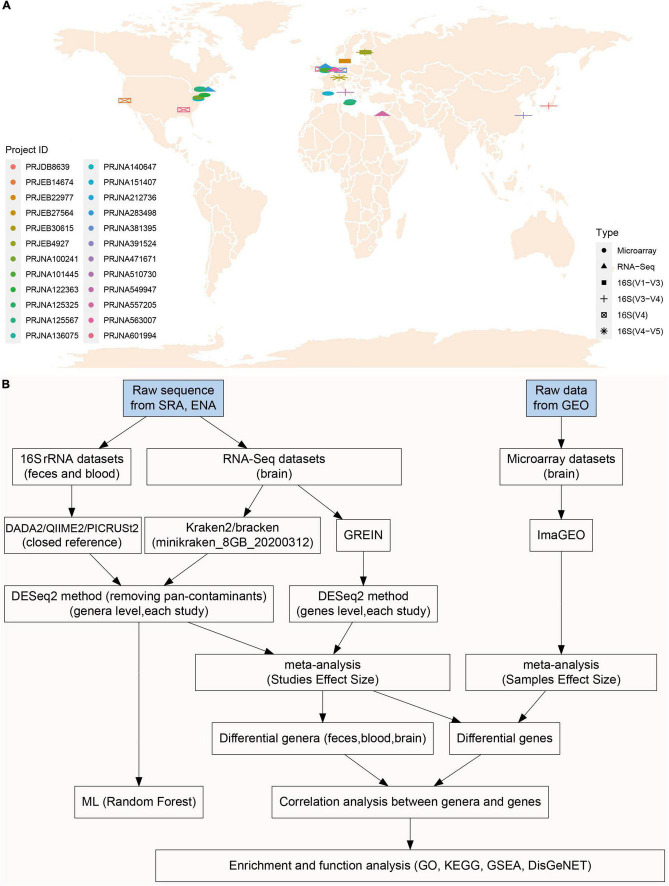
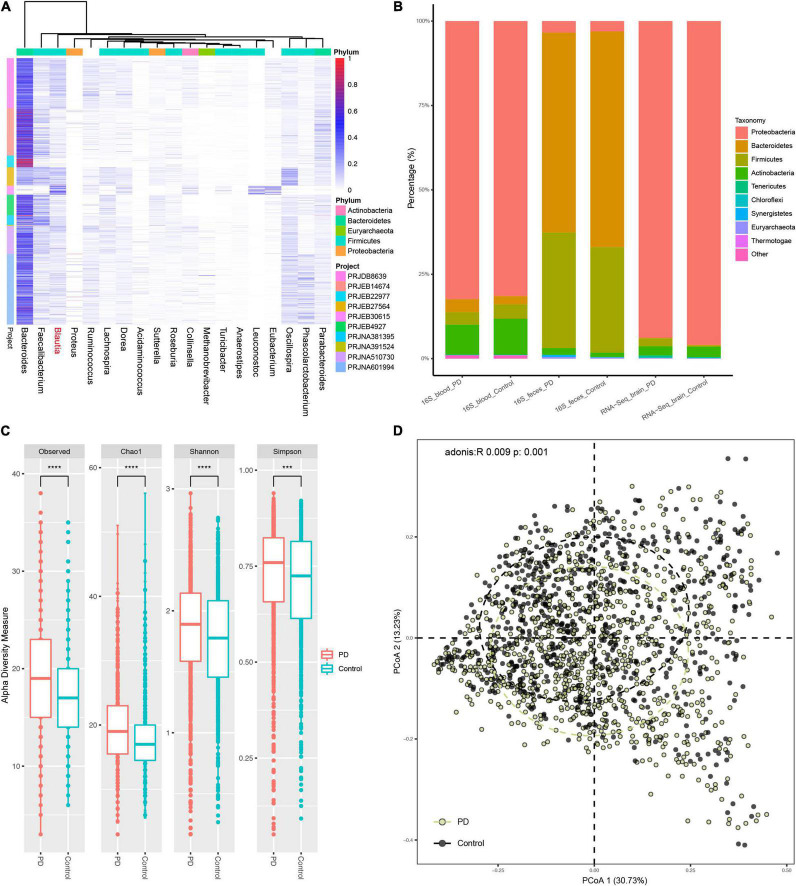
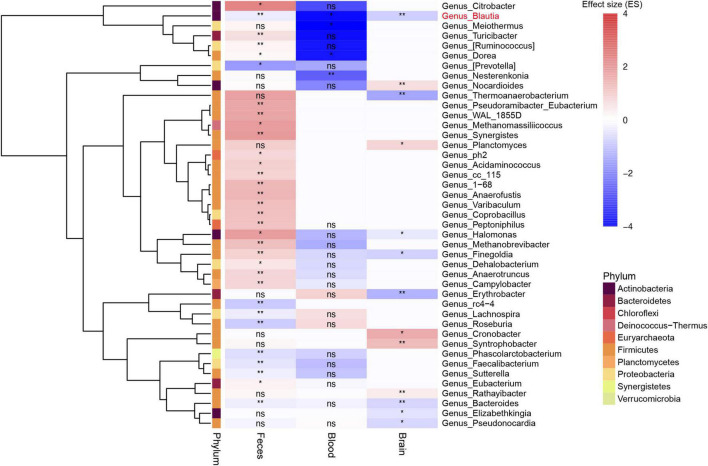
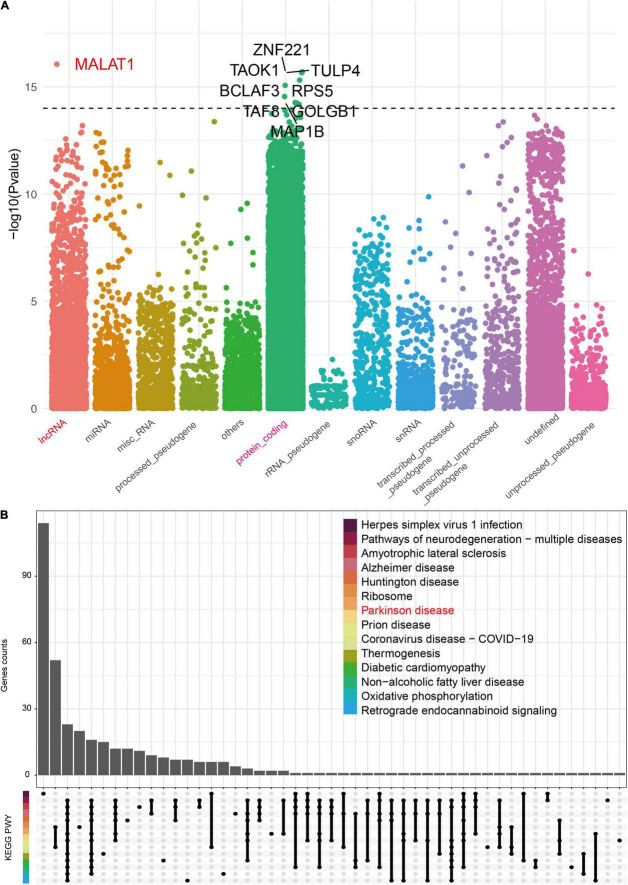
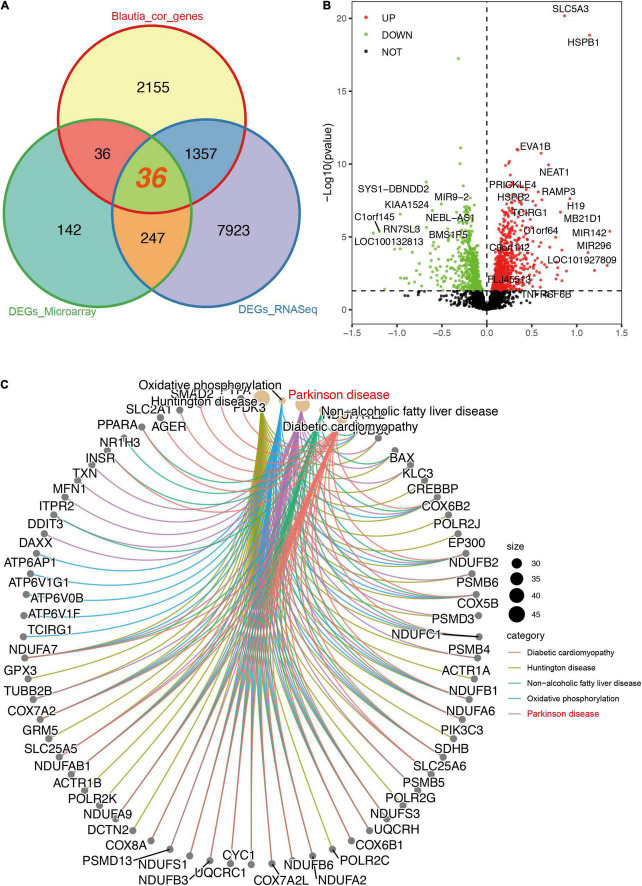
A link between the gut microbiome and Parkinson's disease (PD) has been intensively studied, and more than 100 differential genera were identified across the studies. However, the predominant genera contributing to PD remain poorly understood. Inspired by recent advances showing microbiota distribution in the blood and brain, we, here, comprehensively investigated currently available fecal microbiome data (1,914 samples) to identify significantly altered genera, which were further validated by comparison to the results from microbiome analysis of blood (85 samples) and brain (268 samples). Our data showed that the composition of fecal microbiota was different from that of blood and brain. We found that Blautia was the unique genus consistently depleted across feces, blood, and brain samples of PD patients (P < 0.05), despite using rigorous criteria to remove contaminants. Moreover, enrichment analyses revealed that host genes correlated with Blautia genus abundance were mainly involved in mitochondrial function and energy metabolism, and mapped to neurodegenerative diseases (NDDs) and metabolic diseases. A random forest classifier constructed with fecal microbiota data demonstrated that Blautia genus was an important feature contributing to discriminating PD patients from controls [receiver operating characteristic (ROC)-area under curve (AUC) = 0.704, precision-recall curve (PRC)-AUC = 0.787]. Through the integration of microbiome and transcriptome, our study depicted microbial profiles in the feces, blood, and brain of PD patients, and identified Blautia genus as a potential genus linked to PD. Further studies are greatly encouraged to determine the role of Blautia genus in the pathogenesis of PD.
Keywords: 16S; Blautia; Parkinson’s disease; feces; microbiome.
Copyright © 2022 Guo, Tang, Hou, Chong, Zhang, Liu, Chen, Liu, Zhang and Li.
Conflict of interest statement
The authors declare that the research was conducted in the absence of any commercial or financial relationships that could be construed as a potential conflict of interest.
Figures


Similar articles
-
Colonic bacterial composition in Parkinson's disease.Mov Disord. 2015 Sep;30(10):1351-60. doi: 10.1002/mds.26307. Epub 2015 Jul 16. Mov Disord. 2015. PMID: 26179554
-
The impact of Parkinson's disease-associated gut microbiota on the transcriptome in Drosophila.Microbiol Spectr. 2023 Sep 27;11(5):e0017623. doi: 10.1128/spectrum.00176-23. Online ahead of print. Microbiol Spectr. 2023. PMID: 37754772 Free PMC article.
-
Gut Microbiota Altered in Mild Cognitive Impairment Compared With Normal Cognition in Sporadic Parkinson's Disease.Front Neurol. 2020 Feb 25;11:137. doi: 10.3389/fneur.2020.00137. eCollection 2020. Front Neurol. 2020. PMID: 32161568 Free PMC article.
-
Gut Vibes in Parkinson's Disease: The Microbiota-Gut-Brain Axis.Mov Disord Clin Pract. 2019 Oct 23;6(8):639-651. doi: 10.1002/mdc3.12840. eCollection 2019 Nov. Mov Disord Clin Pract. 2019. PMID: 31745471 Free PMC article. Review.
-
Blautia-a new functional genus with potential probiotic properties?Gut Microbes. 2021 Jan-Dec;13(1):1-21. doi: 10.1080/19490976.2021.1875796. Gut Microbes. 2021. PMID: 33525961 Free PMC article. Review.
Cited by
-
The Interplay between Gut Microbiota and Parkinson's Disease: Implications on Diagnosis and Treatment.Int J Mol Sci. 2022 Oct 14;23(20):12289. doi: 10.3390/ijms232012289. Int J Mol Sci. 2022. PMID: 36293176 Free PMC article. Review.
-
New Pieces for an Old Puzzle: Approaching Parkinson's Disease from Translatable Animal Models, Gut Microbiota Modulation, and Lipidomics.Nutrients. 2023 Jun 16;15(12):2775. doi: 10.3390/nu15122775. Nutrients. 2023. PMID: 37375679 Free PMC article. Review.
-
Causal Relationship Between Sjögren's Syndrome and Gut Microbiota: A Two-Sample Mendelian Randomization Study.Biomedicines. 2024 Oct 18;12(10):2378. doi: 10.3390/biomedicines12102378. Biomedicines. 2024. PMID: 39457690 Free PMC article.
-
Gut microbiota produces biofilm-associated amyloids with potential for neurodegeneration.Nat Commun. 2024 May 16;15(1):4150. doi: 10.1038/s41467-024-48309-x. Nat Commun. 2024. PMID: 38755164 Free PMC article.
-
Gut microbiota defined epigenomes of Alzheimer's and Parkinson's diseases reveal novel targets for therapy.Epigenomics. 2024 Jan;16(1):57-77. doi: 10.2217/epi-2023-0342. Epub 2023 Dec 13. Epigenomics. 2024. PMID: 38088063 Free PMC article. Review.
References
-
- Benítez-Páez A., Gómez del Pugar E. M., López-Almela I., Moya-Pérez Á, Codoñer-Franch P., Sanz Y. (2020). Depletion of Blautia species in the microbiota of obese children relates to intestinal inflammation and metabolic phenotype worsening. mSystems 5:e00857-19. 10.1128/mSystems.00857-19 - DOI - PMC - PubMed
-
- Bisanz J. (2018). qiime2R: importing QIIME2 artifacts and associated data into R sessions. Version 0.99 13.
LinkOut - more resources
Full Text Sources