. 2022 Jun 17;13(1):3488.
doi: 10.1038/s41467-022-31241-3.

Context-dependent enhancer function revealed by targeted inter-TAD relocation

Affiliations

Context-dependent enhancer function revealed by targeted inter-TAD relocation

Christopher Chase Bolt et al. Nat Commun. .

Abstract

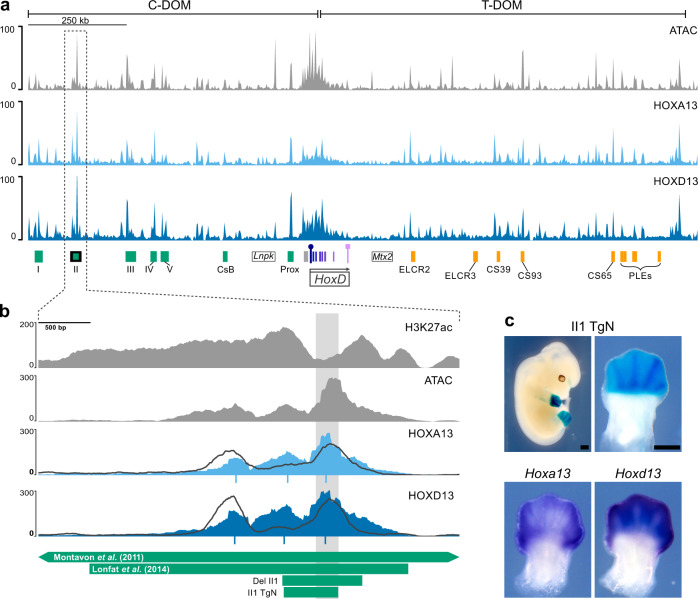
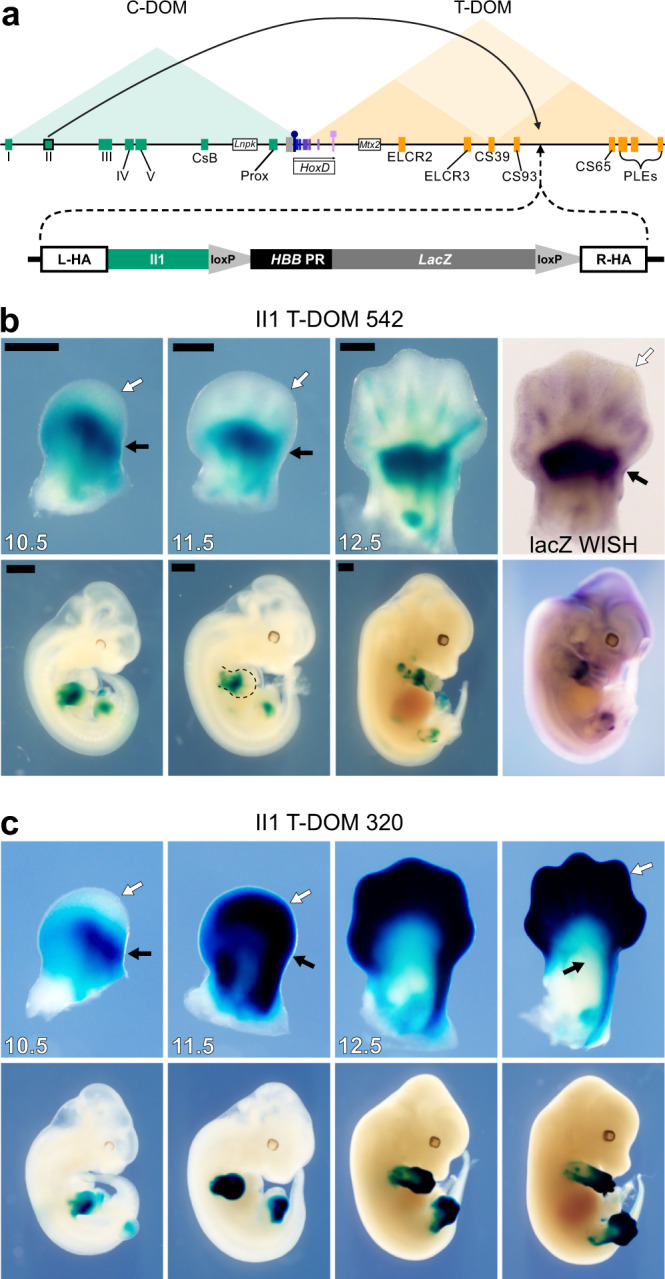
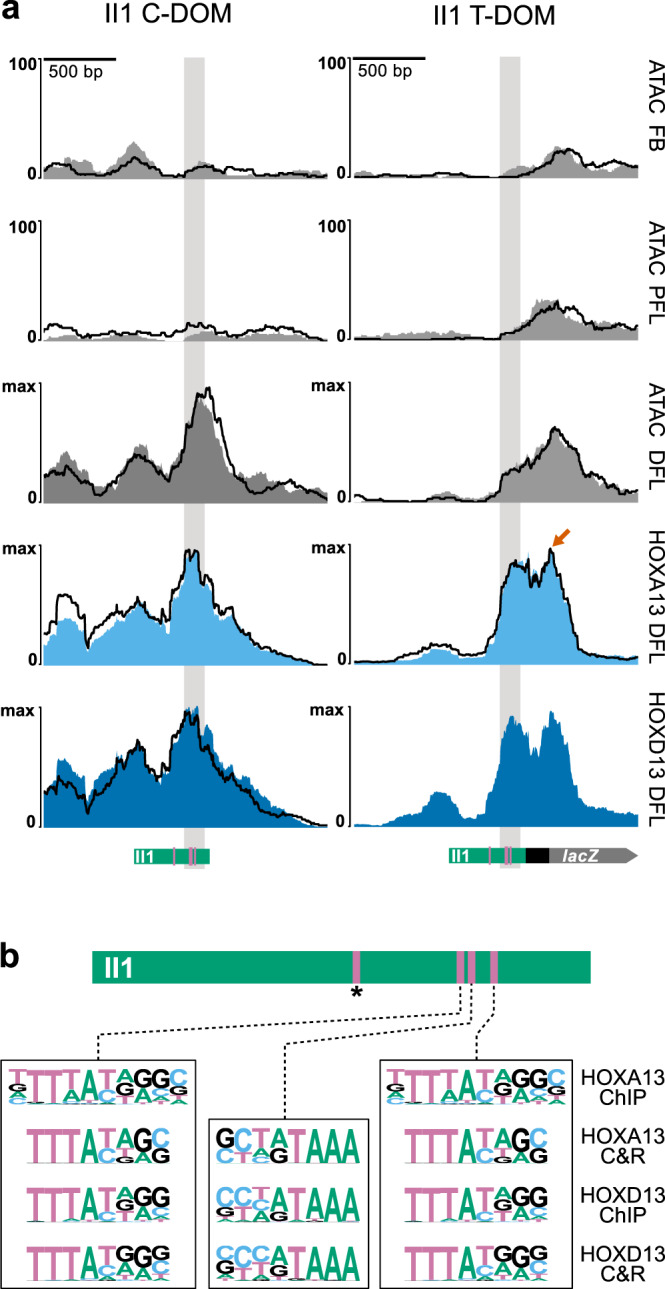
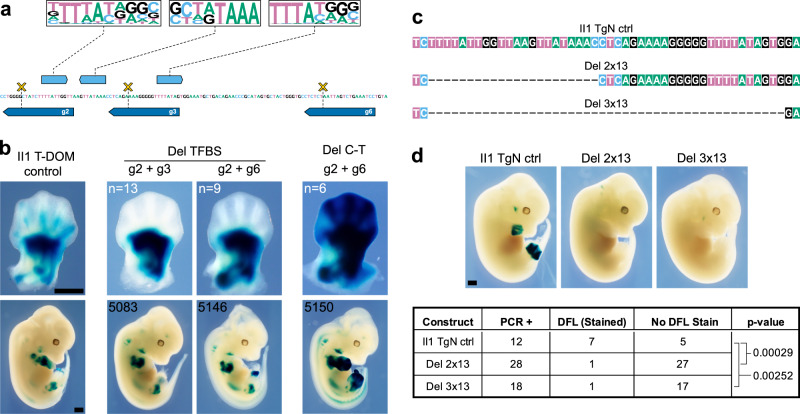
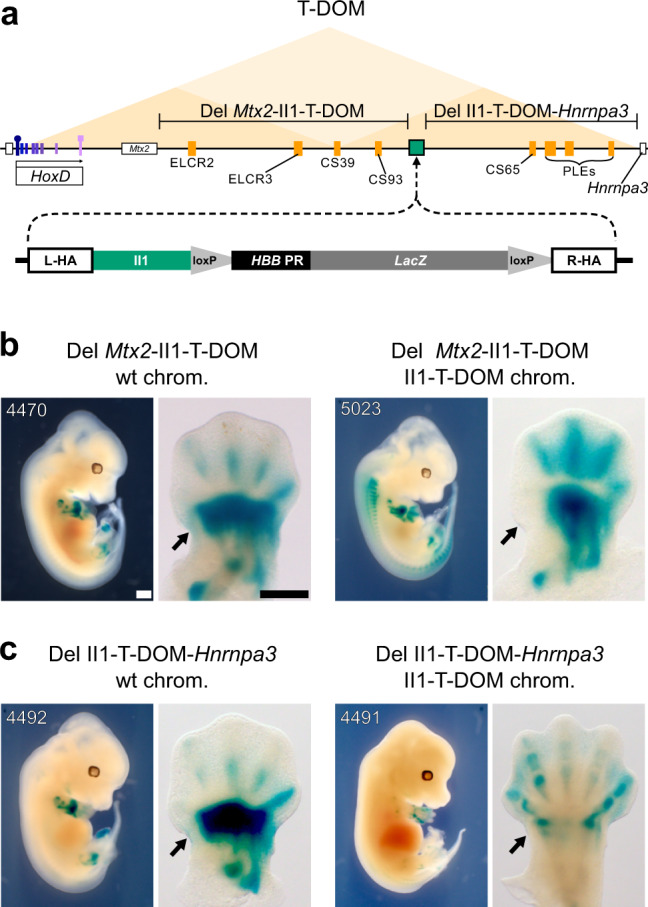
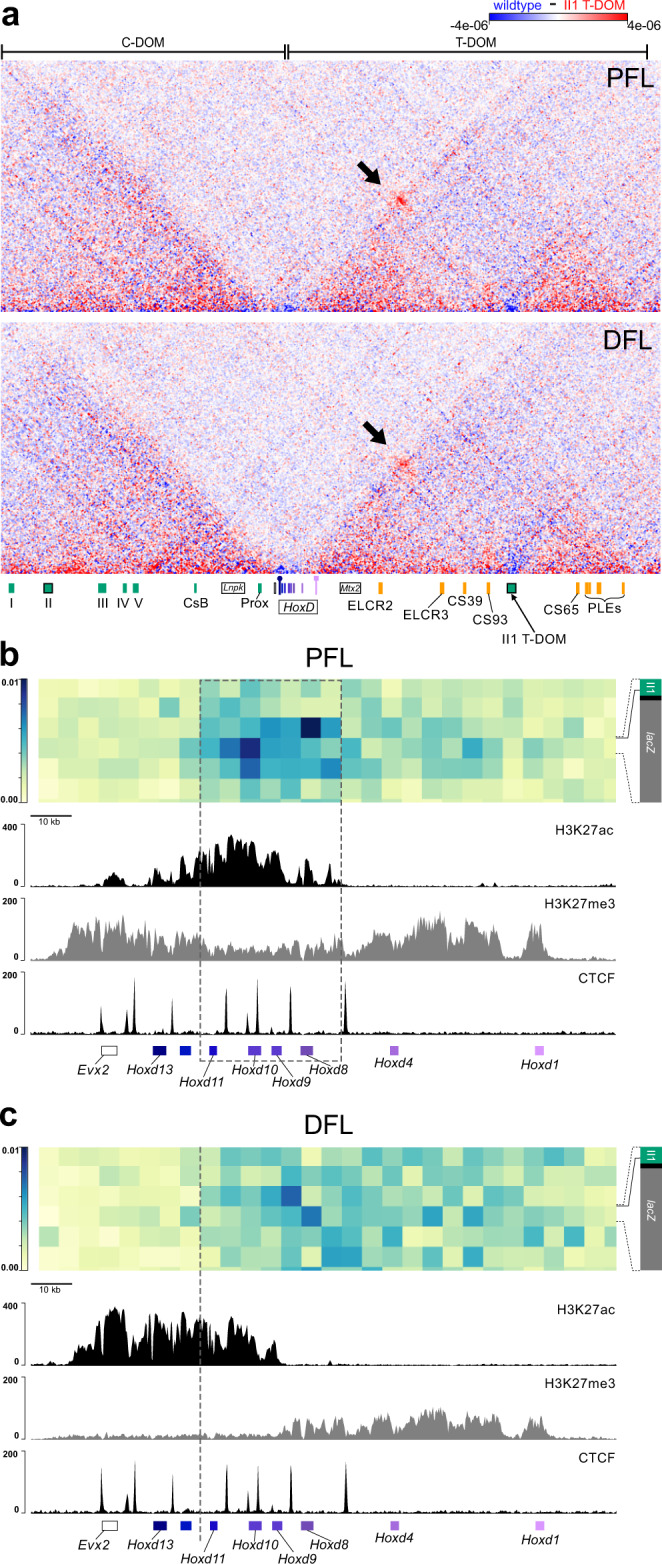
The expression of some genes depends on large, adjacent regions of the genome that contain multiple enhancers. These regulatory landscapes frequently align with Topologically Associating Domains (TADs), where they integrate the function of multiple similar enhancers to produce a global, TAD-specific regulation. We asked if an individual enhancer could overcome the influence of one of these landscapes, to drive gene transcription. To test this, we transferred an enhancer from its native location, into a nearby TAD with a related yet different functional specificity. We used the biphasic regulation of Hoxd genes during limb development as a paradigm. These genes are first activated in proximal limb cells by enhancers located in one TAD, which is then silenced when the neighboring TAD activates its enhancers in distal limb cells. We transferred a distal limb enhancer into the proximal limb TAD and found that its new context suppresses its normal distal specificity, even though it is bound by HOX13 transcription factors, which are responsible for the distal activity. This activity can be rescued only when a large portion of the surrounding environment is removed. These results indicate that, at least in some cases, the functioning of enhancer elements is subordinated to the host chromatin context, which can exert a dominant control over its activity.


Conflict of interest statement

The authors declare no competing interests.

Figures

Fig. 1
Fig. 1. Identification of a distal limb bud-specific enhancer.
a ATAC-seq profile (top) and binding profiles of the HOXA13 (middle) and HOXD13 (bottom) transcription factors by CUT&RUN, using E12.5 wild-type distal forelimb cells, covering the entire HoxD locus, including the two flanking TADs C-DOM and T-DOM (mm10 chr2:73950000-75655000). Green rectangles below are distal limb enhancers in C-DOM and orange rectangles are proximal limb enhancers in T-DOM. The Hoxd gene cluster is indicated at the center (the 5′ to 3′ direction of transcription is indicated by a black arrow) and the Lnpk and Mtx2 genes are indicated as rectangles with black borders. The Hoxd13 gene is on the centromeric end of the cluster and indicated by a purple rectangle with a circle on top, whereas Hoxd1 is telomeric and indicated by a square top. The C-DOM Island II enhancer is a green rectangle with a black border and its corresponding signal peaks are surrounded by a dashed vertical box. b Magnification of the same tracks as above centered around the Island II enhancer with the H3K27ac ChIP-seq signal (top) in E12.5 distal forelimbs. The overlying profiles indicated by dark gray lines are from ChIP-seq using E11.5 whole limb buds and are shown for comparison. Below the CUT&RUN profiles are the MACS2 peak summits for the corresponding CUT&RUN samples. The green rectangles below indicate regions described as Island II in or in. The Del II1 shows the region deleted in this work (Supplementary Fig. 1-2) and II1 TgN is the transgene used panel in the next panel. c LacZ staining pattern produced by the II1:HBB:LacZ (II1 TgN) enhancer reporter transgene at E12.5, showing high specificity for distal limb cells (top). Below are whole-mount in situ hybridizations for Hoxa13 and Hoxd13 in wild-type E12. 5 forelimbs for comparison. Scale bars are 0.5 mm.
Fig. 2
Fig. 2. Targeted recombination of the II1 transgene into T-DOM.
a Scheme of the HoxD locus with the triangles indicating the extent of both the C-DOM (green) and T-DOM (orange) TADs. Enhancers are green (distal limbs) or orange (proximal limbs) rectangles and the HoxD cluster is boxed. The arcing arrow on top indicates the origin and new location of the island II enhancer transgene into T-DOM. Below is a map of the II1:HHB:LacZ construct containing left (L-HA) and right (R-HA) homology arms, the II1 enhancer element, and the HBB promoter with a LacZ reporter gene. b B-galactosidase staining time course and LacZ mRNA (right panel) of the single-copy II1 T-DOM 542 founder line. At E10.5 and 11.5, staining is strong in the proximal limb (white arrow) while absent in the distal portion (black arrow). By E12.5 weak staining appears in the digit mesenchyme of the distal limb. The WISH for LacZ mRNA confirms that distal limb staining comes from transcription in distal limb cells rather than from stable B-galactosidase activity. c B-galactosidase staining in the multi-copy II1 T-DOM 320 founder line is stronger and more distal, except at the earliest time point where it is more similar to line 542. Black scales bars are 0.5 mm.
Fig. 3
Fig. 3. HOX13 transcription factor proteins bind to the II1 enhancer in T-DOM.
a ATAC-Seq and CUT&RUN reads mapped to the II1 enhancer sequence, either in its native environment within C-DOM (left column; mm10 chr2:74,074,674-74,076,672), or its targeted recombination site within T-DOM (breeding line 542, right column; mm10 chr2:75,268,925-75,270,923). The II1 C-DOM element is not accessible by ATAC-Seq in E12.5 forebrain (FB), nor in proximal forelimb cells (PFL) samples. At E12.5 it becomes highly accessible in distal forelimb cells (DFL) and is strongly bound by HOX13 proteins. The II1 element in T-DOM has low accessibility in the FB and PFL samples, even though there is a high transcription of the transgene in PFL. Like the II1 element in C-DOM, the II1 enhancer in T-DOM is occupied by HOX13 proteins in distal limb cells. It also shows an additional peak over the HBB promoter (orange arrow). This peak is likely a non-specific signal resulting from promiscuous MNase activity used in the CUT&RUN technique. In all samples but HOXD13 in the II1 T-DOM allele, experiments were performed in duplicate. One biological replicate is plotted as a solid color and the other is shown as a superimposed black line (n = 2). Green rectangles below indicate the position of the II1 enhancer element relative to the peak signal; the position of the four HOX13 binding sites is indicated by pink lines. b On top is a schematic of the II1 enhancer element with the four HOX13 motifs indicated as pink bars. The pink bar with an asterisk indicates the motif position that is not near the HOX13 and ATAC peaks. At the bottom are the three HOX13 motifs identified by HOMER motif discovery in the CUT&RUN experiments here and the E11.5 whole forelimb ChIP-seq.
Fig. 4
Fig. 4. The effects of deleting HOX13 binding sites.
a On top are the HOX13 motifs in the II1 element, identified in Fig. 3b, with their positions indicated below (light blue boxes with orientations). The dark blue boxes below the DNA sequence indicate the positions and orientations of the CRISPR guides. Combinations of guides were used to generate small deletions (g2 + g3 or g2 + g6). The yellow crosses indicate the approximate cutting position of the Cas9. b E12.5 F0 LacZ stained embryos containing these deletions. The left panel is a II1 T-DOM control limb (no CRISPR cutting), with weak staining in the distal digit mesenchyme (dozens were stained). The two central panels are representative embryos (sample size n indicated in upper left corners) with the indicated deletions (see Supplementary Fig. 4-1 for images of all embryos including these two #5083 and #5146). Embryos carrying either the g2 + g3 or g2 + g6 deletions lost all staining in distal limb cells. In the same litters, we observed some embryos with strong distal limb staining (as shown in the right panel, see also Supplementary Fig. 4-1b, c). They contained a deletion that extends from the native II1 element in C-DOM to the II1 transgenic element in T-DOM, due to the guide RNA sequence presence at both sites (scheme in Supplementary Fig. 4-1c). Deletions in all embryos were sequenced (Supplementary Data 2). Embryos with ambiguous sequencing results or mosaicism were not used in this analysis. c DNA sequence, mapping to the putative HOX13 binding sites in the II1 enhancer elements (see a). II1 transgenic embryos were generated using these variants as the transgenic material. The top track is the wild-type sequence used in control embryos (II1 TgN ctrl). The Del 2 × 13 sequence lacks the two centromeric motifs (see a), while the Del 3 × 13 sequence lacks all three motifs for putative HOX13 binding. d On top are LacZ stained E12.5 transgenic embryos, the table below reports the number of embryos positive for the transgene by PCR (PCR + ), the second column is the number of embryos that stained in the distal forelimb (DFL), followed by the embryos with no staining in the DFL (No DFL Stain). The p values are determined by two-sided Fisher’s exact tests. Representative embryos are shown for each transgene. See also Supplementary Fig. 4-2. Scale bars are 0.5 mm.
Fig. 5
Fig. 5. Restoring distal enhancer activity by removing the T-DOM chromatin environment.
a Schematic of T-DOM with the Hoxd gene cluster on the left (purple boxes), Hoxd1 with a square and Hoxd13 with a circle on top. The Mtx2 gene is next to Hoxd1 and Hnrnpa3 is the small white box with black border on the right of T-DOM. The position of the II1 transgene insertion into T-DOM is indicated by a green rectangle with black border (mm10 chr2:75269597-75269616). Orange rectangles are known proximal limb enhancers. The two regions deleted by CRISPR are indicated above the genomic map (Del Mtx2-II1-T-DOM and Del II1-T-DOM-Hnrnpa3). b The effect on LacZ staining caused by deleting the centromeric portion of T-DOM (Del Mtx2-II1-T-DOM). The left two panels are a control embryo with the deletion on the wild-type chromosome, and so are not expected to show changes in staining. In the right two panels, embryos with the deletion on the same chromosome as the II1 T-DOM 542 transgene, showing a light loss of staining in the proximal domain (black arrows) and a gain in the distal domain. All embryos used were photographed and included in Supplementary Fig. 5a, n = 6 and n = 5, respectively. c The effect of deleting the telomeric portion of T-DOM (Del II1-T-DOM-Hnrnpa3) on LacZ staining, with an almost complete loss of staining in the proximal domain (black arrows) and no substantial impact on the distal domain (n = 5, and n = 6, respectively). The embryos shown here are also displayed in Supplementary Fig. 5b to show the complete series of stained embryos. Scale bars are 0.5 mm.
Fig. 6
Fig. 6. The II1 enhancer in T-DOM contacts the Hoxd gene cluster.
a Capture Hi-C maps at 5 kb bin resolution over the entire HoxD locus (mm10 chr2:73,950,000–75,655,000), displayed as the subtraction of wild type signal (blue) from the II1 T-DOM 542 allele signal (red). The II1 enhancer transgene inserted in the T-DOM (arrow on the green rectangle at the bottom) produces clear contacts with the Hoxd gene cluster (black arrow pointing to the red bins). The contacts are established in both proximal forelimb (PFL) and distal forelimb (DFL) cells. b Contacts between the Hoxd gene cluster (x-axis, genes are indicated below) and the region covering the II1 T-DOM reporter transgene (y-axis) in proximal forelimb cells (PFL). The II1 T-DOM construct is schematized on the y-axis for clarity (right), a solid black line indicates where the bin boundary aligns to the transgene. The II1 enhancer is shown in green, the HBB promoter is black, and the LacZ gene is in gray. The panels below are the H3K27ac, H3K27me3, and CTCF ChIP-Seq tracks from wild type PFL cells, aligned with the interaction matrix above. The strongest contacts are between the II1 T-DOM reporter transgene and the region around Hoxd8 and Hoxd10, matching genes transcribed in proximal limb cells, surrounded by a gray dashed box. c Same as in b but using distal forelimb cells (DFL),. The inserted II1 T-DOM transgene establishes more diffuse contacts, extending from Hoxd1 to Hoxd11 and stopping abruptly before those genes highly that are expressed in distal cells (Hoxd12, Hoxd13).

Similar articles

Cited by

References

    1. Banerji J, Rusconi S, Schaffner W. Expression of a beta-globin gene is enhanced by remote SV40 DNA sequences. Cell. 1981;27:299–308. doi: 10.1016/0092-8674(81)90413-X. - DOI - PubMed
    1. Bolt CC, Duboule D. The regulatory landscapes of developmental genes. Development. 2020;147:dev171736. doi: 10.1242/dev.171736. - DOI - PMC - PubMed
    1. Spitz F, Gonzalez F, Duboule D. A global control region defines a chromosomal regulatory landscape containing the HoxD cluster. Cell. 2003;113:405–417. doi: 10.1016/S0092-8674(03)00310-6. - DOI - PubMed
    1. Nora EP, et al. Spatial partitioning of the regulatory landscape of the X-inactivation centre. Nature. 2012;485:381–385. doi: 10.1038/nature11049. - DOI - PMC - PubMed
    1. Dixon JR, et al. Topological domains in mammalian genomes identified by analysis of chromatin interactions. Nature. 2012;485:376–380. doi: 10.1038/nature11082. - DOI - PMC - PubMed

Publication types