. 2022 May 31:13:895844.
doi: 10.3389/fmicb.2022.895844. eCollection 2022.

A Satellite dsRNA Attenuates the Induction of Helper Virus-Mediated Symptoms in Aspergillus flavus

Affiliations

A Satellite dsRNA Attenuates the Induction of Helper Virus-Mediated Symptoms in Aspergillus flavus

Yinhui Jiang et al. Front Microbiol. .

Abstract

Aspergillus flavus is an important fungal pathogen of animals and plants. Previously, we reported a novel partitivirus, Aspergillus flavus partitivirus 1 (AfPV1), infecting A. flavus. In this study, we obtained a small double-stranded (ds) RNA segment (734 bp), which is a satellite RNA of the helper virus, AfPV1. The presence of AfPV1 altered the colony morphology, decreased the number of conidiophores, created significantly larger vacuoles, and caused more sensitivity to osmotic, oxidative, and UV stresses in A. flavus, but the small RNA segment could attenuate the above symptoms caused by the helper virus AfPV1 in A. flavus. Moreover, AfPV1 infection reduced the pathogenicity of A. flavus in corn (Zea mays), honeycomb moth (Galleria mellonella), mice (Mus musculus), and the adhesion of conidia to host epithelial cells, and increased conidial death by macrophages. However, the small RNA segment could also attenuate the above symptoms caused by the helper virus AfPV1 in A. flavus, perhaps by reducing the genomic accumulation of the helper virus AfPV1 in A. flavus. We used this model to investigate transcriptional genes regulated by AfPV1 and the small RNA segment in A. flavus, and their role in generating different phenotypes. We found that the pathways of the genes regulated by AfPV1 in its host were similar to those of retroviral viruses. Therefore, some pathways may be of benefit to non-retroviral viral integration or endogenization into the genomes of its host. Moreover, some potential antiviral substances were also found in A. flavus using this system.

Keywords: Aspergillus flavus; Aspergillus flavus partitivirus 1; a satellite dsRNA; transcriptional analysis; virus therapy.


Conflict of interest statement

The authors declare that the research was conducted in the absence of any commercial or financial relationships that could be construed as a potential conflict of interest.

Figures
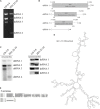
FIGURE 1
FIGURE 1
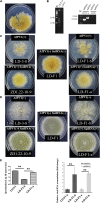
Genomic organization of AfPV1 and SatRNA. (A) Agarose gel electrophoresis of the dsRNA segments extracted from A. flavus isolate LD-3-8 and ZD1.22-10. (B) Genome organization of dsRNA1, dsRNA2, and dsRNA3 indicated by the diagrammatic representation. (C) Detection of dsRNA1, dsRNA2, dsRNA3, and dsRNA4 by northern blot. Probe-dsRNA1, probe-dsRNA2, probe-dsRNA3, and probe-dsRNA4 were mixed or used separately to detect RNAs. (D) Secondary structure analysis of the dsRNA4 using RNAstructure 6.3 (Lu et al., 2006) showed that ribonucleotides are involved in the formation of secondary structures and predicted the presence of stem-loop structures. (E) Identity at the 5′-terminal of dsRNA1, dsRNA2, dsRNA3, and dsRNA4. Gray shading indicates that nucleotides are identical in the three segments.
FIGURE 2
FIGURE 2
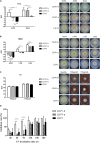
Effects of AfPV1 and satellite RNA in A. flavus. (A) Paired-cultures between the donor isolate ZD1.22-10-9 (left) and the virus-free recipient isolate LD-F1 (right). Derivative isolates were obtained from the mycelial agar plugs of LD-F1. (B) Agarose gel electrophoresis of dsRNA extracted from derivative isolates (left), and RT-PCR detection for AfPV1 and satellite RNA (right). Colony morphology of isolates LD-3-8, ZD1.22-10-9, LD-F1, LD-F1-a, and LD-F1-b after culturing on CZ (C) and PDA (D) for 6 days. (E) Sporulation of isolates LD-F1, LD-F1-b, and LD-F1-a (left). The accumulation of AfPV1 in isolates LD-F1-a and LD-F1-b (right). Isolate LD-3-8 was infected with AfPV1, virus-free isolate LD-F1 was obtained from isolate LD-3-8 by single sporing, and then was labeled with a pyrithiamine resistance (ptr) gene, and isolate LD-F1-b was one of the derivative isolates, obtained by transferring AfPV1 from isolate LD-3-8 (donor) to the virus-free isolate LD-F1 (recipient). Isolate ZD1.22-10-9 was infected with AfPV1 and satellite RNA, while isolate LD-F1-a was one of the derivative isolates, obtained by transferring AfPV1 and satellite RNA from isolate ZD1.22-10-9 (donor) to the virus-free isolate LD-F1 (recipient). *P < 0.05, **P < 0.01, ***P < 0.001, by Tukey’s multiple comparison tests.
FIGURE 3
FIGURE 3
(A) Conidial head of virus-free isolate (LD-F1), AfPV1-infected isolate (LD-F1-b), and AfPV1- and SatRNA-infected isolate (LD-F1-a) were observed by scanning electron microscopy (SEM). (B) Morphology of vacuoles in virus-free isolate (LD-F1), AfPV1-infected isolate (LD-F1-b), and AfPV1- and SatRNA-infected isolate (LD-F1-a) was observed by transmission electron microscope (TEM).
FIGURE 4
FIGURE 4
Comparisons of tolerance to stresses by virus-free isolate (LD-F1), AfPV1-infected isolate (LD-F1-b), and AfPV1- and SatRNA-infected isolate (LD-F1-a). Radial growth inhibition under oxidative stress (A), osmotic stress (B), cell wall stress (C), UV stress (D). *P < 0.05, **P < 0.01, ***P < 0.001, by Tukey’s multiple comparison tests.
FIGURE 5
FIGURE 5
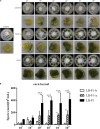
(A) Colonization of virus-free isolate (LD-F1), AfPV1-infected isolate (LD-F1-b), and AfPV1- and SatRNA-infected isolate (LD-F1-a) on maize kernel. (B) Conidia production of virus-free isolate (LD-F1), AfPV1-infected isolate (LD-F1-b), and AfPV1- and SatRNA-infected isolate (LD-F1-a) was assessed on infected maize kernels. *P < 0.05, **P < 0.01, ***P < 0.001, by Tukey’s multiple comparison tests.
FIGURE 6
FIGURE 6
(A) Determination of the optimal spore concentration of A. flavus for pathogenicity testing in G. mellonella. The G. mellonella larvae were injected with spores of A. flavus isolate LD-F1 using 10, 102, 103, 104, 105, and 106 spores per larva. (B) Survival of G. mellonella larvae infected with 105 spores/larva of virus-free isolate (LD-F1), AfPV1-infected isolate (LD-F1-b), and AfPV1- and SatRNA-infected isolate (LD-F1-a) over a 120 h incubation period. (C) Histological observation at 48 h post-inoculation among tissues infected with the virus-free isolate (LD-F1), AfPV1-infected isolate (LD-F1-b), and AfPV1- and SatRNA-infected isolate (LD-F1-a), and the HE staining is on top, while the GMS staining is below, and the red arrows indicate hyphae growth. (D) Melanization of larvae infected with the virus-free isolate (LD-F1), AfPV1-infected isolate (LD-F1-b), and AfPV1- and SatRNA-infected isolate (LD-F1-a). Control experiments are comprised of non-treated larvae (UTC), pierced larvae (PC), and PBS-injected larvae (PBS). P-values were estimated using Log rank tests.
FIGURE 7
FIGURE 7
Comparison of virulence in mice of virus-free isolate (LD-F1), AfPV1-infected isolate (LD-F1-b), and AfPV1- and SatRNA-infected isolate (LD-F1-a) by intratracheal injection. (A) Determination of the optimal spore concentration of A. flavus for pathogenicity testing in immunosuppressed mice inoculated with 50 μL spores of A. flavus isolate LD-F1 ranging in concentration from 104, 106 to 108 CFU/mL. (B) Survival of mice inoculated with spores of virus-free isolate (LD-F1), AfPV1-infected isolate (LD-F1-b), and AfPV1- and SatRNA-infected isolate (LD-F1-a) over a 14 days incubation period. (C) Fungal burden in lung tissue over 7 days. (D) Histological observation at 3 days post-inoculation in lung tissue infected with the virus-free isolate (LD-F1), AfPV1-infected isolate (LD-F1-b), and AfPV1- and SatRNA-infected isolate (LD-F1-a), and the HE staining is on top, while the GMS stain is below, and the red arrows indicate hyphae growth. Control experiments are comprised of untouched mice (UTC) and saline buffer injected immunosuppressive mice (Mock). P-values were estimated using Log rank, non-parametric Kruskal–Wallis and Dunn’s multiple comparison tests. *P < 0.05, **P < 0.01, ***P < 0.001.
FIGURE 8
FIGURE 8
Comparisons of virulence in mice of virus-free isolate (LD-F1), AfPV1-infected isolate (LD-F1-b), and AfPV1- and SatRNA-infected isolate (LD-F1-a) by lateral tail vein injection. (A) Determination of the optimal spore concentration of A. flavus for pathogenicity testing in mice and the immunosuppressed mice were infected with 40 μL spores of A. flavus isolate LD-F1 ranging in concentration from 104, 106 to 108 CFU/mL. (B) Survival of mice infected with spores of virus-free isolate (LD-F1), AfPV1-infected isolate (LD-F1-b), and AfPV1- and SatRNA-infected isolate (LD-F1-a) over a 14 days incubation period. (C) Fungal burden in lung, kidney, and liver tissue over 7 days. Control experiments are comprised of untouched mice (UTC) and saline buffer injected immunosuppressive mice (Mock). P-values were estimated using Log rank, non-parametric Kruskal–Wallis and Dunn’s multiple comparison tests. *P < 0.05, **P < 0.01, ***P < 0.001.
FIGURE 9
FIGURE 9
(A) Adherence of conidia of virus-free isolate (LD-F1), AfPV1-infected isolate (LD-F1-b), and AfPV1- and SatRNA-infected isolate (LD-F1-a) to A549 human pneumocyte cells. (B) Conidial killing of virus-free isolate (LD-F1), AfPV1-infected isolate (LD-F1-b), and AfPV1- and SatRNA-infected isolate (LD-F1-a) to at 1 and 3 h phagocytosis by RAW264.7, a murine macrophage cell line. P-values were estimated using Tukey’s multiple comparisons, non-parametric Kruskal–Wallis and Dunn’s multiple comparison tests. *P < 0.05, **P < 0.01, ***P < 0.001.
FIGURE 10
FIGURE 10
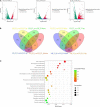
Aspergillus flavus genes that were differentially expressed in response to AfPV1 and Satellite RNA that were identified by RNA-Seq. (A) Volcano plot of RNA-Seq data using Log 2 fold change and Log 10 (padj). X and Y axes represent Log 2 -converted fold change and Log 10 -converted padj. (B) Venn diagrams illustrating the number of genes that were differentially expressed in subsets of the virus-free isolate (LD-F1), AfPV1-infected isolate (LD-F1-b), and AfPV1- and SatRNA-infected isolate (LD-F1-a). (C) Bubble chart for KEGG pathway enrichment analysis of different expression in response to AfPV1 and Satellite RNA.

Similar articles

Cited by

References

    1. Almeida F., Rodrigues M., Coelho C. (2019). The Still Underestimated Problem of Fungal Diseases Worldwide. Front. Microbiol. 10:214. 10.3389/fmicb.2019.00214 - DOI - PMC - PubMed
    1. Amaike S., Keller N. P. (2011). Aspergillus flavus. Annu. Rev. Phytopathol. 49 107–133. - PubMed
    1. Arendrup M. C. (2014). Update on antifungal resistance in Aspergillus and Candida. Clin. Microbiol. Infect. 6 42–48. 10.1111/1469-0691.12513 - DOI - PubMed
    1. Babos P., Kassanis B. (1962). Unstable variants of tobacco necrosis virus. Virology 18 206–211. - PubMed
    1. Bhatti M. F., Jamal A., Petrou M. A., Cairns T. C., Bignell E. M., Coutts R. H. (2011). The effects of dsRNA mycoviruses on growth and murine virulence of Aspergillus fumigatus. Fungal. Genet. Biol. 48 1071–1075. 10.1016/j.fgb.2011.07.008 - DOI - PubMed

LinkOut - more resources