

Bioinformatics analysis of potential Key lncRNA-miRNA-mRNA molecules as prognostic markers and important ceRNA axes in gastric cancer
- PMID: 35693096
- PMCID: PMC9185605
Bioinformatics analysis of potential Key lncRNA-miRNA-mRNA molecules as prognostic markers and important ceRNA axes in gastric cancer
Abstract
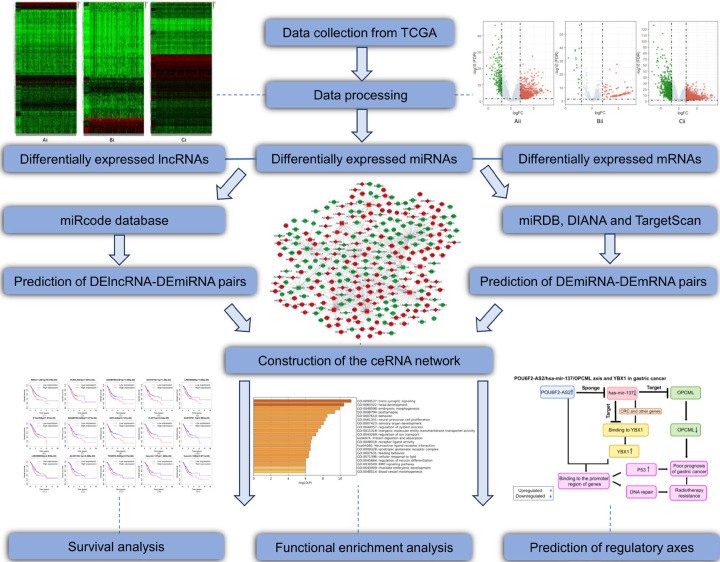
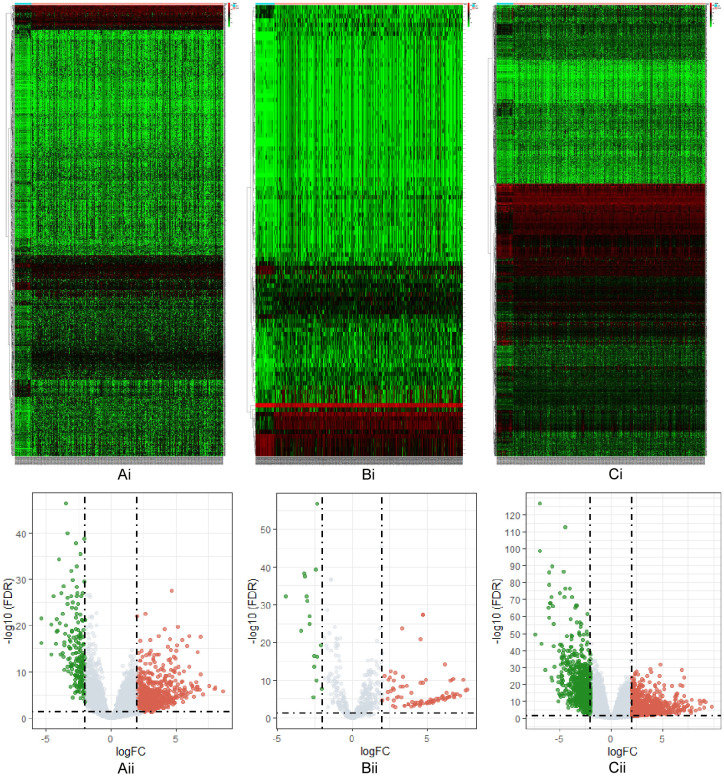
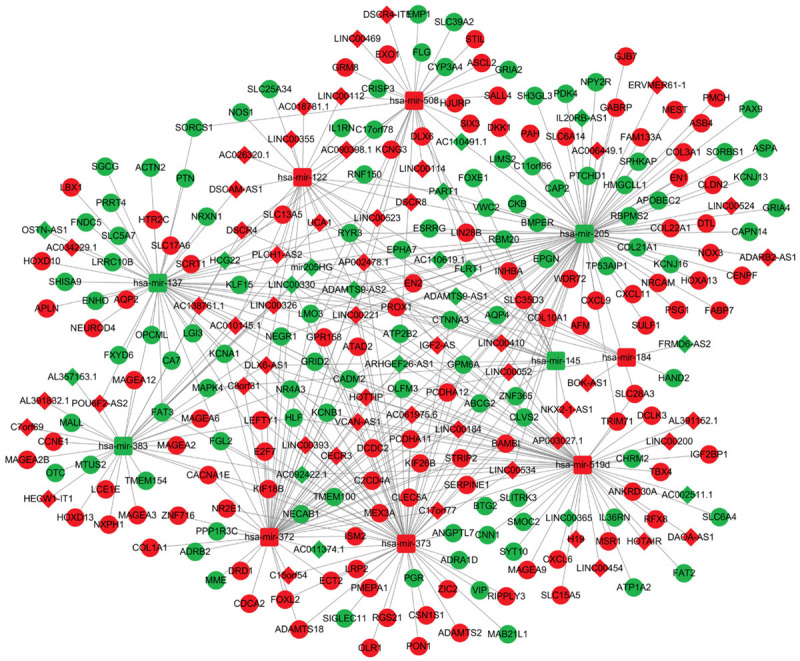
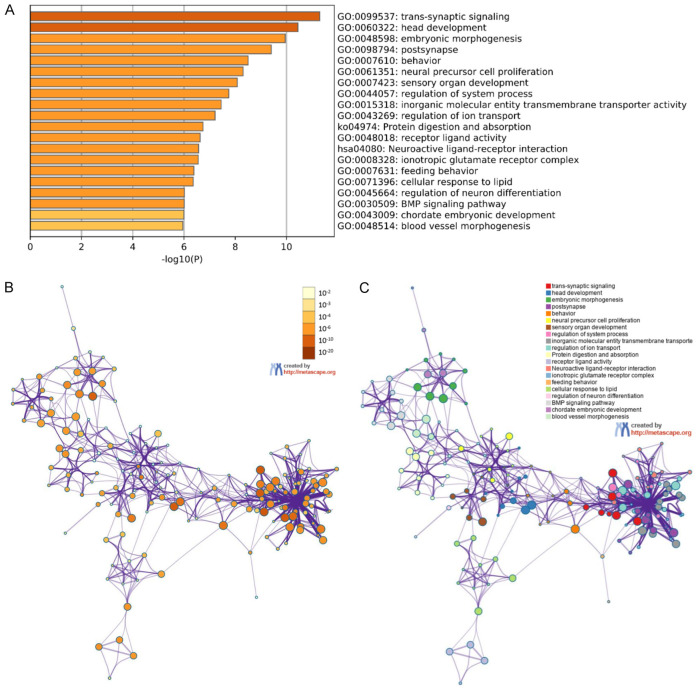
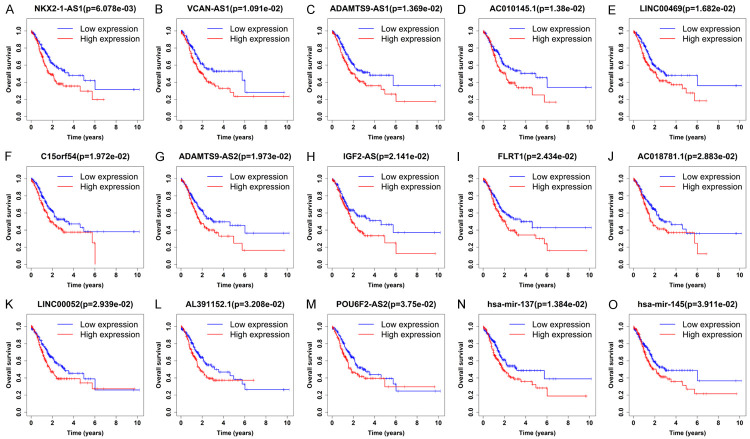
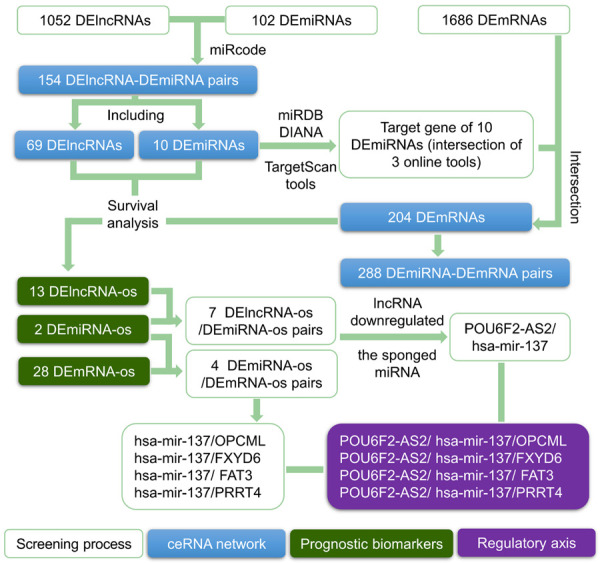
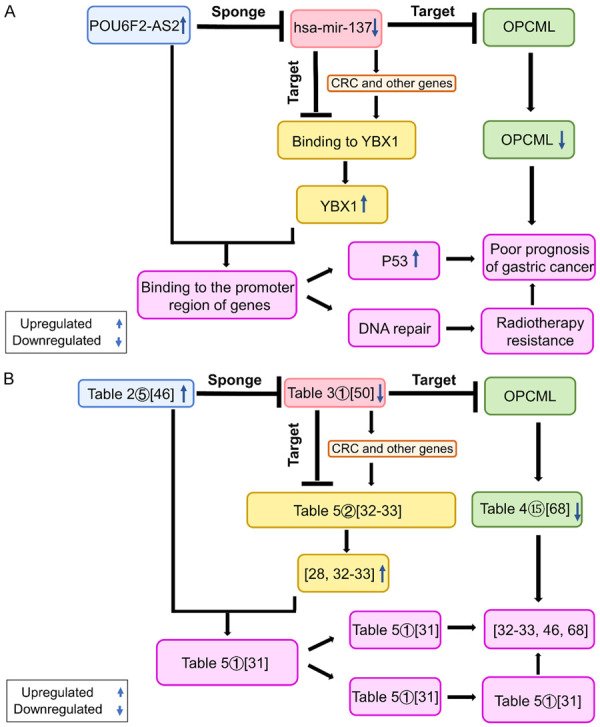
Gastric cancer (GC), the fifth most common malignancy worldwide, has an extremely poor prognosis at the advanced stage or the early stage if inadequately treated. Long noncoding RNAs (lncRNAs), microRNAs (miRNAs) and mRNAs all function as competing endogenous RNAs (ceRNAs) that target and regulate each other. Changes in their expression and their regulatory bioprocesses play important roles in GC. However, the roles of key RNAs and their regulatory networks remain unclear. In this study, RNA profiles were extracted from The Cancer Genome Atlas database, and R language was used to discover the differentially expressed (DE) lncRNAs, miRNAs and mRNAs in GC. Then, the DERNAs were paired by miRcode, miRDB, TargetScan and DIANA, and the ceRNA network was further constructed and visualized using Cytoscape. Moreover, a functional enrichment analysis was performed using Metascape. Afterward, the "survival" package was employed to identify candidate prognostic targets (DERNA-os) in the ceRNA network. Ultimately, the ceRNA network was analyzed to identify crucial lncRNA/miRNA/mRNA axes. Based on 374 gastric adenocarcinoma and gastric adenoma samples, 283 DEceRNAs (69 lncRNAs, 10 miRNAs, and 204 mRNAs) were identified. The 204 mRNAs were significantly enriched in some interesting functional clusters, such as the trans-synaptic signaling cluster and the protein digestion and absorption cluster. The ceRNA network consisted of 43 ceRNAs (13 lncRNAs, 2 miRNAs, and 28 mRNAs) that were related to prognosis. Among them, 2 lncRNAs (LNC00469 and AC010145.1) and 1 mRNA (PRRT4) were potential new biomarkers. In addition, according to the lncRNA/miRNA/mRNA regulatory relationships among the 43 ceRNAs, we identified four axes that might play important roles in the progression of GC and investigated the potential mechanism of the most promising axis (POU6F2-AS2/hsa-mir-137/OPCML) in promoting the proliferation and invasiveness of GC.
Keywords: Gastric cancer; ceRNA; lncRNA; mRNA; miRNA.
AJCR Copyright © 2022.
Conflict of interest statement
None.
Figures
Similar articles
-
Construction and analysis of lncRNA-associated ceRNA network identified potential prognostic biomarker in gastric cancer.Transl Cancer Res. 2019 Aug;8(4):1116-1128. doi: 10.21037/tcr.2019.06.32. Transl Cancer Res. 2019. PMID: 35116854 Free PMC article.
-
Comprehensive analysis of differentially expressed profiles of lncRNAs, mRNAs, and miRNAs in laryngeal squamous cell carcinoma in order to construct a ceRNA network and identify potential biomarkers.J Cell Biochem. 2019 Oct;120(10):17963-17974. doi: 10.1002/jcb.29063. Epub 2019 May 24. J Cell Biochem. 2019. PMID: 31127661
-
Excavating novel diagnostic and prognostic long non-coding RNAs (lncRNAs) for head and neck squamous cell carcinoma: an integrated bioinformatics analysis of competing endogenous RNAs (ceRNAs) and gene co-expression networks.Bioengineered. 2021 Dec;12(2):12821-12838. doi: 10.1080/21655979.2021.2003925. Bioengineered. 2021. PMID: 34898376 Free PMC article.
-
Reconstruction and Analysis of the Differentially Expressed IncRNA-miRNA-mRNA Network Based on Competitive Endogenous RNA in Hepatocellular Carcinoma.Crit Rev Eukaryot Gene Expr. 2019;29(6):539-549. doi: 10.1615/CritRevEukaryotGeneExpr.2019028740. Crit Rev Eukaryot Gene Expr. 2019. PMID: 32422009 Review.
-
Insight into LncRNA- and CircRNA-Mediated CeRNAs: Regulatory Network and Implications in Nasopharyngeal Carcinoma-A Narrative Literature Review.Cancers (Basel). 2022 Sep 20;14(19):4564. doi: 10.3390/cancers14194564. Cancers (Basel). 2022. PMID: 36230487 Free PMC article. Review.
Cited by
-
Screening and identification of hub genes for ischemic cardiomyopathy and construction and validation of a clinical prognosis model using bioinformatics analysis.J Thorac Dis. 2024 Apr 30;16(4):2421-2431. doi: 10.21037/jtd-23-1722. Epub 2024 Apr 2. J Thorac Dis. 2024. PMID: 38738215 Free PMC article.
-
MicroRNAs Associated with IgLON Cell Adhesion Molecule Expression.Curr Issues Mol Biol. 2024 Jul 19;46(7):7702-7718. doi: 10.3390/cimb46070456. Curr Issues Mol Biol. 2024. PMID: 39057097 Free PMC article. Review.
-
Identification of Ultrasound-Sensitive Prognostic Markers of LAML and Construction of Prognostic Risk Model Based on WGCNA.J Oncol. 2023 Feb 10;2023:2353249. doi: 10.1155/2023/2353249. eCollection 2023. J Oncol. 2023. PMID: 36816364 Free PMC article.
-
Identification and validation of an epithelial-mesenchymal transition-related lncRNA pairs prognostic model for gastric cancer.Transl Cancer Res. 2023 May 31;12(5):1196-1209. doi: 10.21037/tcr-22-2751. Epub 2023 Apr 12. Transl Cancer Res. 2023. PMID: 37304549 Free PMC article.
-
Molecular Targets and Mechanisms of Hedyotis diffusa Willd. for Esophageal Adenocarcinoma Treatment Based on Network Pharmacology and Weighted Gene Co-expression Network Analysis.Curr Drug Targets. 2024;25(6):431-443. doi: 10.2174/0113894501265851240102101122. Curr Drug Targets. 2024. PMID: 38213161
References
-
- Sung H, Ferlay J, Siegel RL, Laversanne M, Soerjomataram I, Jemal A, Bray F. Global Cancer statistics 2020: Globocan estimates of incidence and mortality worldwide for 36 cancers in 185 countries. CA Cancer J Clin. 2021;71:209–249. - PubMed
-
- Carninci P, Kasukawa T, Katayama S, Gough J, Frith MC, Maeda N, Oyama R, Ravasi T, Lenhard B, Wells C, Kodzius R, Shimokawa K, Bajic VB, Brenner SE, Batalov S, Forrest AR, Zavolan M, Davis MJ, Wilming LG, Aidinis V, Allen JE, Ambesi-Impiombato A, Apweiler R, Aturaliya RN, Bailey TL, Bansal M, Baxter L, Beisel KW, Bersano T, Bono H, Chalk AM, Chiu KP, Choudhary V, Christoffels A, Clutterbuck DR, Crowe ML, Dalla E, Dalrymple BP, de Bono B, Della Gatta G, di Bernardo D, Down T, Engstrom P, Fagiolini M, Faulkner G, Fletcher CF, Fukushima T, Furuno M, Futaki S, Gariboldi M, Georgii-Hemming P, Gingeras TR, Gojobori T, Green RE, Gustincich S, Harbers M, Hayashi Y, Hensch TK, Hirokawa N, Hill D, Huminiecki L, Iacono M, Ikeo K, Iwama A, Ishikawa T, Jakt M, Kanapin A, Katoh M, Kawasawa Y, Kelso J, Kitamura H, Kitano H, Kollias G, Krishnan SP, Kruger A, Kummerfeld SK, Kurochkin IV, Lareau LF, Lazarevic D, Lipovich L, Liu J, Liuni S, McWilliam S, Madan Babu M, Madera M, Marchionni L, Matsuda H, Matsuzawa S, Miki H, Mignone F, Miyake S, Morris K, Mottagui-Tabar S, Mulder N, Nakano N, Nakauchi H, Ng P, Nilsson R, Nishiguchi S, Nishikawa S, Nori F, Ohara O, Okazaki Y, Orlando V, Pang KC, Pavan WJ, Pavesi G, Pesole G, Petrovsky N, Piazza S, Reed J, Reid JF, Ring BZ, Ringwald M, Rost B, Ruan Y, Salzberg SL, Sandelin A, Schneider C, Schönbach C, Sekiguchi K, Semple CA, Seno S, Sessa L, Sheng Y, Shibata Y, Shimada H, Shimada K, Silva D, Sinclair B, Sperling S, Stupka E, Sugiura K, Sultana R, Takenaka Y, Taki K, Tammoja K, Tan SL, Tang S, Taylor MS, Tegner J, Teichmann SA, Ueda HR, van Nimwegen E, Verardo R, Wei CL, Yagi K, Yamanishi H, Zabarovsky E, Zhu S, Zimmer A, Hide W, Bult C, Grimmond SM, Teasdale RD, Liu ET, Brusic V, Quackenbush J, Wahlestedt C, Mattick JS, Hume DA, Kai C, Sasaki D, Tomaru Y, Fukuda S, Kanamori-Katayama M, Suzuki M, Aoki J, Arakawa T, Iida J, Imamura K, Itoh M, Kato T, Kawaji H, Kawagashira N, Kawashima T, Kojima M, Kondo S, Konno H, Nakano K, Ninomiya N, Nishio T, Okada M, Plessy C, Shibata K, Shiraki T, Suzuki S, Tagami M, Waki K, Watahiki A, Okamura-Oho Y, Suzuki H, Kawai J, Hayashizaki Y. The transcriptional landscape of the mammalian genome. Science. 2005;309:1559–1563. - PubMed
-
- Djebali S, Davis CA, Merkel A, Dobin A, Lassmann T, Mortazavi A, Tanzer A, Lagarde J, Lin W, Schlesinger F, Xue C, Marinov GK, Khatun J, Williams BA, Zaleski C, Rozowsky J, Röder M, Kokocinski F, Abdelhamid RF, Alioto T, Antoshechkin I, Baer MT, Bar NS, Batut P, Bell K, Bell I, Chakrabortty S, Chen X, Chrast J, Curado J, Derrien T, Drenkow J, Dumais E, Dumais J, Duttagupta R, Falconnet E, Fastuca M, Fejes-Toth K, Ferreira P, Foissac S, Fullwood MJ, Gao H, Gonzalez D, Gordon A, Gunawardena H, Howald C, Jha S, Johnson R, Kapranov P, King B, Kingswood C, Luo OJ, Park E, Persaud K, Preall JB, Ribeca P, Risk B, Robyr D, Sammeth M, Schaffer L, See LH, Shahab A, Skancke J, Suzuki AM, Takahashi H, Tilgner H, Trout D, Walters N, Wang H, Wrobel J, Yu Y, Ruan X, Hayashizaki Y, Harrow J, Gerstein M, Hubbard T, Reymond A, Antonarakis SE, Hannon G, Giddings MC, Ruan Y, Wold B, Carninci P, Guigó R, Gingeras TR. Landscape of transcription in human cells. Nature. 2012;489:101–108. - PMC - PubMed
LinkOut - more resources
Full Text Sources
Miscellaneous