. 2022 May 24;23(11):5890.
doi: 10.3390/ijms23115890.

The Multidirectional Effect of Azelastine Hydrochloride on Cervical Cancer Cells

Affiliations

The Multidirectional Effect of Azelastine Hydrochloride on Cervical Cancer Cells

Ewa Trybus et al. Int J Mol Sci. .

Abstract

A major cause of cancer cell resistance to chemotherapeutics is the blocking of apoptosis and induction of autophagy in the context of cell adaptation and survival. Therefore, new compounds are being sought, also among drugs that are commonly used in other therapies. Due to the involvement of histamine in the regulation of processes occurring during the development of many types of cancer, antihistamines are now receiving special attention. Our study concerned the identification of new mechanisms of action of azelastine hydrochloride, used in antiallergic treatment. The study was performed on HeLa cells treated with different concentrations of azelastine (15-90 µM). Cell cycle, level of autophagy (LC3 protein activity) and apoptosis (annexin V assay), activity of caspase 3/7, anti-apoptotic protein of Bcl-2 family, ROS concentration, measurement of mitochondrial membrane potential (Δψm), and level of phosphorylated H2A.X in response to DSB were evaluated by cytometric method. Cellular changes were also demonstrated at the level of transmission electron microscopy and optical and fluorescence microscopy. Lysosomal enzyme activities-cathepsin D and L and cell viability (MTT assay) were assessed spectrophotometrically. Results: Azelastine in concentrations of 15-25 µM induced degradation processes, vacuolization, increase in cathepsin D and L activity, and LC3 protein activation. By increasing ROS, it also caused DNA damage and blocked cells in the S phase of the cell cycle. At the concentrations of 45-90 µM, azelastine clearly promoted apoptosis by activation of caspase 3/7 and inactivation of Bcl-2 protein. Fragmentation of cell nucleus was confirmed by DAPI staining. Changes were also found in the endoplasmic reticulum and mitochondria, whose damage was confirmed by staining with rhodamine 123 and in the MTT test. Azelastine decreased the mitotic index and induced mitotic catastrophe. Studies demonstrated the multidirectional effects of azelastine on HeLa cells, including anti-proliferative, cytotoxic, autophagic, and apoptotic properties, which were the predominant mechanism of death. The revealed novel properties of azelastine may be practically used in anti-cancer therapy in the future.

Keywords: apoptosis; autophagy; azelastine; mitotic catastrophe; oxidative stress.


Conflict of interest statement

The authors declare no conflict of interest.

Figures

Figure 1
Figure 1
Proapoptotic effects of azelastine hydrochloride. Control cells and treated for 48 h with azelastine at concentrations of 15 µM, 25 µM, 45 µM, 60 µM, and 90 µM. (A) Level of apoptosis determined by annexin V-PE/ 7-AAD staining. Live cells (annexin V-PE−/7-AAD−), cells in early (annexin V-PE+/7-AAD−) and late-stage apoptosis (annexin V-PE+/7-AAD+), and necrotic cells (V-PE−/7-AAD+). (B) Changes in 3/7 caspase activity. Live cells (caspase 3/7-/7-AAD−), cells in early (caspase 3/7+/7-AAD−) and late apoptosis (caspase 3/7+/7-AAD+), dead cells (caspase 3/7-/7-AAD+). (C) Percentage of apoptotic cells dependent on azelastine concentration. (D) Cell viability as determined by the MTT assay. (E) Changes in nuclei of cells labeled with 4′,6-diamidino-2-phenylindole (DAPI). Control cells showing normal cell nuclei morphology. Cells treated with azelastine showing changes typical of apoptosis, i.e., marked condensation of chromatin and fragmentation of cell nucleus. Images were taken at 4000× magnification. Data representative of three parallel experiments correspond to mean values ± standard error (SE). Differences were statistically confirmed at: *** p < 0.001.
Figure 2
Figure 2
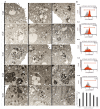
Changes in mitochondria, induction of oxidative stress, and endoplasmic reticulum stress in HeLa cells caused by the action of azelastine hydrochloride. Control cells (A1). Azelastine concentration-dependent ultrastructural changes indicative of apoptosis (A26a); brightening of the matrix and irregular arrangement of cristae in the mitochondria of cells subjected to the 15 µM concentration (2); at 25 µM, visible enlarged mitochondria with reduction of mitochondrial cristae remaining in close proximity to the dilated channels of the rough endoplasmic reticulum (3,3a); at a concentration of 45 µM, mitochondria with enhanced damage characteristics are present, i.e., strongly enlarged with disruption of the mitochondrial membrane (4) and damaged mitochondrial cristae (4a) and altered rough endoplasmic reticulum in the form of dilated channels (4,4a); at concentrations of 60 µM (5,5a) and 90 µM (6,6a), visible mitochondria with severe disorganization of the structure indicating damage, and rough endoplasmic reticulum located in their vicinity with strongly enlarged and swollen cisterns. Explanation of abbreviations: N—nucleus, M—mitochondria, AG—Golgi apparatus, RER—rough endoplasmic reticulum, AV—autophagic vacuoles, Lp—primary lysosomes, Ls—secondary lysosomes. Images were taken at 11,500× magnification. (B) Gradual and azelastine concentration-dependent loss of green fluorescence derived from rhodamine 123-labeled mitochondria. (C) Generation of reactive oxygen species and (D) percentage of ROS (+) cells as a result of azelastine. (E) Changes of mitochondrial membrane potential (Δψm) and the percentage of cells with mitochondrial membrane depolarization (F) at different azelastine concentrations. Each sample was analyzed in triplicate. The differences were statistically confirmed at: *** p < 0.001.
Figure 3
Figure 3
Bcl-2 protein inactivation and DNA damage demonstrated in cells exposed to 48 h action of azelastine hydrochloride. (A) Cells expressing Bcl-2 are clustered in the top two quadrants of the dot plot (inactivated and activated). Over 60% are dephosphorylated after treatment with azelastine at 60 µM and 90 µM, confirming inactivation of the Bcl-2 signaling pathway. (B) Azelastine at concentrations of 15–90 µM generates DNA damage that induces DNA repair mechanisms such as ɣH2AX. (C) Azelastine concentration-dependent percentage of cells with double-stranded DNA damage and (D) percentage of cells with Bcl-2 protein inactivation. Data representative of three parallel experiments correspond to mean values ± standard error (SE). Differences were statistically confirmed at: *** p < 0.001.
Figure 4
Figure 4
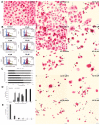
Morphological changes indicating the induction of vacuolating and apoptotic changes and a decrease in the dividing capacity of Hela cells as a consequence of 48 h treatment with azelastine hydrochloride. (A1) Control cells with normal morphology, including interphase cells and cells with multiple mitotic figures. (A26a) Cells treated with azelastine at concentrations of 15–90 µM; (A23a) cells with numerous vacuolization changes in the cytoplasm, strongly eosinophilic material is visible within the vacuoles, which is destined for degradation, indicating the process of autophagy; (A4,4a) cells with intensive cytoplasmic vacuolization and a pyknotic cell nucleus with visible partial chromatin condensation; (56a) strong pro-apoptotic effect of azelastine at concentrations of 60 µM and 90 µM, expressed by the presence of numerous apoptotic cells and cells with efferocytosis. Explanation of markings: 1—interphase, 2—prophase, 3—prometaphase, 4—metaphase, 5—telophase, 6—cytokinesis, 7—vacuolization of cytoplasm, 8—vacuoles with visible digestion material, 9—apoptotic cells, 10—binucleated cells in apoptosis, 1—-binucleated cells with vacuolization, 12—giant cells, 13—abnormal segregation of chromosomes, 14—multinucleated cells in apoptosis, 15—cells with features of vacuolization and apoptosis, 16—multinucleated cells with vacuolization, 17—efferocytosis, 18—cells with phagocytosed material (by efferocytosis), which were directed toward the apoptotic pathway. Hematoxylin and eosin staining. Images were taken at 4000× magnification. (B) Cell cycle changes of HeLa line cells treated for 48 h with azelastine at concentrations of 15–90 µM analyzed by flow cytometry. (C) Percentage of cells in different phases of the cell cycle indicating blocking of cells in S phase. (D) Azelastine concentration-dependent number of vacuolated and apoptotic cells; at concentrations of 15–25 µM, azelastine induced vacuolization changes; at a concentration of 45 µM, there was a reduction in vacuolization changes in favor of apoptotic cells, while at concentrations of 60–90 µM, azelastine promoted apoptosis. (E) Changes in the mitotic index indicating an inhibition of the dividing capacity of azelastine. Average values from three independent experiments. The differences were statistically confirmed at: *** p < 0.001.
Figure 5
Figure 5
Morphological markers of mitotic catastrophe induced in HeLa cells exposed to 48 h treatment of azelastine hydrochloride. (A) Intensified changes (multipolar mitosis, micronucleation, and multinucleation) in cells treated with 15 µM azelastine. Explanation of markings: 1—cells with vacuolization, 2—binucleated cells with vacuolization, 3—apoptotic giant cell, 4—multinucleated cells with vacuolization, 5—tripolar metaphase, 6—apoptotic cells, 7—cells with micronuclei, 8—anaphase bridges, 9—multinucleated cells with micronuclei, 10—efferocytosis, 11—pentapolar anaphase, 12—giant cells, 13—binucleated cells in apoptosis, 14—multinucleated cells in apoptosis, 15—giant cells with vacuolization and micronuclei. Hematoxylin and eosin staining. Images were taken at a magnification of 4000×. (B) Distribution of cells with micronuclei, bi-, multinucleated cells, and giant cells at different concentrations of azelastine 15–90 µM. Azelastine concentration-dependent induction of vacuolization (C) and apoptotic (D) changes in bi-, multinucleated, and giant cells. Average values from three independent experiments. The differences were statistically confirmed at: * p < 0.05, ** p < 0.01, *** p < 0.001.
Figure 6
Figure 6
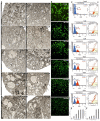
The intensification of degradation processes in HeLa cells with azelastine hydrochloride. (A) Ultrastructural changes; (11b) in the cytoplasm of cells very numerous autophagic vacuoles filled with material at various stages of degradation can be seen, and an extensive Golgi apparatus and dilated channels of the rough endoplasmic reticulum; (22b) clear changes in cells indicating a progressive degradation process, i.e., multiple vacuoles at different stages of digestion; (33b), the image shows vacuoles differentiated in terms of shape, covering large areas of the cytosol, indicating intensive degradation; (45b) dominant changes in the form of numerous primary and secondary lysosomes and changes at the level of the cell nucleus (local chromatin condensation, enlarged nuclear envelope and fragmentation). The changes obtained in the concentrations of 60 µM and 90 µM of azelastine indicate a progressive degradation as well as the initiation of cell death by apoptosis. (B) Histograms of cells indicating azelastine-induced autophagy as manifested by an increase in fluorochrome fluorescence intensity (red area) indicating LC3 protein activation. In the concentration range of 45–90 µM, the fluorescence intensity decreased, which argued for a switch of autophagy to apoptosis. Cells were stained with anti-LC3/Alexa Fluor® 555 conjugated antibody and the fluorescence intensity was measured cytometrically. (C) Changes in cathepsin D and L activities (mean ± SE) in the lysosomal fraction of HeLa cells after 48 h of exposure to different concentrations of azelastine. Results are the average of three independent experiments. Differences were statistically confirmed at: * p < 0.05, ** p < 0.01, *** p < 0.001.

Similar articles

Cited by

References

    1. Matsumoto N., Ebihara M., Oishi S., Fujimoto Y., Okada T., Imamura T. Histamine H1 receptor antagonists selectively kill cisplatin-resistant human cancer cells. Sci. Rep. 2021;11:1492. doi: 10.1038/s41598-021-81077-y. - DOI - PMC - PubMed
    1. Chang A. Chemotherapy, chemoresistance and the changing treatment landscape for NSCLC. Lung Cancer. 2011;71:3–10. doi: 10.1016/j.lungcan.2010.08.022. - DOI - PubMed
    1. Xia J., Yu X., Song X., Li G., Mao X., Zhang Y. Inhibiting the cytoplasmic location of HMGB1 reverses cisplatin resistance in human cervical cancer cells. Mol. Med. Rep. 2017;15:488–494. doi: 10.3892/mmr.2016.6003. - DOI - PubMed
    1. Chang H., Zou Z. Targeting autophagy to overcome drug resistance: Further developments. J. Hematol. Oncol. 2020;13:159. doi: 10.1186/s13045-020-01000-2. - DOI - PMC - PubMed
    1. Ellegaard A.M., Dehlendorff C., Vind A.C., Anand A., Cederkvist L., Petersen N.H.T., Nylandsted J., Stenvang J., Mellemgaard A., Osterlind K., et al. Repurposing Cationic Amphiphilic Antihistamines for Cancer Treatment. EBioMedicine. 2016;9:130–139. doi: 10.1016/j.ebiom.2016.06.013. - DOI - PMC - PubMed