. 2022 May 28;11(11):1773.
doi: 10.3390/cells11111773.

The Extracellular Matrix Proteins Tenascin-C and Tenascin-R Retard Oligodendrocyte Precursor Maturation and Myelin Regeneration in a Cuprizone-Induced Long-Term Demyelination Animal Model

Affiliations

The Extracellular Matrix Proteins Tenascin-C and Tenascin-R Retard Oligodendrocyte Precursor Maturation and Myelin Regeneration in a Cuprizone-Induced Long-Term Demyelination Animal Model

Juliane Bauch et al. Cells. .

Abstract

Oligodendrocytes are the myelinating cells of the central nervous system. The physiological importance of oligodendrocytes is highlighted by diseases such as multiple sclerosis, in which the myelin sheaths are degraded and the axonal signal transmission is compromised. In a healthy brain, spontaneous remyelination is rare, and newly formed myelin sheaths are thinner and shorter than the former ones. The myelination process requires the migration, proliferation, and differentiation of oligodendrocyte precursor cells (OPCs) and is influenced by proteins of the extracellular matrix (ECM), which consists of a network of glycoproteins and proteoglycans. In particular, the glycoprotein tenascin-C (Tnc) has an inhibitory effect on the differentiation of OPCs and the remyelination efficiency of oligodendrocytes. The structurally similar tenascin-R (Tnr) exerts an inhibitory influence on the formation of myelin membranes in vitro. When Tnc knockout oligodendrocytes were applied to an in vitro myelination assay using artificial fibers, a higher number of sheaths per single cell were obtained compared to the wild-type control. This effect was enhanced by adding brain-derived neurotrophic factor (BDNF) to the culture system. Tnr-/- oligodendrocytes behaved differently in that the number of formed sheaths per single cell was decreased, indicating that Tnr supports the differentiation of OPCs. In order to study the functions of tenascin proteins in vivo Tnc-/- and Tnr-/- mice were exposed to Cuprizone-induced demyelination for a period of 10 weeks. Both Tnc-/- and Tnr-/- mouse knockout lines displayed a significant increase in the regenerating myelin sheath thickness after Cuprizone treatment. Furthermore, in the absence of either tenascin, the number of OPCs was increased. These results suggest that the fine-tuning of myelin regeneration is regulated by the major tenascin proteins of the CNS.

Keywords: cuprizone; myelin; myelin lesion; oligodendrocyte; tenascin-C; tenascin-R.


Conflict of interest statement

The authors declare that the research was conducted in the absence of any commercial or financial relationships that could be constructed as a potential conflict of interest.

Figures

Figure 1
Figure 1
Tnc retards whereas Tnr and BDNF promote myelination by OPCs in an artificial fiber assay. (A) OPCs from P6–P9 mice from 129/SV wild-type, Tnc−/− and Tnr−/− mice were prepared via immunopanning and cultivated for 7 div. OPCs were seeded on artificial fibers and cultivated for 14 div. Exemplary photomicrographs of artificial poly-L-lactic acid electrospun microfibres with OPCs in myelination medium for 14 div are shown (B) Immunocytochemical staining was performed with antibodies against GFAP (to exclude astrocytes) and MBP (green, to determine myelin). Scale bar: 50 µm. To determine the myelination degree in the different conditions the average sheath length of fibers per single cell (C,E) and the number of sheaths per single cell (D,F) were determined. In a pilot study, BDNF was added to Tnc−/− and Tnr−/− OPCs to analyze its impact on myelination (E,F). A minimum of 35 single cells in 3 independent experiments were analyzed (n = 35, N = 3). For statistical analysis, the unpaired two-tailed student’s test was used (p ≤ 0.01 **, p ≤ 0.001 ***).
Figure 2
Figure 2
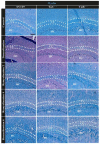
LFB-PAS staining for comparing myelin in the corpus callosum of 129/SV-wildtype, Tnc−/− and Tnr−/− mice under control, demyelination, and remyelination conditions. Cryosection of 129/SV wild-type, Tnc−/− and Tnr−/− mouse brains were immunohistochemically stained with LFB-PAS in control (C), demyelination (DM), and 2-, 4- and 6 weeks of remyelination (RM2, RM4, and RM6) condition. Myelin was stained blue with LFB, and axons were stained pink via PAS. After 10-weeks of cuprizone administration the blue staining was strongly reduced, indicating efficient removal of myelin. Blue labeled recovered progressively with myelin regeneration, axons were labeled in pink. Cuprizone-induced demyelination as well as remyelination after withdrawal was obvious for the three genotypes. Scale bar 200 µm (N = 1, n ≤ 2).
Figure 3
Figure 3
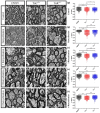
Electron microscopy reveals increased remyelination in Tnc−/− and Tnr−/− mice. Eight-to-ten-week-old male mice received either a normal diet as untreated control or a 0.2% cuprizone diet to induce demyelination (at). After 10 weeks mice were either perfused or received a normal diet for 2, 4, or 6 further weeks to allow for remyelination after withdrawal. Cryosections of the corpora callosa (CC) above the hippocampus as an orientation point (HC) from 129/SV, Tnc−/− and Tnr−/− brains were collected, processed for electron microscopy and the myelin thickness was determined (at). Scale bar: 1 µm. The results confirmed the cuprizone-induced demyelination (df), although the demyelination in Tnc−/− and Tnr−/− mice appeared significantly weaker (p). In the untreated control condition (ac,p) thicker myelin membranes were observable in Tnc−/− and Tnr−/− mice as indicated by g-ratios. Furthermore, Tnc−/− and Tnr−/− mice displayed more efficient remyelination at each timepoint (go,rt). For statistical analysis, the unpaired two-tailed student’s test (p ≤ 0.05 *, p ≤ 0.01 **, p ≤ 0.001 ***) was used. Axon diameters seemed smaller in Tnc−/− and Tnr−/− mice. Statistical comparison of the individual groups was carried out with the ANOVA test and Tuckey’s multiple comparison test. (N = 3, n ≤ 594).
Figure 4
Figure 4
Axon diameter variability of the three genotypes does not seem to have a big influence on the myelination processes. Axon diameter of 129/SV, Tnc−/− and Tnr−/− electron microscopy sections of the five different conditions control (C), demyelination (DM), and 2-, 4- and 6 weeks of remyelination (RM2, RM4, and RM6) were analyzed (A). In the untreated control condition only in Tnr−/− mice the axon diameter of the cells was significantly larger than in wildtype mice. Interestingly, during demyelination the determined axon diameters of both Tnc−/− and Tnr−/− mice were significantly lower than in wildtype mice. (BF) The best fit lines were also obtained by linear regression and differed significantly between Tnr−/− and wildtype mice in each treatment condition. Statistical analysis was carried out by using the ANOVA and Tukey’s multiple comparison test (p ≤ 0.05 *, p ≤ 0.01 **, p ≤ 0.001 ***). (N = 3, n ≤ 594).
Figure 5
Figure 5
Differential maturation of oligodendrocytes in Tnc−/− and Tnr−/− genotypes after cuprizone treatment. (A(ao)) Sagittal sections of 129/SV, Tnc−/− and Tnr−/− mice treated with cuprizone were immunohistochemically stained with antibodies against CC1 (green) and Olig2 (red) in the five different conditions, control (C), demyelination (DM), 2-, 4- and 6 weeks of remyelination (RM2, RM4, and RM6). Hoechst was used as a marker for cell nuclei (blue). Images show the caudal part of the corpus callosum (CC) above the hippocampus (HC), circle triangle squares show a better visualization of the cells. Fewer oligodendrocytes were detected in Tnr−/− condition in comparison to the 129/SV wildtype and the Tnc−/− genotype (A(ac),B). CC1 staining was reduced by cuprizone treatment and recovered after 2, 4 and 6 weeks of remyelination (A(do)). In the early stage of demyelination after 2 weeks, lowest number of oligodendrocytes was detected in Tnc−/− mice, and the highest number of immature oligodendrocytes was detected in 129/SV wildtype mice (A(gi),C). RT-PCR analysis of MBP expression revealed a higher myelin expression in both knockouts at the earliest (2 weeks) and latest (6 weeks) stages of recovery, reflecting a more extensive remyelination in Tnc−/− and Tnr−/− mice (D). Data are presented as mean ± SEM and statistical significance (p ≤ 0.05 *, p ≤ 0.01 **, p ≤ 0.001 ***) was assessed using the ANOVA and Tukey’s multiple comparison test (control, demyelinated, remyelinated). Four animals were used for each group and genotype (N = 4).
Figure 6
Figure 6
Differential recruitment of oligodendrocyte precursor cells (OPCs) in the Tnr−/− and Tnc−/− genotypes. (A(ao)) Sagittal sections of 129/SV, Tnc−/− and Tnr−/− mice exposed to cuprizone were immunohistochemically stained with an antibody against PDGFRα (red) in the conditions, control (C), demyelination (DM), 2-, 4- and 6 weeks of remyelination (RM2, RM4 and RM6). Hoechst was used as a marker for cell nuclei (blue). Images show the caudal part of the corpus callosum (CC) above the hippocampus (HC), circle triangle squares show a better visualization of the cells. Both, Tnc and Tnr knockout leads to a significant increase of OPCs in the control condition (A(ac),B) and during demyelination (A(df),B). This effect was also observable in the early stage of recovery, after 2 weeks of remyelination (A(gh),B). However, with ongoing duration of remyelination, no differences between the several genotypes were observable and determinable. Additionally, RT-PCR analysis for the determination of the PDGFRα expression in the three different genotypes in the five different conditions was performed (C). The results revealed a significantly higher PDGFRα expression during remyelination stages in Tnc−/− mice, indicating that Tnc impairs the OPC maturation in general. Data are presented as mean ± SEM and statistical significance (p ≤ 0.05 *, p ≤ 0.01 **, p ≤ 0.001 ***) was assessed using the ANOVA and Tukey’s multiple comparison test (control, demyelinated, remyelinated). Four independent experiments were performed (N = 4).
Figure 7
Figure 7
Reactivity of astrocytes in the lesion territory. (A(ao)) Sagittal sections of the three different genotypes 129/SV, Tnc−/−, and Tnr−/− mice in the cuprizone model were immunocytochemically stained with antibodies against GFAP (green) as a marker for astrocytes and Olig2 (red) as a marker for oligodendrocytes. Hoechst dye served as a marker for cell nuclei (blue). Five different conditions were analyzed: control (C), demyelination (DM), 2-, 4- and 6 weeks of remyelination (RM2, RM4 and RM6). Images show the caudal part of the corpus callosum (CC) above the hippocampus (HC), circle triangle squares show a better visualization of the cells. In untreated control conditions, the number of astrocytes was significantly decreased in both knockout (Tnc−/− and Tnr−/−) mice (A(ac),B). During demyelination and the early stage of recovery, after 2 weeks of withdrawal of cuprizone treatment, in Tnc−/− significantly more astrocytes were detectable in comparison to the wildtype mice and untreated control condition (A(ai),B). Otherwise, no significant differences between the three genotypes were visible (A(jo),B). Data are presented as mean ± SEM and statistical significance (p ≤ 0.05 *, p ≤ 0.01 **, p ≤ 0.001 ***) was assessed using the ANOVA and Tukey’s multiple comparison test (control, demyelinated, remyelinated). Four independent experiments were performed (N = 4).
Figure 8
Figure 8
Activation of microglia upon cuprizone treatment. (A(ao)) Sagittal sections of cuprizone-treated mice were immunohistochemically stained with an antibody against Iba1 to detect microglia (red color). Hoechst was used as a marker for cell nuclei. Five different conditions were analyzed: control (C), demyelination (DM), 2-, 4- and 6 weeks of remyelination (RM2, RM4 and RM6). Images show the caudal part of the corpus callosum (CC) above the hippocampus (HC), circle triangle squares show a better visualization of the cells. Significantly more Iba1 positive cells were detected in Tnc−/− and Tnr−/− mice (A(ac),B). During demyelination, the number of Iba1 positive cells was strongly increased in comparison to the control and in the absence of Tnr the number of microglia was significantly increased (A(df),B). After 2 weeks of remyelination the number of Iba1 positive cells was decreased in Tnc−/− mice (A(gi),B). This effect contrasts with the results of the latest stage of remyelination after 6 weeks where the number of Iba1 positive cells was significantly increased in Tnc−/− mice (A(mo),B). RT-PCR analysis of CD68 to monitor the expression pattern of activated microglia was carried out. In the absence of Tnr, more activated microglia were present in the control condition (A(ac),C). In contrast, the CD68 expression during demyelination seemed reduced in Tnr−/− (A(df),C). In the absence of Tnr the expression of CD68 was limited and even during demyelination and the first two remyelination stages (2 and 4 weeks) the expression increased only minimally (A(go),C). After 6 weeks of remyelination, the highest CD68 expression was measured in Tnc−/−. Data are presented as mean ± SEM and statistical significance (p ≤ 0.05 *, p ≤ 0.01 **, p ≤ 0.001 ***) was assessed using the ANOVA and Tukey’s multiple comparison test for each group (control, demyelinated, remyelinated). Four independent experiments were performed (N = 4).

Similar articles

Cited by

References

    1. Bradl M., Lassmann H. Oligodendrocytes: Biology and pathology. Acta Neuropathol. 2010;119:37–53. doi: 10.1007/s00401-009-0601-5. - DOI - PMC - PubMed
    1. Barateiro A., Fernandes A. Temporal oligodendrocyte lineage progression: In vitro models of proliferation, differentiation and myelination. Biochim. Biophys. Acta. 2014;1843:1917–1929. doi: 10.1016/j.bbamcr.2014.04.018. - DOI - PubMed
    1. Goldman S.A., Kuypers N.J. How to make an oligodendrocyte. Development. 2015;142:3983–3995. doi: 10.1242/dev.126409. - DOI - PMC - PubMed
    1. Miron V.E., Kuhlmann T., Antel J.P. Cells of the oligodendroglial lineage, myelination, and remyelination. Biochim. Biophys. Acta. 2011;1812:184–193. doi: 10.1016/j.bbadis.2010.09.010. - DOI - PubMed
    1. Nave K.A. Myelination and support of axonal integrity by glia. Nature. 2010;468:244–252. doi: 10.1038/nature09614. - DOI - PubMed

Publication types

Grants and funding

The work was funded by the German Research Foundation (DFG, FA 159/24-1, grant Nr. 407698736 to AF). We acknowledge support from the DFG Open Access Publication Funds of the Ruhr-Universität Bochum.