

Different Methods for Evaluating Microglial Activation Using Anti-Ionized Calcium-Binding Adaptor Protein-1 Immunohistochemistry in the Cuprizone Model
- PMID: 35681418
- PMCID: PMC9179561
- DOI: 10.3390/cells11111723
Different Methods for Evaluating Microglial Activation Using Anti-Ionized Calcium-Binding Adaptor Protein-1 Immunohistochemistry in the Cuprizone Model
Abstract
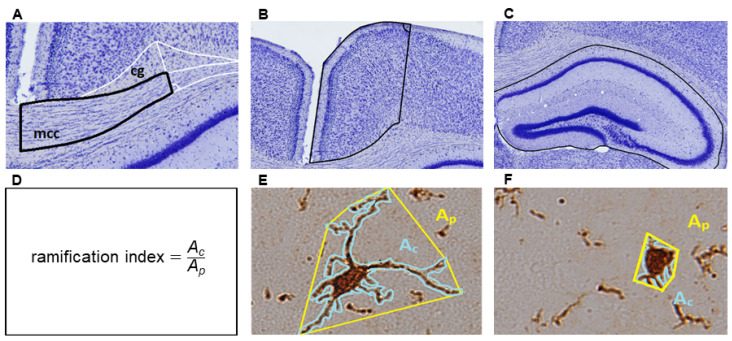
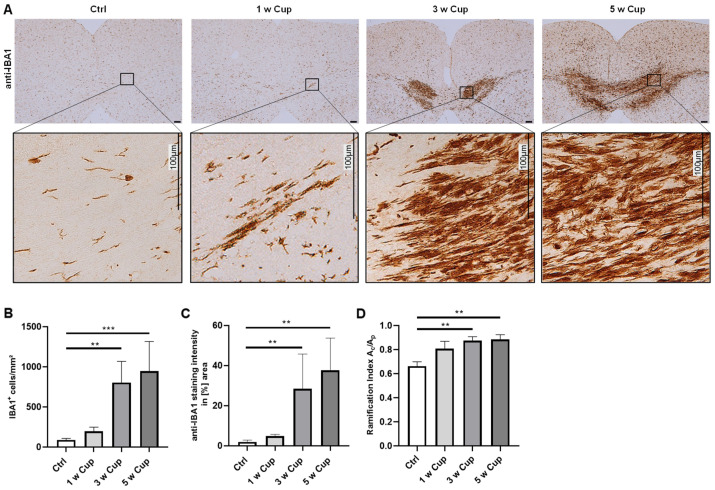
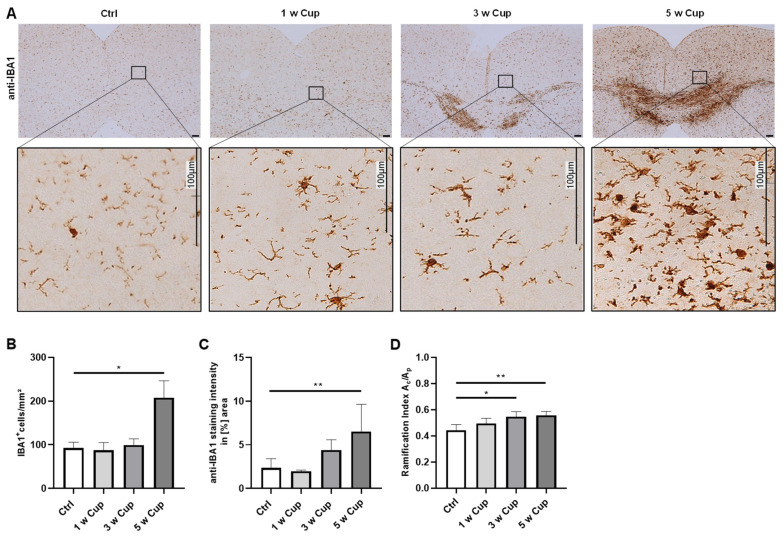
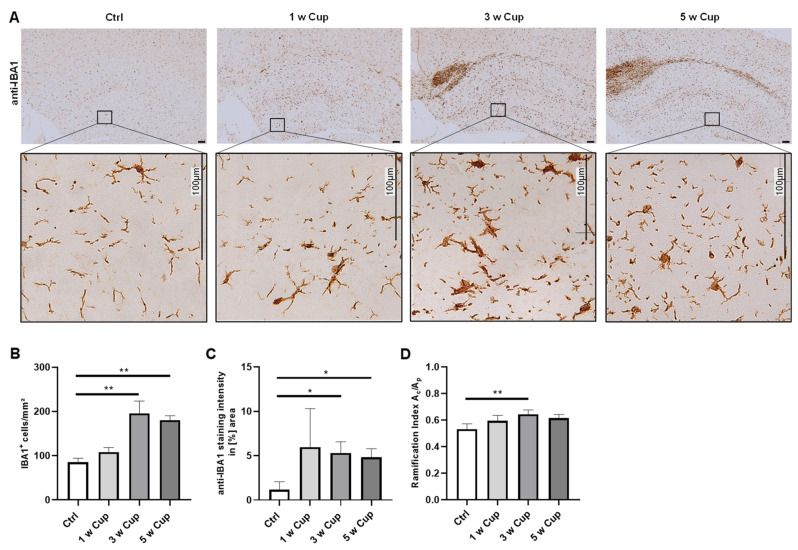
Microglia play an important role in the pathology of various central nervous system disorders, including multiple sclerosis (MS). While different methods exist to evaluate the extent of microglia activation, comparative studies investigating the sensitivity of these methods are missing for most models. In this study, we systematically evaluated which of the three commonly used histological methods (id est, quantification of microglia density, densitometrically evaluated staining intensity, or cellular morphology based on the determination of a ramification index, all measured in anti-ionized calcium-binding adaptor protein-1 (IBA1) immunohistochemical stains) is the most sensitive method to detect subtle changes in the microglia activation status in the context of MS. To this end, we used the toxin-induced cuprizone model which allows the experimental induction of a highly reproducible demyelination in several central nervous system regions, paralleled by early microglia activation. In this study, we showed that after 3 weeks of cuprizone intoxication, all methods reveal a significant microglia activation in the white matter corpus callosum. In contrast, in the affected neocortical grey matter, the evaluation of anti-IBA1 cell morphologies was the most sensitive method to detect subtle changes of microglial activation. The results of this study provide a useful guide for future immunohistochemical evaluations in the cuprizone and other neurodegenerative models.
Keywords: IBA1; cuprizone model; microglia; multiple sclerosis.
Conflict of interest statement
The authors have no relevant financial or non-financial interests to disclose.
Figures
Similar articles
-
Regional differences between grey and white matter in cuprizone induced demyelination.Brain Res. 2009 Aug 4;1283:127-38. doi: 10.1016/j.brainres.2009.06.005. Epub 2009 Jun 12. Brain Res. 2009. PMID: 19524552
-
Novel cell-based analysis reveals region-dependent changes in microglial dynamics in grey matter in a cuprizone model of demyelination.Neurobiol Dis. 2021 Sep;157:105449. doi: 10.1016/j.nbd.2021.105449. Epub 2021 Jul 16. Neurobiol Dis. 2021. PMID: 34274460
-
Yokukansan Reduces Cuprizone-Induced Demyelination in the Corpus Callosum Through Anti-inflammatory Effects on Microglia.Neurochem Res. 2017 Dec;42(12):3525-3536. doi: 10.1007/s11064-017-2400-z. Epub 2017 Sep 19. Neurochem Res. 2017. PMID: 28929408
-
The Cuprizone Model: Dos and Do Nots.Cells. 2020 Mar 31;9(4):843. doi: 10.3390/cells9040843. Cells. 2020. PMID: 32244377 Free PMC article. Review.
-
De- and remyelination in the CNS white and grey matter induced by cuprizone: the old, the new, and the unexpected.Histol Histopathol. 2011 Dec;26(12):1585-97. doi: 10.14670/HH-26.1585. Histol Histopathol. 2011. PMID: 21972097 Review.
Cited by
-
Amorfrutin B Compromises Hypoxia/Ischemia-induced Activation of Human Microglia in a PPARγ-dependent Manner: Effects on Inflammation, Proliferation Potential, and Mitochondrial Status.J Neuroimmune Pharmacol. 2024 Jul 1;19(1):34. doi: 10.1007/s11481-024-10135-9. J Neuroimmune Pharmacol. 2024. PMID: 38949694 Free PMC article.
-
Chronic skin ultraviolet irradiation induces transcriptomic changes associated with microglial dysfunction in the hippocampus.Mol Brain. 2022 Dec 21;15(1):102. doi: 10.1186/s13041-022-00989-6. Mol Brain. 2022. PMID: 36544212 Free PMC article.
-
Loss of the Novel Myelin Protein CMTM5 in Multiple Sclerosis Lesions and Its Involvement in Oligodendroglial Stress Responses.Cells. 2023 Aug 17;12(16):2085. doi: 10.3390/cells12162085. Cells. 2023. PMID: 37626895 Free PMC article.
-
Systemic LPS Administration Stimulates the Activation of Non-Neuronal Cells in an Experimental Model of Spinal Muscular Atrophy.Cells. 2024 May 4;13(9):785. doi: 10.3390/cells13090785. Cells. 2024. PMID: 38727321 Free PMC article.
-
Immunological dimensions of neuroinflammation and microglial activation: exploring innovative immunomodulatory approaches to mitigate neuroinflammatory progression.Front Immunol. 2024 Jan 8;14:1305933. doi: 10.3389/fimmu.2023.1305933. eCollection 2023. Front Immunol. 2024. PMID: 38259497 Free PMC article. Review.
References
Publication types
MeSH terms
Substances
Grants and funding
LinkOut - more resources
Full Text Sources
Medical
Research Materials
