. 2022 May 23:12:849017.
doi: 10.3389/fcimb.2022.849017. eCollection 2022.

Characterization of the Interaction Between SARS-CoV-2 Membrane Protein (M) and Proliferating Cell Nuclear Antigen (PCNA) as a Potential Therapeutic Target

Affiliations

Characterization of the Interaction Between SARS-CoV-2 Membrane Protein (M) and Proliferating Cell Nuclear Antigen (PCNA) as a Potential Therapeutic Target

Érika Pereira Zambalde et al. Front Cell Infect Microbiol. .

Abstract

SARS-CoV-2 is an emerging virus from the Coronaviridae family and is responsible for the ongoing COVID-19 pandemic. In this work, we explored the previously reported SARS-CoV-2 structural membrane protein (M) interaction with human Proliferating Cell Nuclear Antigen (PCNA). The M protein is responsible for maintaining virion shape, and PCNA is a marker of DNA damage which is essential for DNA replication and repair. We validated the M-PCNA interaction through immunoprecipitation, immunofluorescence co-localization, and PLA (Proximity Ligation Assay). In cells infected with SARS-CoV-2 or transfected with M protein, using immunofluorescence and cell fractioning, we documented a reallocation of PCNA from the nucleus to the cytoplasm and the increase of PCNA and γH2AX (another DNA damage marker) expression. We also observed an increase in PCNA and γH2AX expression in the lung of a COVID-19 patient by immunohistochemistry. In addition, the inhibition of PCNA translocation by PCNA I1 and Verdinexor led to a reduction of plaque formation in an in vitro assay. We, therefore, propose that the transport of PCNA to the cytoplasm and its association with M could be a virus strategy to manipulate cell functions and may be considered a target for COVID-19 therapy.

Keywords: DNA damage; M protein; PCNA; SARS-CoV-2; viral-host interaction.


Conflict of interest statement

The authors declare that the research was conducted in the absence of any commercial or financial relationships that could be construed as a potential conflict of interest.

Figures

Figure 1
Figure 1
SARS-CoV-2 structural proteins interact with PCNA in HEK293T and Vero E6 cells. FLAG-tagged GFP, E, M, and N proteins (indicated at the top of the panel) were expressed by transfection in HEK293T cells. Immunoprecipitation with anti-FLAG (A) or anti-PCNA antibodies (B) was performed (indicated on the panel’s top). Blots were done with the primary antibodies indicated on the panel’s left, and molecular weight markers sizes are indicated on the right. (A) PCNA was identified as an interactor of SARS-CoV-2 E and M proteins. (B) Immunoprecipitation of endogenous PCNA confirmed that protein M co-immunoprecipitated with PCNA. These data were obtained in one biological replicate. *HC, Heavy Chain; LC, Light chain. Red arrows indicate specific bands. (C) Vero E6 cells were transfected with pFLAG‐M and submitted to ice-cold methanol fixation after 24h, followed by incubation with the primary antibodies, as indicated on the left, and PLA staining protocol. Panels (A–C) show positive PLA dots for FLAG and PCNA staining in transfected cells. Little to no signal is detected in the respective controls omitting one or both primary antibodies [panels (D–L)]. Images are representative of two independent experiments. Nuclei were stained with DAPI. All images were taken at 63× magnification with a ZEISS Axio Vert.A1 microscope.
Figure 2
Figure 2
FLAG-M expression promotes PCNA translocation to cytoplasm. (A) Vero E6 cells expressing FLAG-M protein, 24h after transfection, were fixed and stained for FLAG-M (green), PCNA (red), and DAPI. Graphs show plot profile intensities for PCNA and DAPI channels in the cross-sections indicated by arrows 1 and 2. Images are representative of two independent experiments. Scale bar 20 μm. (B) PCNA localization was analyzed through fluorescence intensity in non-transfected and FLAG-M transfected cells. Briefly, the nuclei area stained with DAPI was selected manually and the ROI (region of interest) obtained was used to measure PCNA intensities on nucleus and cytoplasm. Fluorescence intensity was quantified in grayscale on ImageJ. This data is representative of two independent experiments. The data represent mean ± SD (n=30). For statistical analysis, Two-way ANOVA and multiple comparison Bonferroni’s tests were used. ****p < 0.0001 were considered statistically significant. (C) Vero E6 cells were transfected with vectors to express FLAG-tagged M or GFP proteins, and after 48 hours cellular fractionation followed by Western blotting was performed. LAMIN A/C and α-Tubulin proteins were used as controls for nuclear and cytosolic fractions, respectively. The expression of the transfected proteins is shown in the right panel. Western blot images are representative of one independent experiment.
Figure 3
Figure 3
Co-localization of FLAG-M and PCNA by confocal immunofluorescence. Vero E6 cells expressing FLAG-M and stained for PCNA (red) and FLAG-M (green) were analyzed by confocal microscopy. The plot profile of two arrowed areas (arrows 1 and 2) indicates an overlap in signals of both proteins, as shown in the graphs on the right. Images were taken at 100× magnification with a Zeiss LSM-780-NLO microscope. Scale bar 10 μm.
Figure 4
Figure 4
PCNA and γH2AX levels in transfected cell lines. (A) Detection of PCNA and γH2AX levels in HEK293T cells transfected with pFLAG-M compared to pFLAG (empty vector). (B) Detection of PCNA and γH2AX levels in Vero E6 cells transfected with pFLAG-M compared to pFLAG-GFP. Graphs show a slight increase in normalized protein levels; however, the statistical test does not show significance. Western blotting data in (A, B) are representative of one independent experiment. (C) Immunofluorescent staining of FLAG-M (green) and γH2AX (red) in Vero E6 cells 24 hours post-transfection. Images are representative of two independent experiments. Scale bar 20 μm. (D) Fluorescence intensity quantification of γH2AX levels in FLAG-M transfected versus non-transfected cells. Fluorescence intensities in the nucleus were measured as described in Figure 2B . Data represent mean ± SD in samples from 2 independent experiments (n = 10). For statistical analysis, a two-tailed unpaired T-test was conducted. n.s, non-significant, ****p < 0.0001 was considered statistically significant.
Figure 5
Figure 5
SARS-CoV-2 infection promotes PCNA translocation to the cytoplasm and enhances PCNA and γH2AX expression. (A) Vero E6 cells were infected with SARS-CoV2 (MOI 0.3), and 24 hours post-infection immunofluorescence was performed for N (green) and PCNA (red). Scale bars 20 μm. (B) Plot profile intensities for PCNA and DAPI channels in the cross-sections, indicated by arrows 1 and 2. Images are representative of two independent experiments. Scale bar 20 μm. (C) PCNA localization was analyzed through fluorescence intensity mock versus infected cells, as described in Figure 2B . White bars = mock, purple bars = SARS-CoV-2 infection. (D) Vero E6 cells were infected with SARS-CoV2 (MOI 0.3), and 24 hours post-infection immunofluorescence was performed for N (green) and γH2AX (red). Scale bars 20 μm. (E) Fluorescence intensity of γH2AX in the nucleus was analyzed in mock and infected cells, as described in Figure 2B . White bars = mock, purple bars = SARS-CoV-2 infection. (F) Western blotting analysis of PCNA and γH2AX levels in HEK293T and Vero E6 cells infected with SARS-CoV-2 compared to mock. Statistical analysis for normalized expression levels of PCNA and γH2AX are shown for HEK293T (G) and Vero E6 cells (H). Data represent means ± SD from 1 independent experiment. For fluorescence intensity (n = 20), data were analyzed by Two-way ANOVA and multiple comparisons Bonferroni’s test. *p < 0.05 and ****p < 0.0001 were considered statistically significant **p < 0.01.
Figure 6
Figure 6
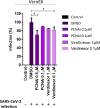
PCNA I1 and Verdinexor inhibit SARS-CoV-2 viral replication in vitro. Vero E6 cells were infected with SARS-CoV-2 as described in the anti-viral in vitro efficacy assay (see Methods), for one hour, then DMSO, PCNA I1 0.5 and 0.1 µM or Verdinexor 1 and 0.1 µM were added to overlay media one hour after virus adsorption. The viral load was assessed by plaque assay after four days of incubation. This data is representative of two independent experiments. T-test was used for independent comparisons between DMSO versus PCNA I1, and DMSO versus Verdinexor. *p < 0.05 were considered statistically significant.

Similar articles

Cited by

References

    1. Alharbi S. N., Alrefaei A. F. (2021). Comparison of the SARS-CoV-2 (2019-Ncov) M Protein With its Counterparts of SARS-CoV and MERS-CoV Species. J. King Saud. Univ. - Sci. 33, 101335–101344. doi: 10.1016/j.jksus.2020.101335 - DOI - PMC - PubMed
    1. Amaral C. L., Freitas L. B., Tamura R. E., Tavares M. R., Pavan I. C. B., Bajgelman M. C., et al. . (2016). S6Ks Isoforms Contribute to Viability, Migration, Docetaxel Resistance and Tumor Formation of Prostate Cancer Cells. BMC Cancer 16, 602. doi: 10.1186/s12885-016-2629-y - DOI - PMC - PubMed
    1. Baldwin (1996). Nuclear & Cytoplasmic Extract Protocol. Ann. Rev. Immunol. 14, 649–681. doi: 10.1146/annurev.immunol.14.1.649 - DOI - PubMed
    1. Boehm E. M., Gildenberg M. S., Washington M. T. (2016). The Many Roles of PCNA in Eukaryotic Dna Replication. EnzymesI 39, 231–254. doi: 10.1016/bs.enz.2016.03.003 - DOI - PMC - PubMed
    1. Bojkova D., Klann K., Koch B., Widera M., Krause D., Ciesek S., et al. . (2020). Proteomics of SARS-CoV-2-infected Host Cells Reveals Therapy Targets. Nature 583, 469–472. doi: 10.1038/s41586-020-2332-7 - DOI - PubMed

Publication types

MeSH terms

Substances