. 2022 Nov;29(11):1662-1675.
doi: 10.1038/s41417-022-00485-y. Epub 2022 Jun 8.

Extracellular sialyltransferase st6gal1 in breast tumor cell growth and invasiveness

Affiliations

Extracellular sialyltransferase st6gal1 in breast tumor cell growth and invasiveness

Nitai C Hait et al. Cancer Gene Ther. 2022 Nov.

Abstract

The sialyltransferase ST6GAL1 that adds α2-6 linked sialic acids to N-glycans of cell surface and secreted glycoproteins is prominently associated with many human cancers. Tumor-native ST6GAL1 promotes tumor cell behaviors such as invasion and resistance to cell stress and chemo- and radio-treatments. Canonically, ST6GAL1 resides in the intracellular secretory apparatus and glycosylates nascent glycoproteins in biosynthetic transit. However, ST6GAL1 is also released into the extracellular milieu and extracellularly remodels cell surface and secreted glycans. The impact of this non-canonical extrinsic mechanism of ST6GAL1 on tumor cell pathobiology is not known. We hypothesize that ST6GAL1 action is the combined effect of natively expressed sialyltransferase acting cell-autonomously within the ER-Golgi complex and sialyltransferase from extracellular origins acting extrinsically to remodel cell-surface glycans. We found that shRNA knockdown of intrinsic ST6GAL1 expression resulted in decreased ST6GAL1 cargo in the exosome-like vesicles as well as decreased breast tumor cell growth and invasive behavior in 3D in vitro cultures. Extracellular ST6GAL1, present in cancer exosomes or the freely soluble recombinant sialyltransferase, compensates for insufficient intrinsic ST6GAL1 by boosting cancer cell proliferation and increasing invasiveness. Moreover, we present evidence supporting the existence novel but yet uncharacterized cofactors in the exosome-like particles that potently amplify extrinsic ST6GAL1 action, highlighting a previously unknown mechanism linking this enzyme and cancer pathobiology. Our data indicate that extracellular ST6GAL1 from remote sources can compensate for cellular ST6GAL1-mediated aggressive tumor cell proliferation and invasive behavior and has great clinical potential for extracellular ST6GAL1 as these molecules are in the extracellular space should be easily accessible targets.


Conflict of interest statement

The authors declare no competing interests.

Figures

Fig. 1
Fig. 1. Elevated ST6GAL1 expression is associated with activating gene networks that promote a metastatic phenotype.
A boxplot shows a high expression score of the ST6GAL1 gene in normal adjacent breast tissues (n = 117) vs. breast cancer patients of TCGA breast cancer cohort [64] with primary tumors (n = 979) (A). Student’s t-test, p = 0.031. Boxplots of the ST6GAL1 high expression score by immunohistochemistry (IHC) determined subtype in the TCGA breast cancer (B), and Nottingham pathological grades are shown for the METABRIC cohort [39] (C). All boxplots are Tukey type, and the boxes depict medians and inter-quartile ranges. One-way ANOVA and Tukey’s tests were used to calculate p values. Box plots of the intratumor heterogeneity [57, 58] in the TCGA breast cancer cohort by low and high ST6GAL1 score groups (D). Mann–Whitney U test and Kruskal–Wallis test were used to calculate the p-value. Median cut-off was used to divide two groups. IHC of ST6GAL1; representative (n = 3). E TNBC tissue section IHC with anti-ST6GAL1 antibodies are shown (red arrow higher and green arrow lower ST6GAL1 expression, respectively). Gene Set Enrichment Assay (GSEA) of high ST6GAL1 in the TCGA breast cancer cohort revealed enrichment in the Hedgehog (F), EMT (G), and Hypoxia (H) pathways. The normalized enrichment score (NES) and false discovery rate (FDR) values for TCGA-BRCA cohort are: Hedgehog, NES = 1.467799; FDR = 0.161496; EMT, NES = 1.458644; FDR = 0.160286; and Hypoxia, NES = 1.622797, FDR = 0.085881. FDR of 0.25 was used as the statistical significance of GSEA. A median cut-off was used to divide two groups (high vs. low ST6GAL1). I The Kaplan–Meier estimates the probability of relapse-free survival (RFS) by mRNA of TNBC patients. Analysis was provided by using the online KM-plotter [60].
Fig. 2
Fig. 2. Functional ST6GAL-1 is variably expressed in breast cancer cells.
A mRNA levels of ST6GAL1 were determined from ER + and TNBC human and mouse breast cancer cells, as indicated by quantitative real-time PCR (qPCR) and normalized to GAPDH (2^-delta Ct). N = 3, data are means ± s.e. B Total cell lysates from separate cell cultures (A) were used for Western blot analysis with antibodies against ST6GAL1. β-tubulin was used as a specific marker for cytosol and to show equal loading and transfer. C As indicated, an equal amount of proteins from cell lysates (B) was used for the ST6GAL1 enzyme assay, as previously mentioned [65]. ST6GAL1 activity is presented as fmol/min/mg protein; enzyme assays were performed in triplicates. Data are mean ± s.e. D Human and mouse representative ER+ and TNBC cell lines, as indicated, were immunostained with FITC- (green) labeled SNA lectin and DAPI (blue) for the nuclei before fixing. During fluorescent microscopy, exposure time and weighting for both DAPI and FITC fluorescence were kept consistent between samples. Representative images (N = 4) were shown on a scale bar of 50 µm. E Images were processed in ImageJ; background subtraction and MFI per cell calculations were carried out using the same parameters for each condition, and mean fluorescence intensity (MFI) per cell was shown with mean ± s.d. for four fields of view.
Fig. 3
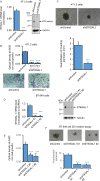
Fig. 3. Natively expressing ST6GAL1 is involved in breast cancer cell growth and invasiveness.
B Mouse breast cancer bone metastatic 4T1.2 cells were transfected with a validated shST6GAL1 #1 and shControl for 24 h with Lipofectamine P3000 reagents (Invitrogen), according to the company’s instruction. 5000 cells transfected with shControl and shST6GAL1 were cultured in the 24-well tissue culture plate in the medium containing 5% serum for another 48 h and 72 h, and cell proliferation was determined with WST-8 reagent. Normalized A450 nm readings were plotted (n = 5). Dara are means ± s.e., Student’s t-test, ***p < 0.001. A duplicate 48 h culture of 4T1.2 cells was used for Crystal Violet staining (B, lower panels). Representative live-cell images are shown for shControl and shST6GAL1. A Duplicate culture of 4T1.2 cells was used for SYBR-Green-qPCR and protein analyses for the ST6GAL1 gene. ST6GAL1 mRNA levels from the shControl and shST6GAL1 samples were normalized with the house-keeping gene GAPDH, and the normalized ST6GAL1 levels were calculated using the Delta-Delta Ct method, N = 3, data are means ± s.e., Student’s t-test, p < 0.001. A representative blot was shown for ST6GAL1 western blot analysis (N = 3), and GAPDH was used for housekeeping control for equal loading (A, right panels). (C, upper panels) 20,000 4T1.2 cells transfected with shST6GAL1 vs. shControl were plated on 12-well low-adherent tissue culture plates mixed with growth factor reduced Matrigel for 72 h to obtain aggressive tumor-cell Invasion in a 3D cell culture setting. The experiments were repeated three times, and representative phase-contrast images (×10 magnification) of tumor-cell invasions are shown for each condition; the yellow line indicates the invasion area on the spheroid body. (C, lower panel) Histograms represent the invading area’s quantification and the protrusion’s average length (N = 10 per condition, scale bar = 250 µm, data are ±s.e., Student’s t-test, p < 0.001. DF Human TNBC BT-549 cells were transfected with shControl and shST6GAL1 #1 (Sigma Cat# TRCN0000035432) or shST6GAL1 #2 (Sigma Cat# TRCN0000035429), as mentioned before. 3D cell invasion assays (F, upper panels), quantification of cell invasion (F, lower panel), and cell proliferation (E) assays were performed. Duplicate cultures were used for qPCR and Western blot analysis of ST6GAL1 (D). For qPCR analysis, gene levels were normalized by GAPDH, N = 3, data are ±s.e., Student’s t-test, p < 0.05. Experiments were repeated at least three times, and representative blots and images were shown. For Western blotting, tubulin as a loading control for equal transfer. Histograms data for invasion assays are means ± s.e., scale bar 250 µm, one-way ANOVA, and post-hoc test for pair-wise comparison, p < 0.001.
Fig. 4
Fig. 4. Breast tumor cells released exosome-like vesicles with heterogeneously expressed ST6GAL1.
4T1.2 cells were transfected with shControl or ShST6GAL1 #1 for 24 h, as mentioned above. Cells were cultured in the serum-free conditioned medium for another 48 h. A An equal amount of proteins from cell extracts (left panels) and exosome-like particles (right panels) were used for Western blot analysis with the indicated antibodies. Representative blots (N = 3) were shown. ST6GAL1 from cell lysates versus exosomes was analyzed in the same gel/membrane to compare their molecular size and presented in separate figures. Equal amounts of proteins from exosome fractions were used for α2,6 N-Linked activity (ST6GAL1) (B, upper panel) and α2,3 N-Linked activity (ST3GAL6)(B, lower panel) assays. Specific activity was calculated as fmol/min/µg specific product, plotted as fold activity, n = 3, data are means ± s.e., Student’s t-test, p < 0.001. NS; not significant. C, D Size distributions by nanoparticle tracking analysis (NTA) and images of exosome-like particles, which are screenshots from recorded videos of EVs when characterized by NTA. Exosome-like particles were isolated from shControl (C) and shST6GAL1 (D) transfected 4T1.2 cell culture-conditioned medium (100× dilution) and were examined by NTA. (C, D; right panel, respectively) Negative stain transmission electron microscopy (TEM) imaging of exosome-like particles. Representative images are shown. Scale bars: 100 nm.
Fig. 5
Fig. 5. Extracellular ST6GAL1 enhances breast tumor cell proliferation and invasiveness.
A Human breast cancer MDA-231 cells were treated with a control medium, 25 µM CMP-Sia, 0.25-1 µg/ml recombinant rat ST6GAL1 protein (rST6G), 1–2 µg exosome-like particles (BT-549) or 1 µg self-exosomes (MDA-231) as a control from a separate culture with or without additional rST6G, as indicated in serum-free medium for 48 h. Cell proliferation was measured by WST-8 reagent. N = 3, data are means ± s.e., ANOVA, post-hoc t-test, *p < 0.05, **p < 0.01, ***p < 0.001. B MDA-231 cells were treated with a control medium, 1 µg exosomes (BT-549), or exosome particles (BT-549) mixed with 1 µg rST6G for 20 min in a serum-free medium. SNA-lectins were stained (Green), and nuclei were stained with DAPI (blue color). Representative overlay images are shown on a scale of 50 µm. C Mouse breast cancer E0771 cells were cultured in the serum-free medium and treated with a control medium, 1 µg rST6G, 1 µg self-exosomes, or in combination, as indicated for 48 h. Cell proliferation was measured, as mentioned before. Mouse metastatic breast cancer 4T1.2 (F), human breast cancer MDA-231 (D), and BT-549 cells (E) were used for 3D spheroids assay with the indicated treatments, including rST6G only. Representative 10× magnification light microscopy images are shown. Histograms are the quantification of cancer cell invasion, n = 5; data are means ± s.e., ANOVA, post-hoc t-test, p < 0.05 vs. control.
Fig. 6
Fig. 6. Extracellular ST6GAL1 compensates for cell-intrinsic ST6GAL1 actions in breast tumor cells.
A 4T1.2 cells transfected with shControl or mouse shST6GAL1 #1 construct and invasion abilities were assessed with 3D spheroid cell culture setting after 48 h of treatments, as indicated. Representative images and quantification of cancer cell invasions are shown (A, upper and lower panel, respectively). Scale bar 250 µm, N = 5 spheroids, data are means ± s.e., ANOVA, post-hoc t-test, p < 0.001 vs. respective controls. B BT-549 cells transfected with shControl, human shST6GAL1 #1 or shST6GAL1 #2 were treated with the control medium, self-exosome particles, rST6G, or self-exosomes, rST6G in combination, and 3D invasion assays were performed. The scale bar 250 µm (B, upper panel) shows representative phase-contrast microscopy images. Quantification of invasions (B, lower panel), n = 5, data means ± s.e, ANOVA, post-hoc test, p < 0.0001 vs. respective controls. Separate cultures were used to validate knockdown efficiencies of ST6GAL1 in 4T1.2 and BT-549 cells by qPCR and Western blotting, Supplemental Fig. S5 panel A, B, respectively.
Fig. 7
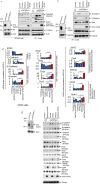
Fig. 7. Extracellular ST6GAL1 regulates cancer stem cell transcription factors in breast tumor cells.
A BT-549 and 4T1.2 cells, as indicated, transfected with the validated shST6GAL1 or the control shRNA were treated with the respective self-exosome particles or in combination with the rST6G for 48 h in a serum-free medium. B A separate culture of shControl and shST6GAL1 4T1.2 cells was used. Validated knockdown cells were treated with self-exosomes or in combination with rST6G, as indicated above. Cells extracts were used for Western blot analysis with the indicated antibodies. CHC, Tubulin, Actin, or GAPDH were used for equal loading transfer. Knockdown of ST6GAL1 in BT-549 and 4T1.2 cells was confirmed by Western blot of ST6GAL1, left panels of A and B, respectively. Ns in A (left panels) highlights a single non-specific band. Experiments were repeated at least three times; representative blots were shown. C, D Human breast cancer T47D cells transfected with the validated shST6GAL1 or the control shRNA were treated with the rST6G or combined with the self-exosome particles (shControl exosomes to shControl cells and shST6GAL1 exosomes to shST6GAL1 cells) for 48 h in serum-free medium. Cell cultures were used for SYBR-Green qPCR analysis with the indicated gene primers. Gene levels were normalized with GAPH and calculated by the delta-delta-Ct method. Data are means ± s.e., n = 3, ANOVA, post-hoc test, *p < 0.05, **p < 0.01 and ***p < 0.001. D Separate cultures of T47D cells were used for Western blot analysis with the indicated antibodies, including ST6GAL1 to validate the knockdown efficiency in shST6GAL1 versus shControl. Tubulin or CHC was used for equal loading and transfer. Experiments were repeated at least three times, and representative blots were shown.

Similar articles

Cited by

References

    1. Pinho SS, Reis CA. Glycosylation in cancer: mechanisms and clinical implications. Nat Rev Cancer. 2015;15:540–55.. doi: 10.1038/nrc3982. - DOI - PubMed
    1. Magalhaes A, Duarte HO, Reis CA. Aberrant glycosylation in cancer: a novel molecular mechanism controlling metastasis. Cancer Cell. 2017;31:733–5. doi: 10.1016/j.ccell.2017.05.012. - DOI - PubMed
    1. Dorsett KA, Marciel MP, Hwang J, Ankenbauer KE, Bhalerao N, Bellis SL. Regulation of ST6GAL1 sialyltransferase expression in cancer cells. Glycobiology. 2021;31:530–9. doi: 10.1093/glycob/cwaa110. - DOI - PMC - PubMed
    1. Swindall AF, Londono-Joshi AI, Schultz MJ, Fineberg N, Buchsbaum DJ, Bellis SL. ST6Gal-I protein expression is upregulated in human epithelial tumors and correlates with stem cell markers in normal tissues and colon cancer cell lines. Cancer Res. 2013;73:2368–78. doi: 10.1158/0008-5472.CAN-12-3424. - DOI - PMC - PubMed
    1. Hsieh CC, Shyr YM, Liao WY, Chen TH, Wang SE, Lu PC, et al. Elevation of beta-galactoside alpha2,6-sialyltransferase 1 in a fructoseresponsive manner promotes pancreatic cancer metastasis. Oncotarget. 2017;8:7691–709. doi: 10.18632/oncotarget.13845. - DOI - PMC - PubMed

Publication types