

Prostate cancer histopathology using label-free multispectral deep-UV microscopy quantifies phenotypes of tumor aggressiveness and enables multiple diagnostic virtual stains
- PMID: 35665770
- PMCID: PMC9167293
- DOI: 10.1038/s41598-022-13332-9
Prostate cancer histopathology using label-free multispectral deep-UV microscopy quantifies phenotypes of tumor aggressiveness and enables multiple diagnostic virtual stains
Abstract
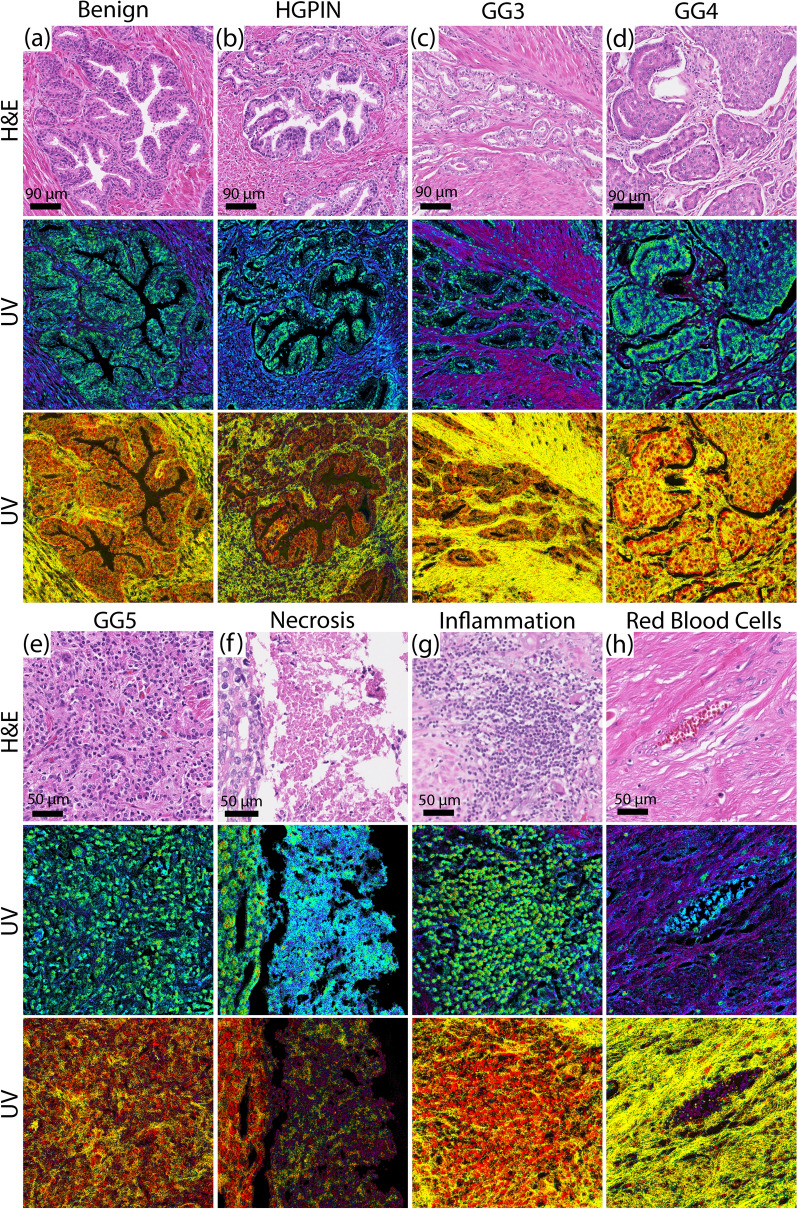
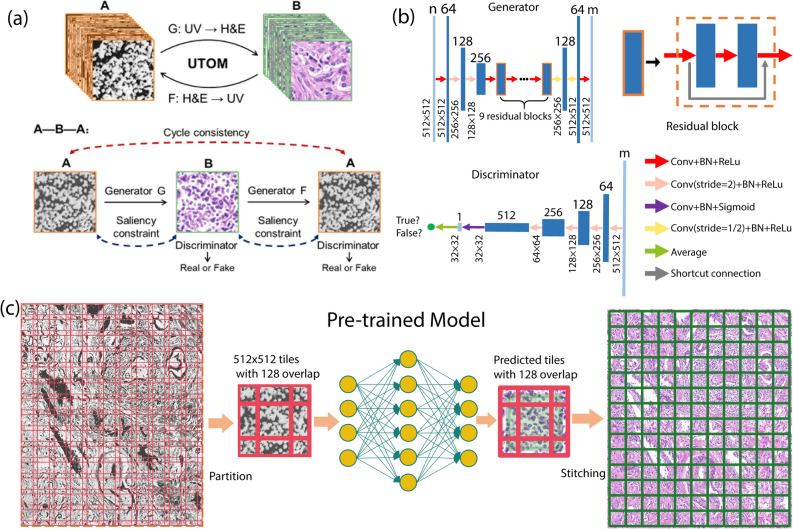
Identifying prostate cancer patients that are harboring aggressive forms of prostate cancer remains a significant clinical challenge. Here we develop an approach based on multispectral deep-ultraviolet (UV) microscopy that provides novel quantitative insight into the aggressiveness and grade of this disease, thus providing a new tool to help address this important challenge. We find that UV spectral signatures from endogenous molecules give rise to a phenotypical continuum that provides unique structural insight (i.e., molecular maps or "optical stains") of thin tissue sections with subcellular (nanoscale) resolution. We show that this phenotypical continuum can also be applied as a surrogate biomarker of prostate cancer malignancy, where patients with the most aggressive tumors show a ubiquitous glandular phenotypical shift. In addition to providing several novel "optical stains" with contrast for disease, we also adapt a two-part Cycle-consistent Generative Adversarial Network to translate the label-free deep-UV images into virtual hematoxylin and eosin (H&E) stained images, thus providing multiple stains (including the gold-standard H&E) from the same unlabeled specimen. Agreement between the virtual H&E images and the H&E-stained tissue sections is evaluated by a panel of pathologists who find that the two modalities are in excellent agreement. This work has significant implications towards improving our ability to objectively quantify prostate cancer grade and aggressiveness, thus improving the management and clinical outcomes of prostate cancer patients. This same approach can also be applied broadly in other tumor types to achieve low-cost, stain-free, quantitative histopathological analysis.
© 2022. The Author(s).
Conflict of interest statement
The authors declare no competing interests.
Figures


Similar articles
-
Deep learning-enabled realistic virtual histology with ultraviolet photoacoustic remote sensing microscopy.Nat Commun. 2023 Sep 25;14(1):5967. doi: 10.1038/s41467-023-41574-2. Nat Commun. 2023. PMID: 37749108 Free PMC article.
-
Deep UV Microscopy Identifies Prostatic Basal Cells: An Important Biomarker for Prostate Cancer Diagnostics.BME Front. 2022 Sep 2;2022:9847962. doi: 10.34133/2022/9847962. eCollection 2022. BME Front. 2022. PMID: 37850167 Free PMC article.
-
Use of Deep Learning to Develop and Analyze Computational Hematoxylin and Eosin Staining of Prostate Core Biopsy Images for Tumor Diagnosis.JAMA Netw Open. 2020 May 1;3(5):e205111. doi: 10.1001/jamanetworkopen.2020.5111. JAMA Netw Open. 2020. PMID: 32432709 Free PMC article.
-
Multiparametric MRI in detection and staging of prostate cancer.Dan Med J. 2017 Feb;64(2):B5327. Dan Med J. 2017. PMID: 28157066 Review.
-
Issues in using whole slide imaging for diagnostic pathology: "routine" stains, immunohistochemistry and predictive markers.Biotech Histochem. 2014 Aug;89(6):419-23. doi: 10.3109/10520295.2013.861512. Epub 2013 Dec 11. Biotech Histochem. 2014. PMID: 24325681 Review.
Cited by
-
Accelerating Cancer Histopathology Workflows with Chemical Imaging and Machine Learning.Cancer Res Commun. 2023 Sep 18;3(9):1875-1887. doi: 10.1158/2767-9764.CRC-23-0226. Cancer Res Commun. 2023. PMID: 37772992 Free PMC article.
-
Deep learning-enabled realistic virtual histology with ultraviolet photoacoustic remote sensing microscopy.Nat Commun. 2023 Sep 25;14(1):5967. doi: 10.1038/s41467-023-41574-2. Nat Commun. 2023. PMID: 37749108 Free PMC article.
-
Unsupervised segmentation of biomedical hyperspectral image data: tackling high dimensionality with convolutional autoencoders.Biomed Opt Express. 2022 Nov 10;13(12):6373-6388. doi: 10.1364/BOE.476233. eCollection 2022 Dec 1. Biomed Opt Express. 2022. PMID: 36589581 Free PMC article.
-
Metabolic light absorption, scattering, and emission (MetaLASE) microscopy.Sci Adv. 2024 Oct 18;10(42):eadl5729. doi: 10.1126/sciadv.adl5729. Epub 2024 Oct 18. Sci Adv. 2024. PMID: 39423271 Free PMC article.
-
Deep UV Microscopy Identifies Prostatic Basal Cells: An Important Biomarker for Prostate Cancer Diagnostics.BME Front. 2022 Sep 2;2022:9847962. doi: 10.34133/2022/9847962. eCollection 2022. BME Front. 2022. PMID: 37850167 Free PMC article.
References
-
- Surveillance, Epidemiology, and End Results (SEER) Program, National Cancer Institute: Cancer Stat Facts: Prostate Cancer (2021).
-
- Sakr WA, Grignon DJ, Crissman JD, Heilbrun LK, Cassin BJ, Pontes JJ, Haas GP. High grade prostatic intraepithelial neoplasia (HGPIN) and prostatic adenocarcinoma between the ages of 20–69: An autopsy study of 249 cases. In Vivo. 1994;8:439–443. - PubMed
-
- American Cancer Society. Cancer facts and figures (2020).
-
- Epstein JI, Zelefsky MJ, Sjoberg DD, Nelson JB, Egevad L, Magi-Galluzzi C, Vickers AJ, Parwani AV, Reuter VE, Fine SW, Eastham JA, Wiklund P, Han M, Reddy CA, Ciezki JP, Nyberg T, Klein EA. A contemporary prostate cancer grading system: A validated alternative to the gleason score. Eur. Urol. 2016;69:428–435. doi: 10.1016/j.eururo.2015.06.046. - DOI - PMC - PubMed
Publication types
MeSH terms
Substances
LinkOut - more resources
Full Text Sources
Medical
