. 2022 Jun 2;29(6):918-932.e8.
doi: 10.1016/j.stem.2022.04.018.

Recapitulation of endogenous 4R tau expression and formation of insoluble tau in directly reprogrammed human neurons

Affiliations

Recapitulation of endogenous 4R tau expression and formation of insoluble tau in directly reprogrammed human neurons

Lucia S Capano et al. Cell Stem Cell. .

Abstract

Tau is a microtubule-binding protein expressed in neurons, and the equal ratios between 4-repeat (4R) and 3-repeat (3R) isoforms are maintained in normal adult brain function. Dysregulation of 3R:4R ratio causes tauopathy, and human neurons that recapitulate tau isoforms in health and disease will provide a platform for elucidating pathogenic processes involving tau pathology. We carried out extensive characterizations of tau isoforms expressed in human neurons derived by microRNA-induced neuronal reprogramming of adult fibroblasts. Transcript and protein analyses showed that miR neurons expressed all six isoforms with the 3R:4R isoform ratio equivalent to that detected in human adult brains. Also, miR neurons derived from familial tauopathy patients with a 3R:4R ratio altering mutation showed increased 4R tau and the formation of insoluble tau with seeding activity. Our results collectively demonstrate the utility of miRNA-induced neuronal reprogramming to recapitulate endogenous tau regulation comparable with the adult brain in health and disease.

Keywords: 4R tau; adult human neurons; insoluble tau; microRNA-induced neurons; neuronal reprogramming; tau isoform ratio; tau isoforms; tau seeding; tauopathy.


Conflict of interest statement

Declaration of interests D.M.H. is an inventor on a patent licensed by Washington University to C2N Diagnostics on the therapeutic use of anti-tau antibodies. D.M.H. cofounded and is on the scientific advisory board of C2N Diagnostics. C2N Diagnostics has licensed certain anti-tau antibodies to AbbVie for therapeutic development. D.M.H. is on the scientific advisory board of Denali, Genentech (South San Francisco, CA, USA), and Cajal Neurosciences and consults for Genentech, Takeda, Casma, and Eli Lilly. A.S.Y. consults for Roche. K.H. is an EISAI-sponsored visiting researcher at Washington University and has received salary from Eisai. K.E.D. is a board member and advisor for Ceracuity LLC. All other authors declare no competing interests.

Figures

Figure 1 |
Figure 1 |. Directly-reprogrammed neurons display neuronal morphology and transcriptome
(A) Representative images of miNs from healthy adult individuals (Healthy 3+4) at post-induction day (PID) 30 immunostained with NCAM (composite of 3x2 40x images stitched together), MAP2, NEFH, and TUBB3. Insets at the corners are immunostaining images performed in starting fibroblasts. Blue rectangular outline depicts the region shown in magnified images. Scale bars = 50 μm. (B) Representative image of Healthy 4 immunostained for total tau and TUBB3. Inset is starting fibroblasts. Blue rectangular outline depicts the magnified region showing tau islands. Scale bars = 50 μm. (C) Left, representative images of healthy miNs stained for tau and TUBB3. Right, quantification of % positive over DAPI in reprogrammed cells from four independent fibroblast samples (MAP2 Number of cells counted: miN 1=140, miN 2=82, miN 3=112, miN 4=169; MAPT Ns: miN 1=113, miN 2=118, miN 3=78, miN 4=87). Scale bars = 50 μm. (D) Heatmap plots Z-scores comparing qPCR of neuronal genes between miNs and starting fibroblasts from four independent samples. (E) Fold change of cortical genes between starting fibroblasts and day 30 miNs. n=3 replicates from miNs grown in three independent wells. Mean±SEM.; two-tailed Student’s t-test; *p ≤ 0.05, **p < 0.01, ***p ≤ 0.001. (F) Left, UMAP projection of cells colored by starting cell type (Fibroblast: n=2533 cells; iPSC-N: n=7212 cells; miN: n=9305 cells). Right, UMAP projection of cells colored by non-neuronal (SERPINE1) and pan-neuronal markers (MAPT, MAP2, NCAM1, KIF1A). See also Figure S1.
Figure 2 |
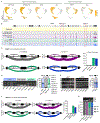
Figure 2 |. MiNs express exon 10 inclusion at equivalent ratio to the adult human brain
(A) UMAP projection of cells colored by age-associated markers (CDKN1A, CDKN2A, BAG3, and CAV1) and fetal-associated markers (EPHA3 and BCL2). Cell numbers as indicated in Figure 1F. (B) Representative RNA-seq tracks at the MAPT locus of fibroblasts, primary human neurons, cortical iPSC-Ns, adult human brain, and miNs at PID21. (C) Leafcutter analysis of MAPT exon 10 inclusion between fetal neurons and adult brain, and healthy iPSC-Ns and healthy miNs. Percent exon 10 inclusion is quantified on the right. For primary fetal neurons and adult brain, n= sequencing replicates performed from purchased purified RNA (see STAR Methods). For iPSC-Ns, n=replicates grown in three independent wells. For miNs, n=three independent well replicates from three independent individuals. (D) Left, semi-quantitative PCR of 3R and 4R tau isoforms. Right: Quantification of 3R and 4R percent ratio of samples grouped by miNs, fetal samples, and adult brain from independent individuals as indicated in the graph legend. Mean±SEM; One-way ANOVA with multiple comparisons with post hoc Tukey’s test; ***p ≤ 0.001. (E) Semi-quantitative PCR of 3R and 4R tau expression. Red rectangular outline depicts the time point when 4R tau starts being expressed consistently in multiple samples (n=three independent individuals). Right, Two-tailed Student’s T-test of PID15 vs PID20. Mean±SEM; ns p = 0.92. See also Figure S2 and Tables S1 and S2.
Figure 3 |
Figure 3 |. MiN tau protein profile mirrors that of the adult human brain
(A) Quantitation of relative tau peptides from multiple independent samples as indicated in the plot legend. Mean(thick line)±SEM. Pink and red dashed outline depicts1N, 1N/2N, and 4R-specific tau peptides, respectively. (B) Quantification of 3R:4R isoform ratio of all samples used in Figure 3A. Histogram colors are matched to sample colors shown in the plot legend of Figure 3A. Mean±SEM; One-Way ANOVA with multiple comparisons and post hoc Tukey’s test: Between any fetal vs adult sample for all three 4R peptides: ***p ≤ 0.001. (C) Percent of N isoforms (calculation in methods) using all samples as indicated in the plot legend in Figure 3A. Mean±SEM; One-Way ANOVA with multiple comparisons and post hoc Tukey’s test. All N isoforms between fetal vs healthy iPSC-Ns and between adult vs healthy miNs: ns p ¾ 0.999; between healthy iPSC-Ns vs healthy miNs: 0N: **p = 0.002, 1N: **p = 0.002, 2N: *p = 0.015. (D) Western blot of tau isoforms. (E) Left, western blot of tau isoforms over reprogramming timecourse. Right, quantification of 3R:4R ratio of 0N and 1N isoforms during the time course of reprogramming of two independent samples indicated in the plot legend. Mean±SEM; One-Way ANOVA with multiple comparisons and post hoc Tukey’s test; Between fetal vs any miN: **p = 0.002; between fetal and adult: **p = 0.004.
Figure 4 |
Figure 4 |. IVS10+16 patient-derived miNs show increased 4R tau mRNA
(A) Left, representative images of reprogrammed IVS10+16 miNs from four independent, symptomatic IVS10+16 patients, immunostained for tau, MAP2 and TUBB3. Right, quantification of % positive over DAPI (MAP2 Number of cells counted: IVS10+16 1=118, IVS10+16 2=173, IVS10+16 3=105, IVS10+16 4=152; MAPT Ns: IVS10+16 miN 1=98, IVS10+16 miN 2=125, IVS10+16 miN 3=89, IVS10+16 miN 4=88). Scale bars = 50 μm. (B) Z score heatmap (from qPCR) representation of neuronal marker gene expression MAP2, NEFL, MAPT, and VGLUT1 in IVS10+16 miNs and starting fibroblasts from four independent lines. (C) LONGO long gene analysis between starting fibroblasts (red) and reprogrammed healthy and IVS10+16 miNs (blue and orange, respectively). (D) Leafcutter analysis of MAPT exon 10 inclusion between healthy and IVS10+16 miNs. Percent exon 10 inclusion is quantified on the right. For miN groups, n=three independent well replicates from three independent individuals. (E) Left, sqPCR for detecting 4R and 3R tau ratio. Right: sqPCR intensity values grouped by healthy miNs, IVS10+16 miNs, and healthy adult brain for 3R and 4R. Mean±SEM. One-Way ANOVA with multiple comparisons and post hoc Tukey’s test; Between healthy miNs vs IVS10+16 miNs and IVS10+16 miNs vs adult brain: ***p ≤ 0.001. (F) sqPCR of both healthy and IVS10+16 human brain and miNs. See also Figure S3.
Figure 5 |
Figure 5 |. IVS10+16 patient-derived miNs demonstrate increased 4R protein corresponding to increased 4R mRNA
(A) Quantitation of relative tau peptides from multiple independent samples as indicated in the plot legend. Mean(thick line)±SEM. (B) Quantification of 3R:4R isoform ratio of all samples used in Figure 5A. Histogram colors are matched to sample colors shown in the plot legend of Figure 5A. Mean±SEM. One-Way ANOVA with multiple comparisons and post hoc Tukey’s test; healthy miNs vs IVS10+16 miNs: 275-280 **p = 0.004, 282-290 **p = 0.004, 299-317 **p = 0.008. Between any miN and iPSC-N: all peptides ***p ≤ 0.001. C) Fold change of 4R isoform expression for all three 4R-specific peptides over healthy miNs. (D) Percentage of N isoforms using all samples as indicated in the plot legend in Figure 5A. Mean±SEM; One-Way ANOVA with multiple comparisons and post hoc Tukey’s test. For all N isoforms: between healthy iPSC-Ns and IVS10+16 iPSC-Ns: ns p > 0.999; between healthy miNs vs IVS10+16 miNs: 0N: ns p = 0.97; 1N: ns p = 0.983; 2N: ns p = 0.887; between IVS10+15 miNs vs IVS10+16 iPSC-Ns: 0N: *p = 0.038; 1N: *p = 0.027; 2N: ns p = 0.285.
Figure 6 |
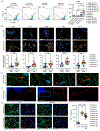
Figure 6 |. Formation of seed-capable and insoluble tau in IVS10+16 patient-derived miNs
(A) Left, Representative FRET signals for healthy and IVS10+16 iPSC-N and miN lysate. Right, quantification of % FRET. n=20,000 cells per FRET run. For iPSC-N samples, we performed three independent FRET runs per cell pellet. For miNs, we used three healthy and four IVS10+16 independent, individual samples, with three replicate FRET runs per sample. One-way ANOVA with multiple comparisons. *p ≤ 0.05, **p ≤ 0.01. (B) Top, representative images of methanol-fixed healthy and IVS10+16 miNs. Cells were co-labeled with MAP2 antibody (green) and one of five anti-tau antibodies: AT8, CP13, MC1, PHF1, and TOC1 (yellow). Below, quantification of anti-tau antibody signal positive area per 100 nuclei from three healthy and four IVS10+16 independent, individual samples as indicated in plot legend. Nuclei counted per condition: AT8: healthy miN=70939, IVS10+16 miN=84046; CP13: healthy miN=69708, IVS10+16 miN=88775; PHF1: healthy miN=93443, IVS10+16 miN=71070; TOC1: healthy miN=47280, IVS10+16 miN=91376; MC1: healthy miN=94171, IVS10+16 miN=97931. Scale bars = 50 μm. (C) High magnification of IVS10+16 miNs and insoluble tau threads and tendrils stained with total tau antibody, CP27. Scale bars = 50 μm. (D) Stimulated emission depletion (STED) microscopy of insoluble tau in IVS10+16 miNs. Scale bars =10 μm. (E) Left, arrowheads indicate the location of insoluble tau signals in healthy miNs (top) and IVS10+16 miNs (bottom). Left images: cells treated with control siRNA (siCtrl). Right images: cell treated with siRNA against total tau (siTotal tau). Right plot: Quantification of tau signals detected per 100 nuclei (DAPI) in healthy miNs (healthy miNs treated with siCtrl) in comparison to IVS10+16 miNs treated with siCtrl and IVS10+16 miNs treated with siTotal tau from three healthy and four IVS10+16 independent, individual samples. Nuclei counted per condition: siCTRL on healthy miNs =140,283; siCTRL on IVS10+16 miNs=117,781; siTau on IVS10+16 miNs=114,050. One-way ANOVA with multiple comparisons. ***p ≤ 0.001. Scale bars = 50 μm. See also Figure S4.

Similar articles

Cited by

References

    1. Abernathy DG, Kim WK, McCoy MJ, Lake AM, Ouwenga R, Lee SW, Xing X, Li D, Lee HJ, Heuckeroth RO, et al. (2017). MicroRNAs Induce a Permissive Chromatin Environment that Enables Neuronal Subtype-Specific Reprogramming of Adult Human Fibroblasts. Cell Stem Cell 21, 332–348.e339. 10.1016/j.stem.2017.08.002. - DOI - PMC - PubMed
    1. Abernathy DG, and Yoo AS (2015). MicroRNA-dependent genetic networks during neural development. Cell Tissue Res. 359, 179–185. 10.1007/s00441-014-1899-4. - DOI - PMC - PubMed
    1. Antiabong JF, Ngoepe MG, and Abechi AS (2016). Semi-quantitative digital analysis of polymerase chain reaction-electrophoresis gel: Potential applications in low-income veterinary laboratories. Vet World 9, 935–939. 10.14202/vetworld.2016.935-939. - DOI - PMC - PubMed
    1. Barthélemy NR, Bateman RJ, Hirtz C, Marin P, Becher F, Sato C, Gabelle A, and Lehmann S (2020a). Cerebrospinal fluid phospho-tau T217 outperforms T181 as a biomarker for the differential diagnosis of Alzheimer’s disease and PET amyloid-positive patient identification. Alzheimer’s Research & Therapy 12. 10.1186/s13195-020-00596-4. - DOI - PMC - PubMed
    1. Barthélemy NR, Li Y, Joseph-Mathurin N, Gordon BA, Hassenstab J, Benzinger TLS, Buckles V, Fagan AM, Perrin RJ, Goate AM, et al. (2020b). A soluble phosphorylated tau signature links tau, amyloid and the evolution of stages of dominantly inherited Alzheimer’s disease. Nature Medicine 26, 398–407. 10.1038/s41591-020-0781-z. - DOI - PMC - PubMed

Publication types

LinkOut - more resources