. 2022 Jun 28;13(3):e0346421.
doi: 10.1128/mbio.03464-21. Epub 2022 Jun 6.

Integration of the Salmonella Typhimurium Methylome and Transcriptome Reveals That DNA Methylation and Transcriptional Regulation Are Largely Decoupled under Virulence-Related Conditions

Affiliations

Integration of the Salmonella Typhimurium Methylome and Transcriptome Reveals That DNA Methylation and Transcriptional Regulation Are Largely Decoupled under Virulence-Related Conditions

Jeffrey S Bourgeois et al. mBio. .

Abstract

Despite being in a golden age of bacterial epigenomics, little work has systematically examined the plasticity and functional impacts of the bacterial DNA methylome. Here, we leveraged single-molecule, real-time sequencing (SMRT-seq) to examine the m6A DNA methylome of two Salmonella enterica serovar Typhimurium strains: 14028s and a ΔmetJ mutant with derepressed methionine metabolism, grown in Luria broth or medium that simulates the intracellular environment. We found that the methylome is remarkably static: >95% of adenosine bases retain their methylation status across conditions. Integration of methylation with transcriptomic data revealed limited correlation between changes in methylation and gene expression. Further, examination of the transcriptome in ΔyhdJ bacteria lacking the m6A methylase with the most dynamic methylation pattern in our data set revealed little evidence of YhdJ-mediated gene regulation. Curiously, despite G(m6A)TC motifs being particularly resistant to change across conditions, incorporating dam mutants into our analyses revealed two examples where changes in methylation and transcription may be linked across conditions. This includes the novel finding that the ΔmetJ motility defect may be partially driven by hypermethylation of the chemotaxis gene tsr. Together, these data redefine the S. Typhimurium epigenome as a highly stable system that has rare but important roles in transcriptional regulation. Incorporating these lessons into future studies will be critical as we progress through the epigenomic era. IMPORTANCE While recent breakthroughs have enabled intense study of bacterial DNA modifications, limitations in current work have potentiated a surprisingly untested narrative that DNA methylation is a common mechanism of the bacterial response to environmental conditions. Essentially, whether epigenetic regulation of bacterial transcription is a common, generalizable phenomenon is a critical unanswered question that we address here. We found that most DNA methylation is static in Salmonella enterica serovar Typhimurium, even when the bacteria are grown under dramatically different conditions that cause broad changes in the transcriptome. Further, even when the methylation of individual bases change, these changes generally do not correlate with changes in gene expression. Finally, we demonstrate methods by which data can be stratified in order to identify coupled changes in methylation and gene expression.

Keywords: DNA methylation; Salmonella; gene regulation; m6A; methylome; transcription.


Conflict of interest statement

The authors declare no conflict of interest.

Figures
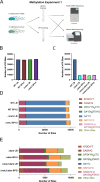
FIG 1
FIG 1
Genome-wide analysis of m6A DNA methylation under various conditions. (A) Schematic of methylation experiment 1. Wild-type S. Typhimurium (strain 14028s) and an isogenic ΔmetJ strain were cultured in LB or SPI-2-inducing media, and DNA was collected for SMRT-seq. Bacteria grown under identical conditions were harvested for RNA-sequencing. (B and C) The total number of m6A bases observed across conditions does not dramatically change in wild-type and ΔmetJ bacteria (B) but does change dramatically in Δdam bacteria (C). (D) Analysis of motifs methylated reveals only the total number of ATGCA*T and “other” sites (sites that do not map to one of the six motifs) changes dramatically across conditions. The roughly 20 sites that could not be distinguished between CAGA*G or GA*GN6RTAYG methylation are listed as “CAGA*G or GA*GN6RTAYG.” (E) Δdam mutation results in ablation of GATC methylation. For panels B through E, bases were only included in the analysis if the base could confidently be called methylated or unmethylated across the eight conditions.
FIG 2
FIG 2
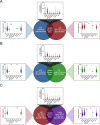
Integration of binary and quantitative analyses to understand differential methylation in S. Typhimurium. (A to C) Quantification of shared and unique methylated sites between wild-type S. Typhimurium grown in LB and SPI-2-inducing media (A), WT and ΔmetJ bacteria grown in LB (B), and WT and ΔmetJ bacteria grown in SPI-2-inducing media (C). Venn diagrams are based on binary measures of differential methylation. Sites identified by the binary analysis were examined in our quantitative data set in order to identify changes in the percent methylation. In the graphs, “Total” refers to all sites present in the relevant part of the Venn diagram, which were then broken down by motif. For motifs where no differentially methylated sites were present, a single dot is listed at 0%. For shared sites, the absolute value of the difference between bases are shown, and thus the numbers are agnostic to whether methylation is higher in either condition. Bars mark the median. For all panels, only bases that could be confidently called methylated or unmethylated under the eight conditions in Fig. 1 were considered.
FIG 3
FIG 3
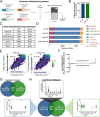
A replication screen reveals methylation is highly reproducible across SMRT-seq experiments but highlights the value of performing biological replicates. (A) Schematic for the replication methylation experiment. Wild-type S. Typhimurium (strain 14028s) or isogenic mutants were grown in LB media, and DNA was harvested for SMRT-seq. (B) Approximately 97% of all bases were called identically (methylated or unmethylated) in methylation experiment 1 and the replicate methylation experiments. (C) ATGCA*T and other sites had lower rates of replication compared to other motifs. (D) Only ATGCA*T and “other” sites (bases that do not map to one of the six motifs) change dramatically across tested conditions in the replication methylation experiment. No ATGCA*T methylation was observed in ΔyhdJ mutants. (E) The observed percent methylation at each base was reproducible across experiments. The color of the hexagon represents the number of bases that fall at that point on the axes. R2 values and trendlines represent the correlation across experiments. (F) Quantitative analysis reveals numerous sites are differentially methylated between wild-type and ΔmetJ bacteria. Each dot represents the mean percent methylation in wild-type bacteria across the two experiments subtracted by the mean methylation in ΔmetJ bacteria for each adenosine confidently called in both experiments. Blue and green dots mark bases where the mean difference is ≥10%. (G) Quantification of unique methylation sites in the replication experiment. For panels D to G, bases were only included in the analysis if the base could confidently be called methylated or unmethylated across conditions. (H) Venn diagram is based on binary measures of differential methylation in the combined data set. Sites identified by the binary analysis were examined in our quantitative data set in order to identify changes in the percent methylation. In the graphs, “Total” refers to all differentially methylated sites under that condition, and differentially methylated sites are then broken down by motif. For motifs where no differentially methylated sites were present, a single dot is listed at 0%. For shared sites, the absolute value of the difference between bases are shown and thus the numbers are agnostic to whether methylation is higher in either condition. Bars mark the median.
FIG 4
FIG 4
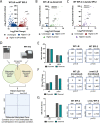
Differentially methylated genes by binary analysis are not enriched for transcriptomic changes (A to C) RNA-seq reveals transcriptomic changes between LB grown and SPI-2 media grown wild-type bacteria (A), wild-type and ΔmetJ bacteria grown in LB (B), and wild-type and ΔmetJ bacteria grown in SPI-2 media (C). Corrected P values generated by calculating the FDR. (D) Schematic of RNA-seq and SMRT-seq integration. Each gene was determined to be differentially methylated (differentially methylated gene [DMG]) in our binary analysis, differentially expressed (differentially expressed gene [DEG]; FDR < 0.05), differentially methylated and differentially expressed (DM and DE gene), or neither differentially methylated nor expressed. A Fisher exact test was then used to determine whether there was an association between methylation and gene expression. (E to G) Differential methylation is not associated with differential expression. Observed and expected numbers of differentially methylated and differentially expressed genes were not significantly different when comparing uniquely methylated genes in LB versus SPI-2 media (E), wild-type versus ΔmetJ in LB (F), or wild-type versus ΔmetJ bacteria in SPI-2 media (G). Uniquely methylated genes are plotted in the condition under which they are methylated (e.g., for panel E, a gene that contains a base that is methylated in LB but not SPI-2 media would be plotted as part of “LB”) but are agnostic to the direction of effect for the expression data. Expected values are calculated by multiplying the frequency of differential methylation by the frequency of differential expression by the total number of genes in the analysis for each condition. Numbers used for the Fisher exact test are shown on the right. Data for panels E and G used data from methylation experiment 1, panel F used the “combined data set.” For panels F and G, the gene metJ is removed from the analysis, as it is artificially called both differentially methylated and expressed due to its excision from the genome.
FIG 5
FIG 5
Quantitative analysis revealed an association between differential methylation and expression between wild-type and ΔmetJ bacteria. (A) Schematic of RNA-seq and SMRT-seq integration. Each gene in our quantitative analysis was determined to be differentially methylated (differentially methylated gene [DMG]: difference ≥10% methylation across conditions), differentially expressed (differentially expressed gene [DEG]: FDR corrected P value ≤0.05), differentially methylated and differentially expressed (DM and DE Gene), or neither differentially methylated nor expressed. A Fisher exact test was then used to determine whether there was an association between methylation and gene expression. (B to D) Differential methylation is typically not associated with differential expression. Observed and expected numbers of differentially methylated and differentially expressed genes were not significantly different when comparing uniquely methylated genes in LB versus SPI-2 media (B) or wild-type versus ΔmetJ bacteria in LB (C); however, a significant enrichment of DEGs was observed in hypermethylated sites in wild-type bacteria grown in SPI-2 media relative to ΔmetJ (D). Hypermethylated genes are plotted in a condition under which they have increased methylation (e.g., for panel B, a gene that contains a base that is more methylated in LB would be plotted as part of “LB”) but are agnostic to the direction of effect for the expression data. Expected values are calculated by multiplying the frequency of differential methylation by the frequency of differential expression by the total number of genes in the analysis for each condition. Numbers used for the Fisher exact test are shown on the right. Data for panels B and D used data from methylation experiment 1; data for panel C used the “combined data set.” For panels C and D, the gene metJ was removed from the analysis, as it is excised from the genome.
FIG 6
FIG 6
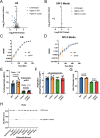
YhdJ has limited impacts on S. Typhimurium biology under standard laboratory conditions. (A and B). YhdJ has limited impacts on the S. Typhimurium transcriptome in LB (A) and SPI-2-inducing media (B). Corrected P values generated by calculating the FDR. (C and D) YhdJ is not required for S. Typhimurium growth in LB (C) or SPI-2-inducing media (D). Data from three independent experiments with time points taken every 30 min. Error bars represent the standard errors of the mean. (E and F) YhdJ is not required for S. Typhimurium uptake (E) or replication (F) in THP-1 monocytes. Cells were infected for 60 min with S. Typhimurium harboring an inducible-GFP plasmid before treatment with gentamicin. GFP was induced for 75 min before analysis by flow cytometry. The percent GFP+ and the median of the GFP+ cells were measured 3 and 24 h postinfection. Panel E shows the amount of invasion that occurred by reporting the percentage of infected cells at 3 h postinfection, and panel F shows the replication that occurred after infection by dividing the median of the GFP+ cells at 24 h postinfection by the median of the GFP+ cells at 3 h postinfection. Data are from two to three independent experiments; each dot represents an independent replicate, bars mark the mean, and error bars are the standard errors of the mean. For Panel E, data were normalized to the grand mean before plotting or performing statistics, and for panel F statistics were performed on the log transformed values. P values were generated by two-way analysis of variance (ANOVA) with Sidak’s multiple-comparison test. (G) YhdJ does not impact S. Typhimurium motility. Motility on soft agar was measured 6 h after inoculating the agar and after migration at 37°C. The data are from three independent experiments; each dot is the average of four to five technical replicates, bars mark the mean, and error bars mark the standard error of the mean. Data were normalized to the grand mean prior to plotting or performing statistics. P values were generated by one-way ANOVA with Sidak’s multiple-comparison test. (H) YhdJ is conserved across several Salmonella serovars. Salmonella genomes (1,000 Typhimurium, 1,000 Typhi, 1,000 Paratyphi A, 1,000 Paratyphi B, 999 Newport, 1,000 Dublin, 1,000 Enteritidis, 1,000 Agona, 1,000 Heidelberg, and 79 Derby genomes) were obtained from EnteroBase (94, 95). Genomes were combined into a single FASTA file per serovar and blasted against the S. Typhimurium strain 14028s YhdJ protein sequence using BLAST+ (96). The BLAST score from the top “n” hits were plotted, where “n” is the number of genomes analyzed for that serovar. A black bar represents the median. Dotted lines represent the BLAST score obtained when blasting the 14028s genome, and the score obtained from the 151* truncation prevalent in S. Paratyphi A serovars.
FIG 7
FIG 7
The stdA promoter has differential methylation after growth in LB or SPI-2-inducing media. (A) Schematic of the region upstream of stdA. The percent methylation values for each GATC site on both strands are graphed based on data from wild-type bacteria in methylation experiment 1. (B) stdA is differentially expressed in wild-type bacteria grown in LB and SPI-2-inducing media. RNA-seq experiment 1 values are from the RNA-seq experiment, including ΔmetJ bacteria, and are listed in Data Set S4. RNA-seq experiment 2 values are from the experiment, including ΔyhdJ bacteria, and are listed in Data Set S5.
FIG 8
FIG 8
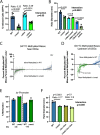
dam is epistatic to ΔmetJ despite limited changes to the ΔmetJ GA*TC methylome. (A) The impacts of ΔmetJ on invasion partially depend on dam. THP-1 monocytes were infected for 60 min with S. Typhimurium harboring an inducible-GFP plasmid before treatment with gentamicin. GFP was induced for 75 min before analysis by flow cytometry. The percent GFP+ was measured at 3 h postinfection. The data are from three experiments; each dot represents an independent replicate, the bars mark the mean, and the error bars are the standard errors of the mean. (B) The impact of ΔmetJ on motility depends entirely on dam. Motility on soft agar was measured 6 h after inoculating the agar and after migration at 37°C. The data are from three independent experiments; each dot is the mean of four to five technical replicates, bars mark the mean, and error bars mark the standard errors of the mean. (C and D) Quantitative analysis reveals subtle changes to the GA*TC methylome in ΔmetJ bacteria. Each dot represents the difference average percent methylation of GA*TC bases in which the closest gene in differentially expressed (C) or GA*TC bases specifically upstream of differentially expressed genes (D), between WT and ΔmetJ bacteria grown in LB. The data are in duplicate from the methylation experiment 1 and the replication methylation experiment, with error bars showing the error of the mean. Data from panel D are expanded in Table 4. For panels C and D, any base with greater than or less than 0 differential methylation is colored green (more methylated in ΔmetJ bacteria) or blue (more methylated in wild-type bacteria). (E) The tsr promoter is modestly hypermethylated in ΔmetJ. Percent methylation is plotted for the −146 and −145 GATC motifs from the methylation experiment 1 and the replication methylation experiment, with error bars showing the errors of the mean. Site numbering is relative to the start codon. (F) The impacts of the ΔmetJ mutation on motility are partially tsr dependent. The data are from three independent experiments; each dot is the mean of four to five technical replicates, bars mark the mean, and error bars mark the standard errors of the mean. For panels A, B, and F, data were normalized to the grand mean prior to plotting or performing statistics and P values were generated by two-way ANOVA with Sidak’s multiple-comparison test.

Similar articles

Cited by

References

    1. Frommer M, McDonald LE, Millar DS, Collis CM, Watt F, Grigg GW, Molloy PL, Paul CL. 1992. A genomic sequencing protocol that yields a positive display of 5-methylcytosine residues in individual DNA strands. Proc Natl Acad Sci USA 89:1827–1831. doi:10.1073/pnas.89.5.1827. - DOI - PMC - PubMed
    1. Loenen WA, Dryden DT, Raleigh EA, Wilson GG, Murray NE. 2014. Highlights of the DNA cutters: a short history of the restriction enzymes. Nucleic Acids Res 42:3–19. doi:10.1093/nar/gkt990. - DOI - PMC - PubMed
    1. Glickman BW, Radman M. 1980. Escherichia coli mutator mutants deficient in methylation-instructed DNA mismatch correction. Proc Natl Acad Sci USA 77:1063–1067. doi:10.1073/pnas.77.2.1063. - DOI - PMC - PubMed
    1. Pukkila PJ, Peterson J, Herman G, Modrich P, Meselson M. 1983. Effects of high levels of DNA adenine methylation on methyl-directed mismatch repair in Escherichia coli. Genetics 104:571–582. doi:10.1093/genetics/104.4.571. - DOI - PMC - PubMed
    1. Glickman BW. 1979. Spontaneous mutagenesis in Escherichia coli strains lacking 6-methyladenine residues in their DNA: an altered mutational spectrum in dam- mutants. Mutat Res 61:153–162. doi:10.1016/0027-5107(79)90122-2. - DOI - PubMed

Publication types

Substances

LinkOut - more resources