

Investigating the Role of Spermidine in a Model System of Alzheimer's Disease Using Correlative Microscopy and Super-resolution Techniques
- PMID: 35656544
- PMCID: PMC9152225
- DOI: 10.3389/fcell.2022.819571
Investigating the Role of Spermidine in a Model System of Alzheimer's Disease Using Correlative Microscopy and Super-resolution Techniques
Abstract
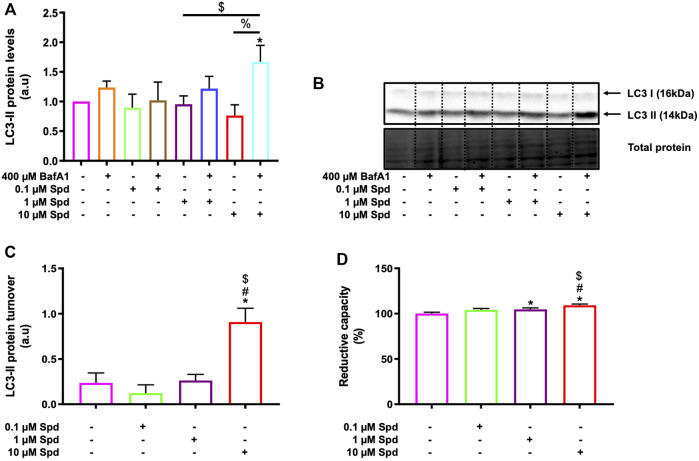
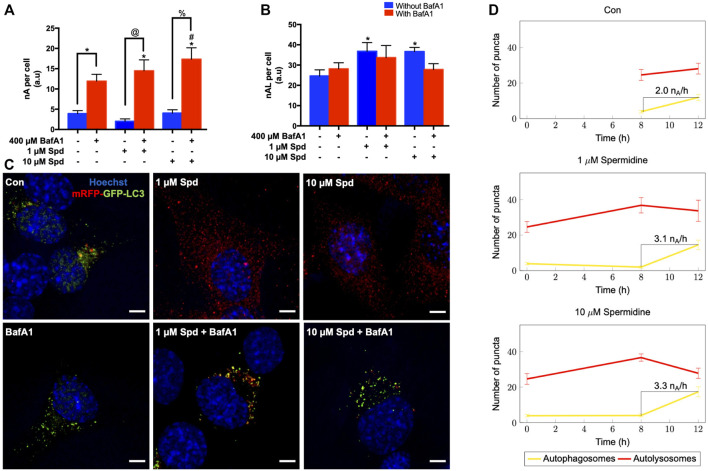
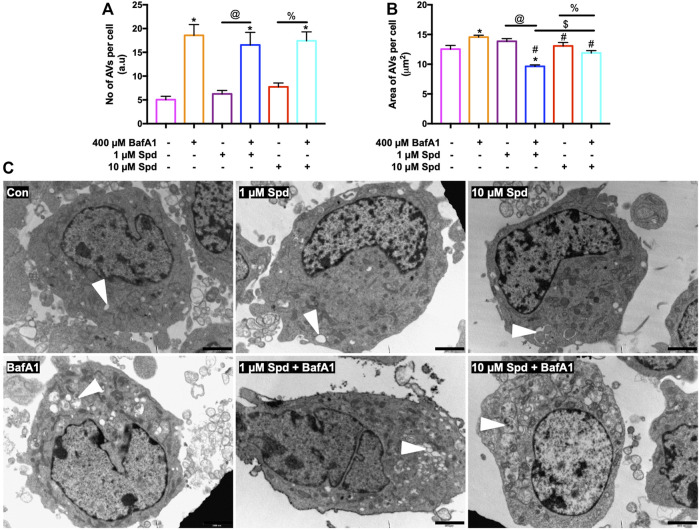
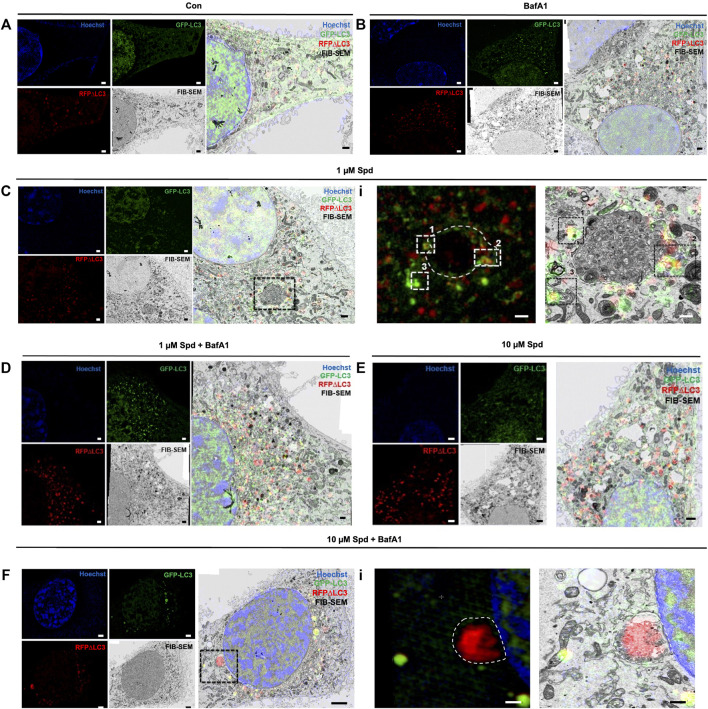
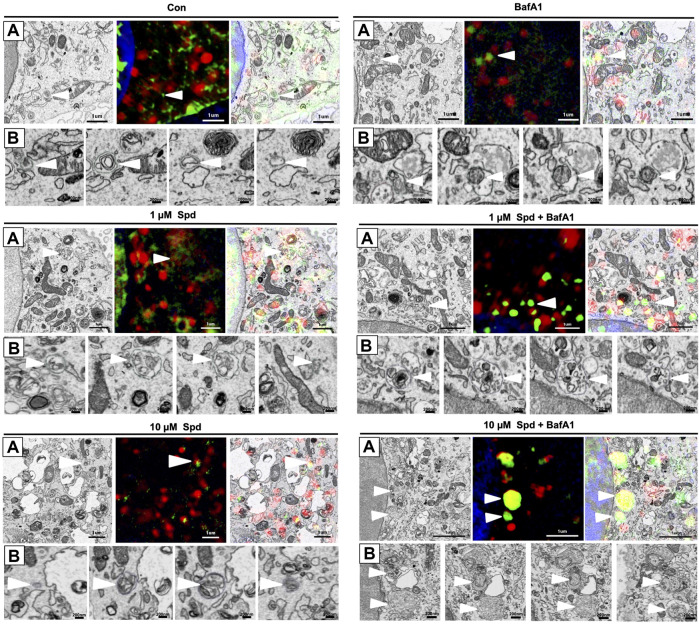
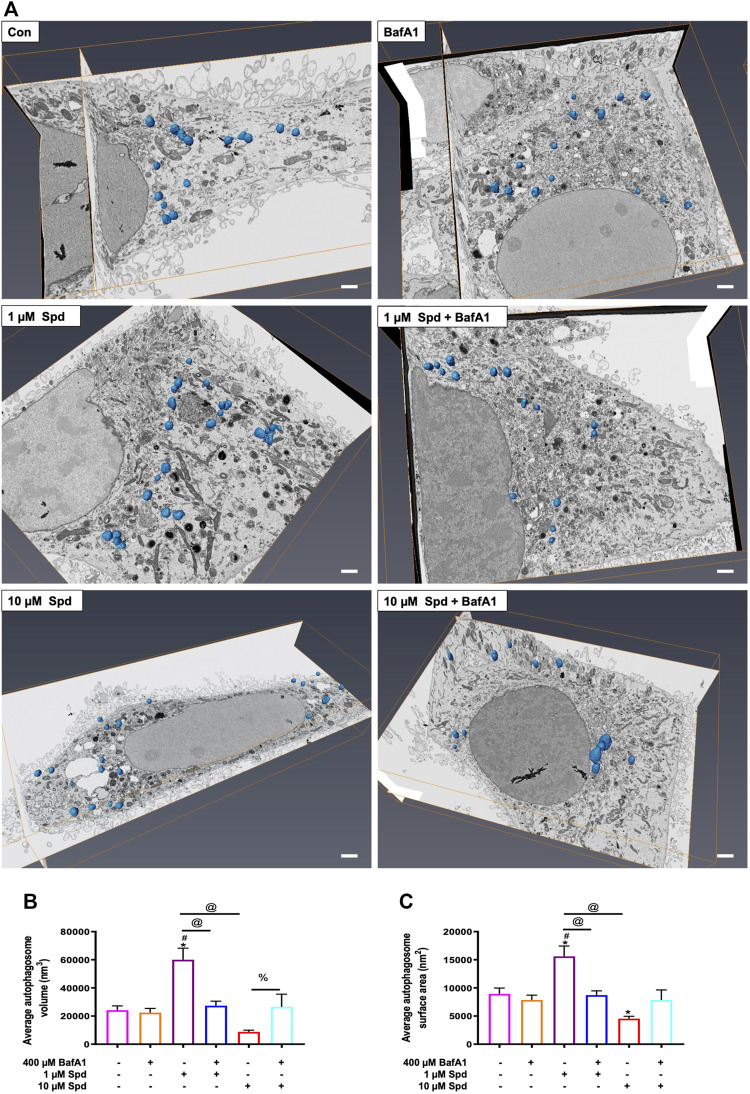
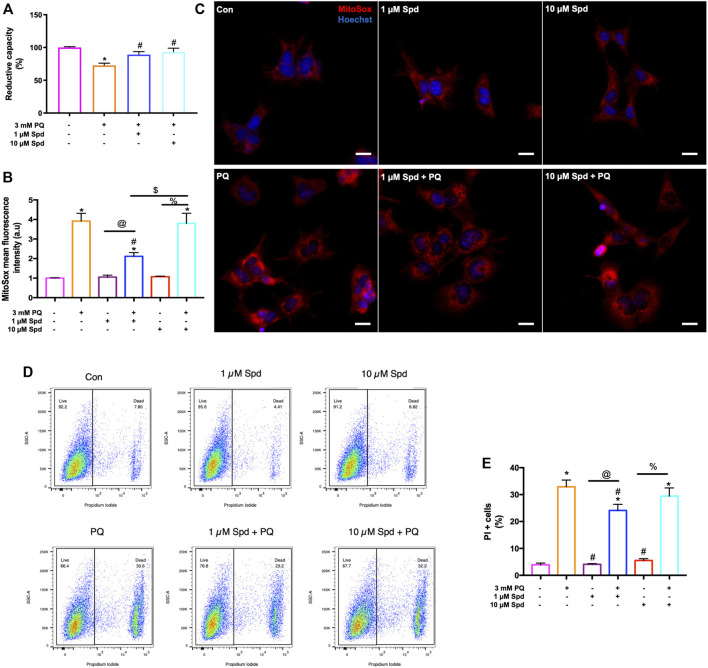
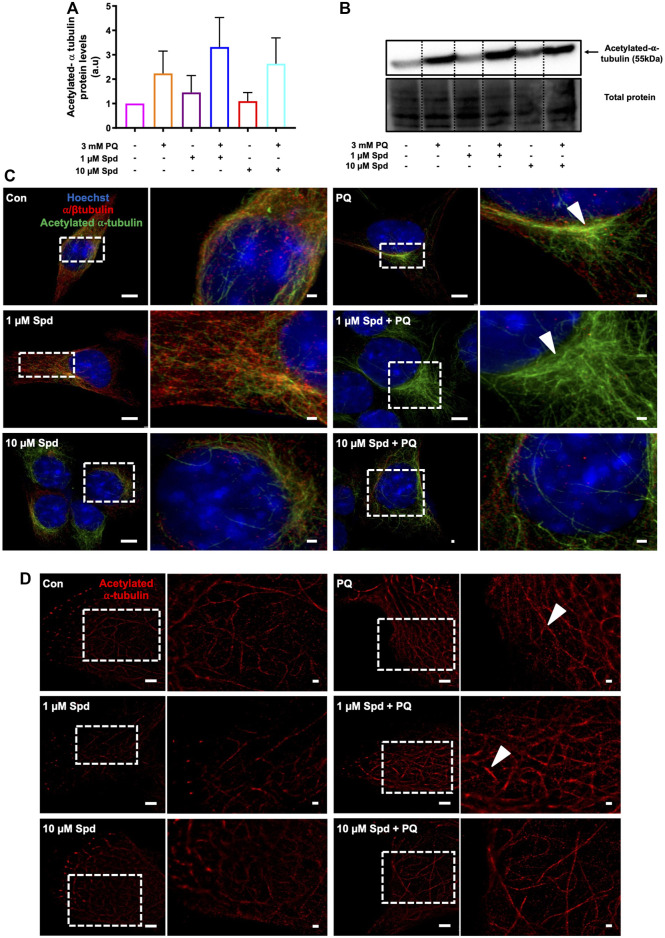
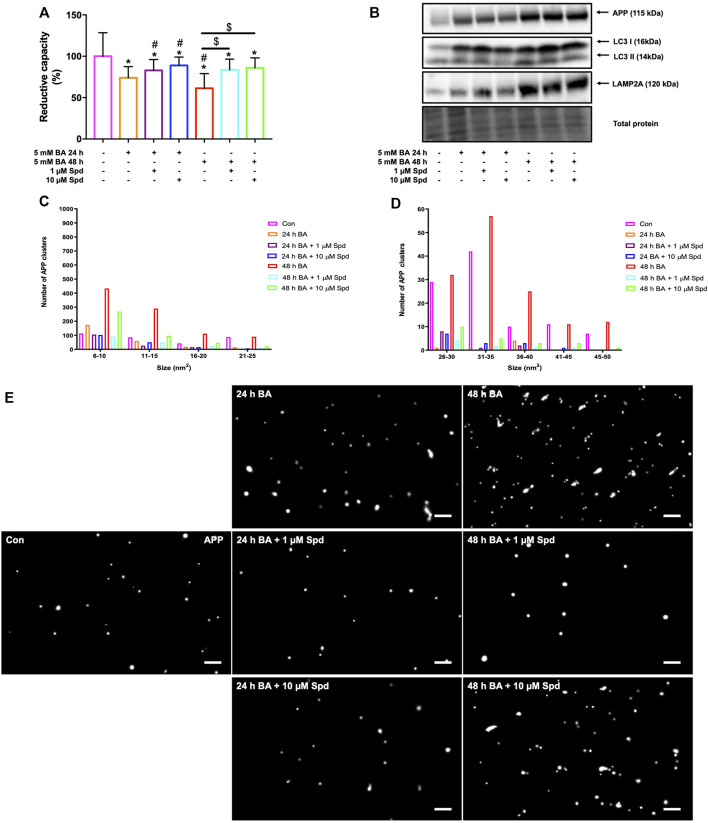
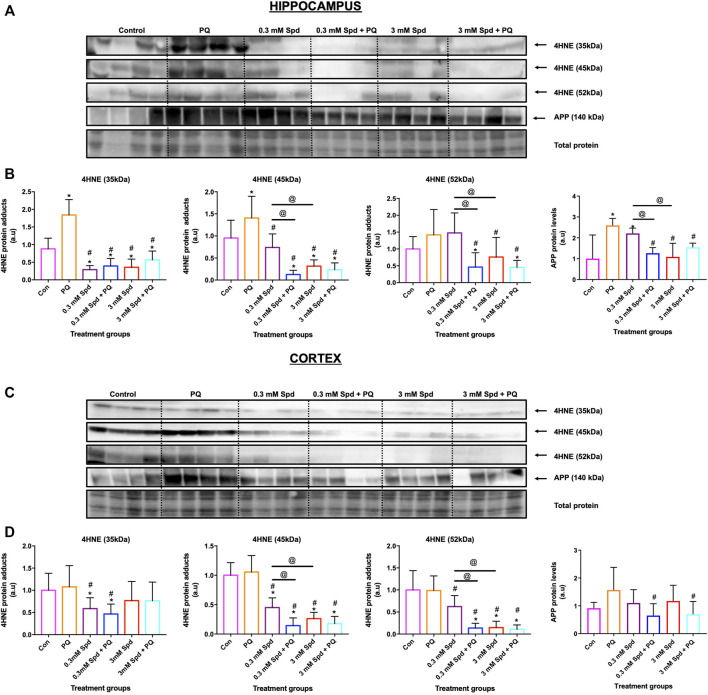
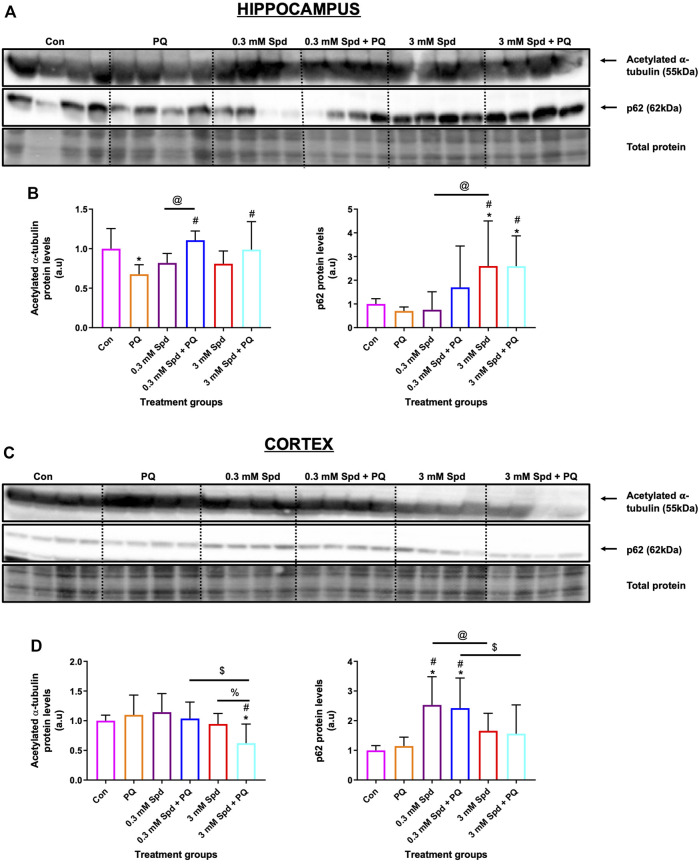
Background: Spermidine has recently received major attention for its potential therapeutic benefits in the context of neurodegeneration, cancer, and aging. However, it is unclear whether concentration dependencies of spermidine exist, to differentially enhance autophagic flux. Moreover, the relationship between low or high autophagy activity relative to basal neuronal autophagy flux and subsequent protein clearance as well as cellular toxicity has remained largely unclear. Methods: Here, we used high-resolution imaging and biochemical techniques to investigate the effects of a low and of a high concentration of spermidine on autophagic flux, neuronal toxicity, and protein clearance in in vitro models of paraquat (PQ) induced neuronal toxicity and amyloid precursor protein (APP) overexpression, as well as in an in vivo model of PQ-induced rodent brain injury. Results: Our results reveal that spermidine induces autophagic flux in a concentration-dependent manner, however the detectable change in the autophagy response critically depends on the specificity and sensitivity of the method employed. By using correlative imaging techniques through Super-Resolution Structured Illumination Microscopy (SR-SIM) and Focused Ion Beam Scanning Electron Microscopy (FIB-SEM), we demonstrate that spermidine at a low concentration induces autophagosome formation capable of large volume clearance. In addition, we provide evidence of distinct, context-dependent protective roles of spermidine in models of Alzheimer's disease. In an in vitro environment, a low concentration of spermidine protected against PQ-induced toxicity, while both low and high concentrations provided protection against cytotoxicity induced by APP overexpression. In the in vivo scenario, we demonstrate brain region-specific susceptibility to PQ-induced neuronal toxicity, with the hippocampus being highly susceptible compared to the cortex. Regardless of this, spermidine administered at both low and high dosages protected against paraquat-induced toxicity. Conclusions: Taken together, our results demonstrate that firstly, administration of spermidine may present a favourable therapeutic strategy for the treatment of Alzheimer's disease and secondly, that concentration and dosage-dependent precision autophagy flux screening may be more critical for optimal autophagy and cell death control than previously thought.
Keywords: Alzheimer’s disease; autophagy; correlative light and electron microscopy; direct stochastic optical reconstruction microscopy; focused ion beam scanning electron microscopy; spermidine; super-resolution structured illumination.
Copyright © 2022 Lumkwana, Peddie, Kriel, Michie, Heathcote, Collinson, Kinnear and Loos.
Conflict of interest statement
The authors declare that the research was conducted in the absence of any commercial or financial relationships that could be construed as a potential conflict of interest.
Figures
Similar articles
-
Neurons die with heightened but functional macro- and chaperone mediated autophagy upon increased amyloid-ß induced toxicity with region-specific protection in prolonged intermittent fasting.Exp Cell Res. 2021 Nov 15;408(2):112840. doi: 10.1016/j.yexcr.2021.112840. Epub 2021 Oct 9. Exp Cell Res. 2021. PMID: 34624324
-
Impairment of Atg5-dependent autophagic flux promotes paraquat- and MPP⁺-induced apoptosis but not rotenone or 6-hydroxydopamine toxicity.Toxicol Sci. 2013 Nov;136(1):166-82. doi: 10.1093/toxsci/kft188. Epub 2013 Aug 31. Toxicol Sci. 2013. PMID: 23997112 Free PMC article.
-
Autophagic flux control in neurodegeneration: Progress and precision targeting-Where do we stand?Prog Neurobiol. 2017 Jun;153:64-85. doi: 10.1016/j.pneurobio.2017.03.006. Epub 2017 Apr 3. Prog Neurobiol. 2017. PMID: 28385648 Review.
-
Monitoring autophagy using super-resolution structured illumination and direct stochastic optical reconstruction microscopy.Methods Cell Biol. 2021;165:139-152. doi: 10.1016/bs.mcb.2020.12.005. Epub 2021 Jan 30. Methods Cell Biol. 2021. PMID: 34311863
-
Neuronal autophagy: self-eating or self-cannibalism in Alzheimer's disease.Neurochem Res. 2013 Sep;38(9):1769-73. doi: 10.1007/s11064-013-1082-4. Epub 2013 Jun 5. Neurochem Res. 2013. PMID: 23737325 Free PMC article. Review.
Cited by
-
Antisecretory Factor 16 (AF16): A Promising Avenue for the Treatment of Traumatic Brain Injury-An In Vitro Model Approach.J Mol Neurosci. 2024 Nov 7;74(4):106. doi: 10.1007/s12031-024-02268-6. J Mol Neurosci. 2024. PMID: 39505761 Free PMC article.
-
The Highs and Lows of Memantine-An Autophagy and Mitophagy Inducing Agent That Protects Mitochondria.Cells. 2023 Jun 27;12(13):1726. doi: 10.3390/cells12131726. Cells. 2023. PMID: 37443760 Free PMC article.
-
Natural Autophagy Activators to Fight Age-Related Diseases.Cells. 2024 Sep 26;13(19):1611. doi: 10.3390/cells13191611. Cells. 2024. PMID: 39404375 Free PMC article. Review.
-
Spermidine Rescues Bioenergetic and Mitophagy Deficits Induced by Disease-Associated Tau Protein.Int J Mol Sci. 2023 Mar 10;24(6):5297. doi: 10.3390/ijms24065297. Int J Mol Sci. 2023. PMID: 36982371 Free PMC article.
-
Changes in the Localization of Polyamine Spermidine in the Rat Retina with Age.Biomedicines. 2023 Mar 24;11(4):1008. doi: 10.3390/biomedicines11041008. Biomedicines. 2023. PMID: 37189626 Free PMC article.
References
-
- Amaravadi R. K., Kimmelman A. C., Debnath J. (2019). Targeting Autophagy in Cancer: Recent Advances and Future Directions. Cancer Discov. 9, 1167–1181. 10.1158/2159-8290.CD-19-0292 - DOI - PMC - PubMed
-
- Baltazar M. T., Dinis-Oliveira R. J., de Lourdes Bastos M., Tsatsakis A. M., Duarte J. A., Carvalho F. (2014). Pesticides Exposure as Etiological Factors of Parkinson's Disease and Other Neurodegenerative Diseases-A Mechanistic Approach. Toxicol. Lett. 230, 85–103. 10.1016/j.toxlet.2014.01.039 - DOI - PubMed
-
- Bogovic J. A., Hanslovsky P., Wong A., Saalfeld S. (2016). “Robust Registration of Calcium Images by Learned Contrast Synthesis,” in 2016 IEEE 13th International Symposium on Biomedical Imaging (ISBI 2016), Prague, Czech Republic, 13–16 April, 2016. 10.1109/ISBI.2016.7493463 - DOI
LinkOut - more resources
Full Text Sources
Research Materials