

Quantitative parameters of diffusion tensor imaging in the evaluation of carpal tunnel syndrome
- PMID: 35655836
- PMCID: PMC9131322
- DOI: 10.21037/qims-21-910
Quantitative parameters of diffusion tensor imaging in the evaluation of carpal tunnel syndrome
Abstract
Background: To explore the value of diffusion tensor imaging (DTI)-derived metrics in quantitative evaluation of carpal tunnel syndrome (CTS).
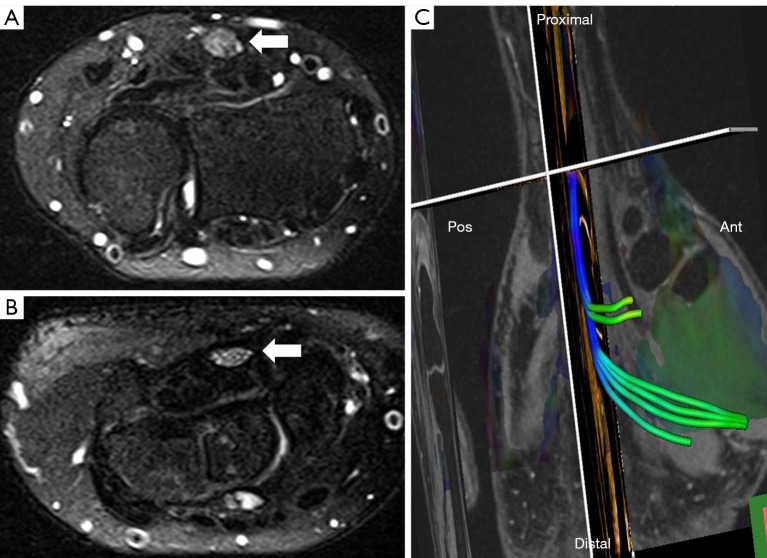
Methods: This prospective cross-sectional study included 39 wrists from 24 symptomatic CTS patients, who underwent clinical, electrophysiological, and magnetic resonance imaging (MRI) evaluations. In addition, 10 wrists of 6 healthy participants were included as controls. Clinical and nerve conduction study (NCS) findings were evaluated and graded according to the Boston Carpal Tunnel Questionnaire (BCTQ) and the American Association of Neuromuscular and Electrodiagnostic Medicine (AANEM), respectively. We performed MRI using a 1.5 Tesla scanner. Mean diffusivity (MD), fractional anisotropy (FA), axial diffusivity (AD), and radial diffusivity (RD) of the median nerve at the distal radioulnar joint (DRUJ) (d), the inlet of the carpal tunnel (CT) at the pisiform level (i), the middle of the CT (m) and the outlet of the CT at the level of the hook of hamate (o), cross-sectional area at the inlet of the CT (iCSA), and the difference between MD and FA of the DRUJ and the outlet of CT (Delta MD and Delta FA) were measured.
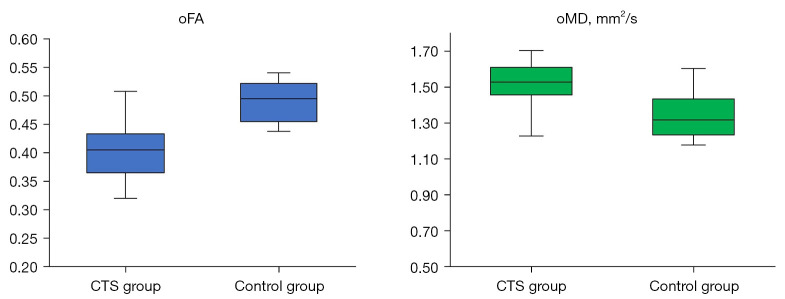
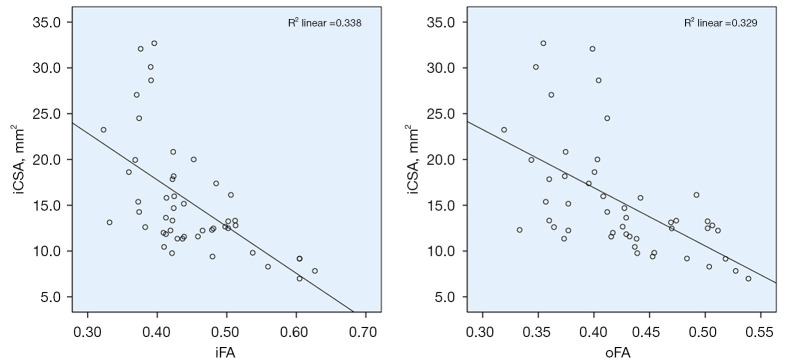
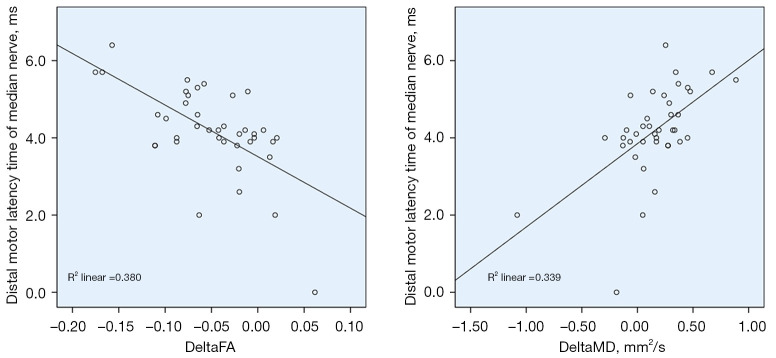
Results: The CTS patients had significantly lower FA [for example, oFA: mean difference 0.09, 95% confidence interval (CI): 0.05 to 0.12] and significantly higher MD than healthy participants (for example, iMD: mean difference 0.3, 95% CI: 0.03 to 0.57). There was a negative correlation between iCSA with iFA and between mFA and oFA (-0.5<R<-0.4). There was a positive correlation between distal motor latency time and Delta MD (R=0.57) and a negative correlation between distal motor latency time and Delta FA (R=-0.51). The FA demonstrated a somewhat strong negative correlation with the Boston scores for symptom and function.
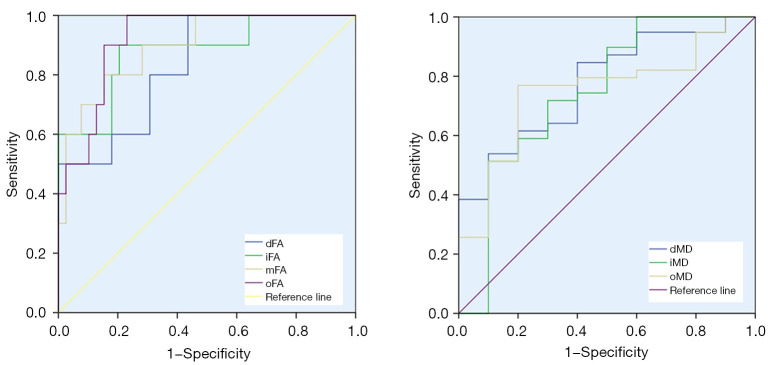
Conclusions: The DTI-derived quantitative metrics add potential value to the evaluation of CTS. Alterations in the FA of the median nerve along the CT are the most significant features of CTS and reflect the degree of median nerve compression and clinical deficit. With a cutoff value of 0.45, FA at the carpal outlet has a sensitivity and specificity of 87.5% and 85.7% in the diagnosis of CTS, respectively.
Keywords: Boston Carpal Tunnel Questionnaire; Carpal tunnel syndrome (CTS); apparent diffusion coefficient (ADC); diffusion tensor imaging (DTI); fraction anisotropy; magnetic resonance imaging (MRI); nerve conduction study (NCS).
2022 Quantitative Imaging in Medicine and Surgery. All rights reserved.
Conflict of interest statement
Conflicts of Interest: All authors have completed the ICMJE uniform disclosure form (available at https://qims.amegroups.com/article/view/10.21037/qims-21-910/coif). The authors have no conflicts of interest to declare.
Figures
Similar articles
-
Diffusion tensor imaging findings of the median nerve before and after carpal tunnel corticosteroid injection in patients with carpal tunnel syndrome: a preliminary study.Acta Radiol. 2019 Mar;60(3):347-355. doi: 10.1177/0284185118784977. Epub 2018 Jul 6. Acta Radiol. 2019. PMID: 29979105
-
Magnetic resonance imaging as a first-choice imaging modality in carpal tunnel syndrome: new evidence.Acta Radiol. 2023 Feb;64(2):675-683. doi: 10.1177/02841851221094227. Epub 2022 Apr 18. Acta Radiol. 2023. PMID: 35437022
-
MRI of wrist and diffusion tensor imaging of the median nerve in patients with carpal tunnel syndrome.J Neurosci Rural Pract. 2023 Apr-Jun;14(2):302-307. doi: 10.25259/JNRP_57_2022. Epub 2023 Mar 16. J Neurosci Rural Pract. 2023. PMID: 37181193 Free PMC article.
-
Can Diffusion Tensor Imaging Apparent Diffusion Coefficient Diagnose Carpal Tunnel Syndrome? A Systematic Review and Meta-Analysis.Hand (N Y). 2023 Jan;18(1_suppl):91S-99S. doi: 10.1177/15589447221096706. Epub 2022 Jun 13. Hand (N Y). 2023. PMID: 35695339 Free PMC article. Review.
-
Meta-analysis of the normal diffusion tensor imaging values of the median nerve and how they change in carpal tunnel syndrome.Sci Rep. 2021 Oct 22;11(1):20935. doi: 10.1038/s41598-021-00353-z. Sci Rep. 2021. PMID: 34686721 Free PMC article. Review.
Cited by
-
A diminished sciatic nerve structural integrity is associated with distinct peripheral sensory phenotypes in individuals with type 2 diabetes.Diabetologia. 2024 Feb;67(2):275-289. doi: 10.1007/s00125-023-06050-y. Epub 2023 Nov 29. Diabetologia. 2024. PMID: 38019287 Free PMC article.
References
LinkOut - more resources
Full Text Sources
Research Materials
Miscellaneous