. 2022 Jun;25(6):688-701.
doi: 10.1038/s41593-022-01084-8. Epub 2022 Jun 2.

Faulty autolysosome acidification in Alzheimer's disease mouse models induces autophagic build-up of Aβ in neurons, yielding senile plaques

Affiliations

Faulty autolysosome acidification in Alzheimer's disease mouse models induces autophagic build-up of Aβ in neurons, yielding senile plaques

Ju-Hyun Lee et al. Nat Neurosci. 2022 Jun.

Abstract

Autophagy is markedly impaired in Alzheimer's disease (AD). Here we reveal unique autophagy dysregulation within neurons in five AD mouse models in vivo and identify its basis using a neuron-specific transgenic mRFP-eGFP-LC3 probe of autophagy and pH, multiplex confocal imaging and correlative light electron microscopy. Autolysosome acidification declines in neurons well before extracellular amyloid deposition, associated with markedly lowered vATPase activity and build-up of Aβ/APP-βCTF selectively within enlarged de-acidified autolysosomes. In more compromised yet still intact neurons, profuse Aβ-positive autophagic vacuoles (AVs) pack into large membrane blebs forming flower-like perikaryal rosettes. This unique pattern, termed PANTHOS (poisonous anthos (flower)), is also present in AD brains. Additional AVs coalesce into peri-nuclear networks of membrane tubules where fibrillar β-amyloid accumulates intraluminally. Lysosomal membrane permeabilization, cathepsin release and lysosomal cell death ensue, accompanied by microglial invasion. Quantitative analyses confirm that individual neurons exhibiting PANTHOS are the principal source of senile plaques in amyloid precursor protein AD models.


Conflict of interest statement

All authors declare no competing interests.

Figures
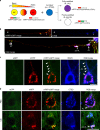
Fig. 1
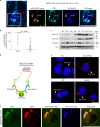
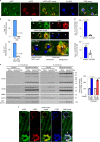
Fig. 1. Design and expression of dual-tagged autophagy sensor in TRGL mouse brain.
a, Schematic representation of the tfLC3 color change. The sensor is composed of pH-resistant mRFP, pH-sensitive eGFP and LC3. An acidic environment triggers the quenching of the eGFP signal, resulting in the conversion of net yellow signal to red-only signal. In combination with LY marker (pseudo-blue), fully acidified AL (AL) or poorly acidified AL (pa-AL) produce purple or white color, respectively. b, tfLC3 fluorescence change in primary neurons. APs (double arrowheads) were seen at distal levels of axons, and pa-ALs (asterisk) were seen at more proximal levels, whereas fully acidified ALs (arrowhead) were predominantly located near or in the perikaryon. c, Representative fluorescence images from neocortical layer V neurons of TRGL mice co-labeled with the cytoskeleton marker MAP2. Arrowhead denotes fully acidified AL (AL). Scale bar, 10 μm. d, Representative fluorescence images of the tfLC3 fluorescence change under lysosomal acidification altered conditions (CQ) in TRGL mouse brain. Arrowheads denote AL or pa-AL. Scale bar, 20 μm. bd, Experiment was repeated three times independently with similar results.
Fig. 2
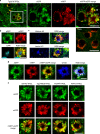
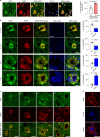
Fig. 2. AL acidification deficits develop early in AD model mice and progress with age.
a, Representative fluorescence images of tfLC3, co-labeled with CTSD, in neocortical neurons of 5-month-old TRGL and Tg2576/TRGL mouse brains. ALs exhibit a red or purple color without or with CTSD co-localization, respectively, whereas pa-ALs exhibit a yellow or white signal depending on CTSD co-label, respectively. Scale bar, 20 μm. b, Number of pa-ALs in 5-month-old Tg2576/TRGL is elevated compared to neurons in TRGL littermates. n = 243 (TRGL) and n = 245 (Tg2576/TRGL) neurons from three mice. c, pa-AL size in 5-month-old Tg2576/TRGL are larger than neurons in TRGL littermates. n = 243 (TRGL) and n = 245 (Tg2576/TRGL) neurons from three mice. d, Lysosomal vATPase activity is decreased in 6-month-old male Tg2576 compared to WT littermate neocortex. n = 3 mice. e, Representative fluorescence images of 12-month-old TRGL and Tg2576/TRGL mouse brains. Scale bar, 20 μm. f, Number of pa-ALs in 12-month-old Tg2576/TRGL are elevated compared to TRGL littermate neocortical neurons and to 5-month-old Tg2576/TRGL. n = 202 (TRGL) and n = 213 (Tg2576/TRGL) neurons from three mice. g, Lysosomal vATPase activity is decreased in 12-month-old male Tg2576 compared to WT littermates (and greater than in 6-month-old Tg2576). n = 5 mice. Violin plot colors correspond to the colors of the puncta (white: pa-AL; purple: AL). h, Time course analysis of vATPase activity and pa-AL number in Tg2576 mice. vATPase activity: n = 3 (1.6 months and 5 months) and n = 5 (12 months). pa-AL: n = 243 (1.6 months), n = 245 (5 months) and n = 213 (12 months). Quantitative data are presented as means ± s.e.m., unpaired t-test, two-tailed P value as indicated. a, e, Experiment was repeated three times independently with similar results. See also Extended Data Fig. 1. mo, month; rel., relative. Source data
Fig. 3
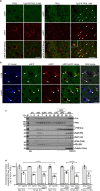
Fig. 3. Intraneuronal APP-βCTF/Aβ accumulates selectively within pa-AL in AD mice.
a, Immunofluorescence co-labeling of 5-month-old Tg2576/TRGL mouse brain neurons with a CTSD antibody and JRF/AβN/25 antibody against APP-βCTF/Aβ. APP-βCTF/Aβ accumulates in enlarged pa-ALs producing a white signal (arrow), whereas it is absent from LYs (arrowhead). Scale bar, 20 μm. b, Percentage of AL and pa-AL subtypes positive for JRF/AβN/25 immunoreactivity in neurons of 5-month-old Tg2576/TRGL mouse brains. n = 66 neurons from three mice. Violin plot colors correspond to the colors of the puncta (white: pa-AL; purple: AL). Quantitative data are presented as means ± s.e.m., unpaired t-test, two-tailed P value as indicated. c, AV fractionation from 10-month-old Tg2576 mice. Fractions were obtained by pooling five mouse brains. The experiment was repeated two times independently with similar results. d, Schematic representation of the PLA performed using JRF/AβN/25 for APP-βCTF N-terminus and APPc for APP-βCTF C-terminus. e, Representative PLA fluorescence images from N2A-APPswe cells and 10-month-old Tg2576 mouse brain compared to WT controls. Arrowheads denote PLA signal for APP-βCTF. Scale bar, 20 μm. f, Representative PLA fluorescence images from Tg2576/TRGL mouse brain. PLA signals were co-localized with pa-AL, resulting in white puncta. Scale bar, 20 μm. a, c, e, f, The experiment was repeated three times independently with similar results. See also Extended Data Fig. 2. IHC, immunohistochemistry; mo, month. Source data
Fig. 4
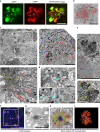
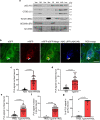
Fig. 4. tfLC3 probe reveals a unique pattern of autophagic stress, AL pH deficit and plasma membrane blebbing (‘PANTHOS’) in five different AD mouse models.
a, Representative tfLC3 fluorescence images of 10-month-old Tg2576/TRGL mouse brain depicting neurons at three stages of PANTHOS (i: early pH change in AL; ii: focal PM bulging as pa-ALs enlarge and proliferate (arrowhead); iii: full PANTHOS pattern (arrow)). (See graphic representation of these stages in Extended Data Fig. 8). A control TRGL neuron (5th panel in a) exhibits fully acidified ALs. Scale bar, 20 μm. b, Staining of PANTHOS neurons using nuclear marker (DAPI) in 10-month-old Tg2576/TRGL mouse brain. Scale bar, 10 μm. c, IHF staining of PANTHOS neurons using nuclear markers (histone H3 and lamin A/C) in 10-month-old Tg2576/TRGL mouse brain. Scale bar, 10 μm. See also Extended Data Fig. 2. d, IHF staining of LY marker (CTSD) in 10-month-old Tg2576/TRGL mouse brain. Scale bar, 10 μm. e, PANTHOS pattern is conserved across four additional AD mouse models. Male 5xFAD/TRGL (2.7 months) and male TgCRND8/TRGL (1.9 months) and female PSAPP/TRGL (3.1 months) and female APP51/TRGL (20 months) were imaged. Scale bar, 10 μm. ae, The experiment was repeated three times independently with similar results. See also Extended Data Fig. 3. PM, plasma membrane.
Fig. 5
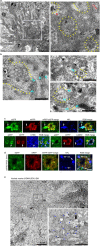
Fig. 5. Ultrastructural characterization of PANTHOS neurons in an AD mouse model.
Confocal image of a PANTHOS neuron exhibiting many tfLC3-positive (AV-filled) blebs with tapered necks arising from the perikaryon. N denotes nucleus area. See also in Extended Data Fig. 4. Scale bar, 10 μm. b, Representative EM image of a PANTHOS neuron depicting AV-filled blebs projecting from the perikaryal plasma membrane via necks that are continuous with perikaryal cytoplasm (arrow). 2.7-month-old 5xFAD/TRGL mouse brain. Scale bar, 20 μm. c, EM image of a PANTHOS neuron from a 5-month-old 5xFAD/TRGL mouse brain. Scale bar, 5 μm. Box i: AV-filled peripheral plasmalemmal blebs (blebs membrane boundary: arrowheads). Scale bar, 2 μm. Box ii: a centrally located electron-dense network of radiating membrane-bound tubular extensions (red arrowheads) containing incorporated AVs (yellow arrows). Scale bar, 1 μm. d, EM images for the spatial relationship between AVs and tubular extensions within which thin fiber bundles are visible (light blue arrowheads: AV/tubule contact sites). Scale bar, 500 nm. Full-resolution images for c and d are presented as Extended Data Fig. 5. e, Representative perikaryal blebs extending from the plasma membrane of a PANTHOS neuron. PS/APP mouse brain, labeling by acid phosphatase (ACPase) cytochemistry, a marker of AL/LY, reveals the fulminant autophagy pathology (mainly ALs) segregated into blebs. Scale bar, 5 μm. Box i: Enlarged EM image of the ROI area (box) depicting a bleb (white arrowhead) and long cytoplasmic neck (outlined by yellow arrowheads). Scale bar, 1 μm. f, Immunohistochemistry image of the ROI (box) used for serial SEM imaging of the 2.7-month-old 5xFAD/TRGL mouse brain. Scale bar, 40 μm. g, z-stacked serial SEM image, 370–430, of the ROI area. Scale bar, 40 μm. Arrow indicates the PANTHOS of interest; arrowheads indicate adjusted reference PANTHOS. Bleb tracing (h) and 3D reconstruction of the PANTHOS (i) using IMOD modeling. The experiment was repeated three (ae) or two (fi) times independently with similar results. See also Supplementary Fig. 1 and Video 1.
Fig. 6
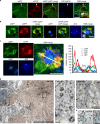
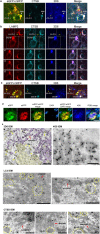
Fig. 6. Evolution of intraneuronal β-amyloid accretion and distribution in PANTHOS neurons in brains of AD mouse models.
a, IHF co-labeling of 2.7-month-old male 5xFAD/TRGL mouse brain neurons with JRF/AβN/25 monoclonal antibody against APP-βCTF/Aβ. Scale bar, 10 μm. b, IHF labeling of Aβ (4G8) and DAPI stain. Perinuclear intraneuronal Aβ accumulation surrounding a visible DAPI-positive nucleus within a PANTHOS neuron. Inset depicts Aβ in a bleb of the PANTHOS neuron. Scale bar, 10 μm. c, Immunofluorescence staining of a DAPI-labeled PANTHOS neuron using 4G8 antibody followed by fluorescence intensity analysis. Perinuclear Aβ accumulates within a PANTHOS neuron. The white line in the merged image indicates the scan path through the PANTHOS neuron from which fluorescence intensity is determined spatially for each fluorophore. Scale bar, 10 μm. d, Representative Aβ IEM (3D6) image demonstrates extensive AV-filled blebbing of the PM in a PANTHOS neuron (colorized light pink) and, by comparison, two profiles (blue coloration) tentatively identified as DNs in a 5-month-old 5xFAD/TRGL mouse brain. Scale bar, 10 μm. Box i depicts Aβ immunoreactive AVs in the bleb. Box ii depicts overlap of Aβ immunoreactivity with the central nuclear area that also displays the electron-dense network of radiating membrane-bound tubular extensions, which are strongly Aβ immunoreactive. Yellow arrows indicate AVs incorporated into the central amyloid-positive network. Scale bar, 500 nm. e, Representative amyloid (3D6) IEM image. Light-blue arrowheads denote vesicle and amyloid bundle contact sites. ad, The experiment was repeated three times independently with similar results. Scale bar, 1 μm. See also Extended Data Fig. 6. PM, plasma membrane.
Fig. 7
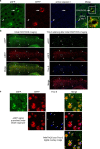
Fig. 7. PANTHOS neurodegeneration coincides with β-amyloid plaque formation and subsequent lysosomal neuronal cell death.
a, Aβ antibody 3D6 detecting the appearance of amyloid plaques in 5xFAD mice (2.7-month-old male) demonstrates co-incidence with the presence of a PANTHOS neuron. Scale bar, 20 μm. b, Quantitative percentage of PANTHOS neurons that are 3D6-positive (top) and percentage of PANTHOS among 3D6-positive plaques that are associated with PANTHOS (bottom)—with PANTHOS (91.7 ± 0.5%), without PANTHOS (8.3 ± 0.5%), with 3D6 (100 ± 0%), without 3D6 (0 ± 0%). n = 3 mice. c, DAPI staining depicting various stages of PANTHOS development and ultimate disappearance of detectable DAPI (although not necessarily nuclear marker IR; see Extended Data Fig. 5e). Normal DAPI-labeled nucleus (double arrow), condensed DAPI signal (single arrow) and non-detectable DAPI in very advanced PANTHOS neuron (arrowhead). Scale bar, 10 μm. d, Percentage of PANTHOS neurons with detectable DAPI label in 2.7-month-old or 6-month-old 5xFAD/TRGL mouse brain. 2.7 months: with DAPI (91.4 ± 1.3%) and without DAPI (8.6 ± 1.3%); 6 months: with DAPI (67.8 ± 4.5%) and without DAPI (32.2 ± 4.5%). n = 6 (two sections per mouse, three mice; 94 neurons in cortex area were counted). e, Lysosomal enzyme distribution in cytosol and membrane/vesicle fraction in 2.7-month-old and 6-month-old 5xFAD and WT male mouse cortex. Cytosolic CTSD: 2.7 months (99.8 ± 1.9%) and 6 months (260.4 ± 3.1%); cytosolic CTSB: 2.7 months (103.8 ± 1.6%) and 6 months (238.5 ± 5.9%). n = 3 mice per each genotype. f, Immunofluorescence labeling of 2.7-month-old 5xFAD/TRGL mouse brain neurons with a CTSD antibody. Arrow indicates normal CTSD-positive puncta in a healthy neuron. The experiment was repeated three times independently with similar results. The arrowhead indicates diffuse CTSD signal in a PANTHOS neuron. Scale bar, 20 μm. Quantitative data are presented as means ± s.e.m., unpaired t-test, two-tailed P value as indicated. mo, month; rel., relative. Source data
Fig. 8
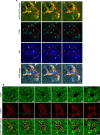
Fig. 8. PANTHOS neurons evolve into classical dense-cored senile plaques in AD models.
a, Dense-cored senile plaque labeling using Thio-S in 2.2-month-old or 6-month-old 5xFAD/TRGL mice. Quantified presence of Thio-S within the confines of a PANTHOS neuron (n = 3 mice). 2.7 months (58.1 ± 11.2%) and 6 months (95.2 ± 2.4%). Scale bar, 50 μm. See also Extended Data Fig. 7. b, IHF labeling using markers of astrocytes (GFAP) or microglia (Iba I) in 2.7-month-old or 6-month-old 5xFAD/TRGL mice. Quantified presence of microglia or astrocytes within the confines of a PANTHOS neuron. 2.7 months: without GFAP (67.2 ± 4.8%), with GFAP (32.8 ± 0.8%), without IbaI (64.2 ± 3.1 %), with IbaI (35.8 ± 3.1%); 6 months: without GFAP (29.3 ± 3.2%), with GFAP (70.7 ± 3.2%), without IbaI (12.6 ± 7.7%), with IbaI (87.4 ± 7.7%). n = 6 (two sections per mouse, three mice). Scale bar, 20 μm. c, Growth of a senile plaque commonly occurs by coalescence of one or multiple adjacent PANTHOS neurons and the progressive clearance of cellular debris after centrally located cells have degenerated, leaving behind the poorly degradable amyloid originating from these neurons. A1–A3: 12-month-old Tg2576/TRGL; A4: 25.5-month-old APP51/TRGL mouse brain. Scale bar, 50 μm. See also Extended Data Fig. 8. d, Growth of a Thio-S-positive dense-cored senile plaque commonly occurs by coalescence of one or multiple adjacent PANTHOS neurons. Scale bar, 50 μm. c, d, The experiment was repeated three times independently with similar results. Quantitative data are presented as means ± s.e.m., unpaired t-test, two-tailed P value as indicated. mo, month. Source data
Extended Data Fig. 1
Extended Data Fig. 1. Early emergence of autolysosomal acidification deficits in Tg2576/TRGL mice brain.
a. Representative fluorescence images from neocortical layer V neurons of TRGL and Tg2576/TRGL mice at two different ages. Neuronal perikarya of 1.6-month-old mice appeared normal in both genotypes, but yellow tfLC3 puncta accumulated in the perikarya of Tg2576/TRGL by 5 months of age (arrows). Scale bar 20 μm (left) or 50 μm (right). Experiment was repeated 3 times independently with similar results. b. Representative fluorescence images of tfLC3, co-labeled with CTSB or LAMP1, in neocortical neurons of 5-month-old TRGL and Tg2576/TRGL mouse brains. pa-AL exhibit a white signal depending on lysosome markers co-label (arrow). Scale bar 20 μm. c. Lysosome enriched fractions for lysosomal vATPase activity assay were isolated using a 25% OptiPrep gradient. Lysosome enriched fractions (grey box; #15~#18) were validated with various organelle markers. Experiment was repeated 3 times independently with similar results. d. Lysosomal vATPase activity of Tg2576/TRGL, 5xFAD/TRGL, and APP51/TRGL mouse cortex compared with littermate control neocortex. WT, M 6 mo (100±5.3 %), Tg2576, M 6mo (65.6±4.1 %), WT, F 6mo (100±0.8 %), Tg2576, F 6mo (56.4±1.9 %), TRGL, F 6mo (100±4.2 %), Tg2576/TRGL, F 6mo (56.4±5.2 %), WT, M 12mo (100±3.7 %), Tg2576, M 12mo (46.8±2.8 %), TRGL, M 2.7mo (100±1.8 %), 5xFAD/TRGL, M 2.7mo (68.4±3.2 %), TRGL, F 6mo (100±9.2 %), 5xFAD/TRGL, F 6mo (49.8±4.1 %), TRGL, F 12-15mo (100±5.0 %), APP51/TRGL, F 12-15mo (54.5±10.3 %). Number denotes mean value. n=3-5 mice. Quantitative data are presented as means ±S.E.M. unpaired t-test, two-tailed P value as indicated. Source data
Extended Data Fig. 2
Extended Data Fig. 2. Intraneuronal APP-βCTF/Aβ accumulates selectively within pa-AL in AD mice.
a. AV fractionation from 10-month-old Tg2576 mice. Fractions were validated by organelle markers (lysosome: CTSD, mitochondria: Tom20, ER: SEC61B, AV: p62) and anti-Aβ antibody 4G8. Experiment was repeated 2 times independently with similar results. b. Immunofluorescence co-labeling of 5-month-old Tg2576/TRGL mouse brain neurons with an antibody against Aβ1−42 (JRF/cAβ42/26). Aβ accumulates in enlarged pa-AL producing a white signal (arrowhead). Experiment was repeated 3 times independently with similar results. Scale bar 20 μm. (c) Quantitation graph of the PLA fluorescence per neuron from N2A-APPswe cell (N2a (0.9±0.2), N2a APPswe (19.6±1.1)) and (d) 10-month-old Tg2576 mouse brain compared with WT controls. WT (1.4±0.1), Tg2576 (6.9±0.5). n=50 cells per each. e-g, Quantitation graph of the PLA fluorescence per neuron from 10-month-old Tg2576/TRGL. e. Total number of PLA signal per neuron. TRGL (1.2±0.1), Tg2576/TRGL (6.2±0.3). (f) Number of the PLA signal in pa-AL per neuron. TRGL-pa-AL (0.1±0.0), Tg2576/TRGL-pa-AL (5.8±0.2). (g) Percentage of PLA signal in pa-AL in neuron compared with WT controls. TRGL-pa-AL (6.7±3.4 %), Tg2576/TRGL-pa-AL (92.9±1.3 %). n=50 cells. Quantitative data are presented as means ±S.E.M. unpaired t-test, two-tailed P value as indicated. a-d: Experiment was repeated 3 times independently with similar results. Source data
Extended Data Fig. 3
Extended Data Fig. 3. Neuron-specific origin of PANTHOS and age/sex dependent PANTHOS neuron proliferation in brains of 5xFAD/TRGL mice.
a. PANTHOS neurons were immunolabeled with neuron specific enolase (NSE) which detects neuronal populations, especially cell bodies, and were counter-stained with DAPI. NSE IHC indicates that PANTHOS neurons were NSE-positive. The UV channel did not produce any autofluorescence from PANTHOS neurons when DAPI counterstaining was not done in 2.7-month-old 5xFAD/TRGL mouse brain. Scale bar 20 μm. b. PANTHOS neurons were immunolabeled with lysosome marker CTSB and LIMP2 in 2.7-month-old 5xFAD/TRGL mouse brain. Scale bar 20 μm. c. tfLC3 signal in cerebral cortex at three ages in 5xFAD/TRGL male and female mice demonstrating age- and sex- dependent proliferation of PANTHOS neurons. d. Overview of PANTHOS neuron distribution in cerebral cortex of the 2.7-month-old 5xFAD/TRGL male mouse (top panel) and dual channel higher magnification (bottom). Scale bar 50 μm. e. Age dependent increased prevalence of the PANTHOS profiles in various AD mouse models. 5xFAD/TRGL: 1.6 mo (0±0), 2.7 mo (2340±33.8), 6 mo (767±62.3); Tg2576/TRGL: 5 mo (0±0), 9 mo (7.0±2.1), 12.6 mo (24.3±3.2); APP51/TRGL: 13 mo (0±0), 20 mo (3.0±0.4), 25-26 mo (48.3±12.2). Data points indicate mouse numbers; mo. denotes age in months. Quantitative data are presented as means ±S.E.M. unpaired t-test, two-tailed P value as indicated. a-d: Experiment was repeated 3 times independently with similar results. Source data
Extended Data Fig. 4
Extended Data Fig. 4. Tomographic rendering of the PANTHOS neuron from a 5xFAD/TRGL mouse brain shown in Fig. 5a.
Serial z-stacked image (1 μm thick, number z1z6) showing a flower shape structure of a PANTHOS neuron displaying the strongly fluorescent blebs with tapered necks arising from the perikaryal plasma membrane. The neuron is from the cerebral cortex layer V of 2.7-month-old male 5xFAD/TRGL mice. Scale bar 10 μm. Experiment was repeated 3 times independently with similar results.
Extended Data Fig. 5
Extended Data Fig. 5. High resolution EM images of Fig. 5 panels reveal the contribution of AL fusion with a tubular central perinuclear network of strong Aβ/APP-βCTF IR.
a. Enlarged EM image of Fig. 5c-ii. AVs indicated with yellow arrowheads in continuity with a membranous tubular network containing fibrous bundles (red arrowheads). Scale bar 1 μm. b. Full resolution image of Fig. 5d revealing continuity of AVs (yellow arrowheads) and the tubular network (light-blue arrowheads) in greater detail. Scale bar 500 nm. c. IHF labeling with antibodies to the neuronal cytoskeleton protein NFL and lysosomes (CTSB, LAMP2) in 2.7-month-old 5xFAD/TRGL mouse brain. NFL positive swollen process projecting peripherally from the PANTHOS neuron contrasts with the perikaryal blebs which have undetectable NFL signal consistent with the NFL process being a dystrophic axon (arrow). Scale bar 20 μm. d. IHF labeling with neuronal cytoskeleton protein NFL in 6-month-old 5xFAD/TRGL mouse brain. NFL positive swollen DN-like profiles are characteristically located at the periphery of the PANTHOS neuron. Scale bar 20 μm. e. IEM detection of strong immunolabeling for the nuclear marker (KDMA/LSD1 - blue arrows in box inset) in the area of a nucleus no longer identifiable morphologically in a PANTHOS neuron. Scale bar 5 μm and 1 μm (enlarged ROI). a-e: Experiment was repeated 3 times independently with similar results.
Extended Data Fig. 6
Extended Data Fig. 6. The progression of PANTHOS formation in relation to amyloid in AD mouse model brains and amyloid fiber network IEM characterization.
a. IHF labeling of 28-month-old APP51/TRGL layer V cortical neurons with LY marker (CTSB) and 3D6 monoclonal antibody against APP-βCTF/Aβ. Representative plane from a Z-stack (see also Extended Data Fig. 7a) of an early stage: 3D6 accumulates in CTSB positive perikaryal pa-AL of a normal looking cell (pa-AL, yellow arrow) and in those of a bleb-forming cell (bleb, white arrowhead). Scale bar 10 μm. b. IHF labeling of 30-month-old APP51 layer V cortical neurons with LY membrane marker (LAMP2), CTSB and 3D6. Representative single plane (top panel) and respective Z-stack series (1 mm-thick z1-z3, 2nd to 4th panel) of an intermediate stage: 3D6 accumulates in a LAMP2 and CTSB double-positive bleb originated from the perikaryal protrusion of a degenerating neuron (arrowhead and respective series), as opposed to a 3D6-negative neuron with normal perikaryal morphology (arrow and respective series). Scale bar 10 μm. c. IHF labeling of 28-month-old APP51/TRGL layer V cortical neurons with CTSB and 3D6. Representative IHF image of late stage: 3D6 co-localizes with CTSB in a bleb containing pa-AL of a mature PANTHOS neuron (arrowhead), maintaining a similar spatial segregation of 3D6 and CTSB immunoreactivity as seen in earlier stages (pa-AL). Filamentous/fibrillar 3D6 signal also emanates from the center of the PANTHOS. Scale bar 10 μm. d. IHF labeling of APP-βCTF/Aβ (4G8) in 5-month-old 5xFAD/TRGL mouse brain. Representative IHF image of a late stage PANTHOS neuron with intraneuronal Aβ occupying the central area with a faded/disappeared nuclear-DAPI fluorescence. Scale bar 10 μm. e. Representative amyloid (3D6) (that is, full view images for the one shown in Fig. 6f), amyloid (4G8), AV (LC3), and AL/LY (CTSD) IEM images of 5-month-old 5xFAD/TRGL mouse brain. Yellow arrowheads denote AVs and red arrows denote amyloid bundles. Scale bar 1 μm (3D6, CTSD) and 500 nm (LC3). a-e: Experiment was repeated 3 times independently with similar results.
Extended Data Fig. 7
Extended Data Fig. 7. PANTHOS neurons evolve into Thio-S positive dense-cored senile plaques in the 5xFAD/TRGL AD mouse model.
a. PANTHOS neurons are not positive for the anti-active caspase-3 antibody in 2.7-month-old, male 5xFAD/TRGL mouse brain. Although active caspase-3 positive cells were extremely rare and did not overlap with PANTHOS, the arrowhead identifies a rare non-neuronal caspase-3-positive cell as a positive control. b. Representative image of PANTHOS with GFP/RFP filter set (left) and image of the additional Thio-S staining with GFP/RFP/DAPI filter in 6-month-old, male 5xFAD/TRGL mouse brain. eGFP signal of the PANTHOS was diminished, whereas mRFP signals were preserved in Thio-S-stained tissues (right) compared to unstained tissue (left). Arrow used as tissue orientation. c. Digital overlay of the ROI (Fig. b, box) highlights that PANTHOS profiles are only detectable using mRFP signal since fixation for Thio-S quenches GFP. A small percentage of PANTHOS were Thio-S negative (arrowhead) whereas the majority are Thio-S positive (arrow) in the cortex of 6-month-old, male 5xFAD/TRGL mouse brain. a-c: Experiment was repeated 3 times independently with similar results.
Extended Data Fig. 8
Extended Data Fig. 8. Recruitment of degenerating cells and individual PANTHOS coalescence in old APP51 mice.
a. IHF co-labeling of 28-month-old APP51/TRGL mouse brain layer V cortical neurons with LY marker (CTSB) and 3D6 monoclonal antibody against APP-βCTF/Aβ. A Z-stack series (1 μm-thick, z1-z3) shows recruitment of various cells (1-3) with different degrees of perikaryal pa-AL and 3D6 accumulation around an amyloid-invaded PANTHOS neuron (4, arrowheads). Scale bar 10 μm. b. Serial z-stacked image (1 μm thick, number z1- z5) showing multiple single PANTHOS become united into one large structure. * Denotes trace of the individual PANTHOS. Scale bar 50 μm. a-b: Experiment was repeated 3 times independently with similar results.
Extended Data Fig. 9
Extended Data Fig. 9. Autophagy-Lysosomal Pathway (ALP) abnormality in Braak II stage) human AD brain degenerating neuron.
a. Representative fluorescence images of intraneuronal Aβ in autolysosomes (arrowhead, autophagy (LC3)/lysosomal (CTSD)) together with DAPI for nucleus. Scale bar 20 μm. b. Representative LC3/CTSD fluorescence images depicting a neuron with focal plasma membrane blebbing as pa-AL enlarge and proliferate (arrowhead). c. Z-stacked image series (1 μm thick, number z1z5) showing LC3 and CTSD positive blebs emanating from perikaryon marked by DAPI staining. Scale bar 10 μm. d. Patterns of AV-related pathology showing a neuronal perikaryon with an intact nucleus. Enlarged LC3- and CTSD-positive vesicles (AL) are contained within numerous perikaryal membrane blebs Scale bar 10 μm. e. IHF labeling of Aβ (4G8) and DAPI stain. Perinuclear intraneuronal Aβ accumulation surrounding visible DAPI-positive nucleus within a PANTHOS like neuron. Scale bar 10 μm. a-d: Experiment was repeated 3 AD human brain independently with similar results.
Extended Data Fig. 10
Extended Data Fig. 10. Diagram summarizing the stages of autophagy-lysosomal pathway-mediated PANTHOS (“poisonous flower”) neurodegeneration in AD mice.
Normal autophagic clearance involves substrate sequestration into a double-membrane autophagosome (AP) followed by fusion with lysosomes (LY), yielding a single-membrane autolysosome (AL). The proton pump vATPase maintains an acidic pH (4.5-5) optimal for lysosomal enzymatic activity and degradation of substrates within AL, which then convert to lysosomes to restore normal levels of free LY. In Alzheimer’s disease, three main stages of neuronal compromise and degeneration resulting from autophagy-lysosomal pathway dysfunction can be identified: i) The “budding” stage of PANTHOS: AL acidification deficiency and poorly acidified-AL build-up. AD-gene driven deficits of Ly vATPase activity underlie impaired clearance of autophagic substrates, including APP-βCTF/Aβ (mainly derived from the endolysosomal pathway). The result is an accumulation of enlarged poorly acidified AL (pa-AL) within the neuronal perikaryon well before the appearance of any other overt AD-related pathology. Buildup of pa-AL containing APP-βCTF/Aβ is accompanied by their progressive peripheralization resulting in plasma membrane distortion and bulging/budding (see Fig. 3a, f; Fig. 4a and Fig. 6a). ii) The “flowering” stage of PANTHOS: formation of perinuclear membrane-bound amyloid fibers. Massive buildup of APP-βCTF/Aβ-containing pa-AL induces a unique pattern of perikaryal membrane blebbing. The blebs, corresponding to the “petals” of the PANTHOS neuron, have tapered necks extending toward the plasma membrane-surface of the PANTHOS neuron containing a degenerating condensed nucleus (see Fig. 4a-e; Fig. 5a and Fig. 6b-c). β-amyloid (Aβ) fiber bundles within a branching membrane tubular network accumulate around a deteriorating nucleus and reflect the fusion of AVs with APP-rich endoplasmic reticulum (ER). The enlarged inset shows AVs at different stages of fusion (see Fig. 5c,d and Fig. 6d,e). Accrual of Aβ and other oxidized substrates initiates Lysosomal Membrane Permeabilization (LMP) and LY enzyme leakage. iii) The “overblown” stage of PANTHOS: amyloid plaque expansion via glial invasion and recruitment of neighboring PANTHOS neurons. As nuclear membrane is disrupted and the nucleus degenerates, amyloid fiber growth within the expanding perinuclear membrane-tubular network, completely invades the center of the PANTHOS neuron incorporating additional AVs (see Fig. 5c; Extended Data Fig. 5e and Fig. 6e). LY enzyme leakage, along with focal rupture of perikaryal and bleb plasma membrane, trigger an inflammatory response and signals that recruit phagocytic glial cells and promotes the coalescence of individual PANTHOS neurons, which expand the plaque lesion and central protease-resistant β-amyloid core (see Fig. 7e,f and Fig. 8a,b,c), transforming degenerating PANTHOS perikarya into an extracellular senile plaque.

Comment in

  • Opening the box of PANTHORA in Alzheimer's disease.
    Korte M, Köster RW. Korte M, et al. Signal Transduct Target Ther. 2022 Oct 2;7(1):344. doi: 10.1038/s41392-022-01204-7. Signal Transduct Target Ther. 2022. PMID: 36184585 Free PMC article. No abstract available.

Similar articles

Cited by

References

    1. Menzies FM, et al. Autophagy and neurodegeneration: pathogenic mechanisms and therapeutic opportunities. Neuron. 2017;93:1015–1034. doi: 10.1016/j.neuron.2017.01.022. - DOI - PubMed
    1. Boland B, et al. Promoting the clearance of neurotoxic proteins in neurodegenerative disorders of ageing. Nat. Rev. Drug Discov. 2018;17:660–688. doi: 10.1038/nrd.2018.109. - DOI - PMC - PubMed
    1. López-Otín C, Kroemer G. Hallmarks of health. Cell. 2021;184:33–63. doi: 10.1016/j.cell.2020.11.034. - DOI - PubMed
    1. Mizushima N, Levine B, Cuervo AM, Klionsky DJ. Autophagy fights disease through cellular self-digestion. Nature. 2008;451:1069–1075. doi: 10.1038/nature06639. - DOI - PMC - PubMed
    1. Moreira PI, et al. Autophagy in Alzheimer’s disease. Expert Rev. Neurother. 2010;10:1209–1218. doi: 10.1586/ern.10.84. - DOI - PubMed

Publication types

Substances

LinkOut - more resources