. 2022 Jul 4;219(7):e20211779.
doi: 10.1084/jem.20211779. Epub 2022 Jun 2.

Dietary intervention preserves β cell function in mice through CTCF-mediated transcriptional reprogramming

Affiliations

Dietary intervention preserves β cell function in mice through CTCF-mediated transcriptional reprogramming

Ruo-Ran Wang et al. J Exp Med. .

Abstract

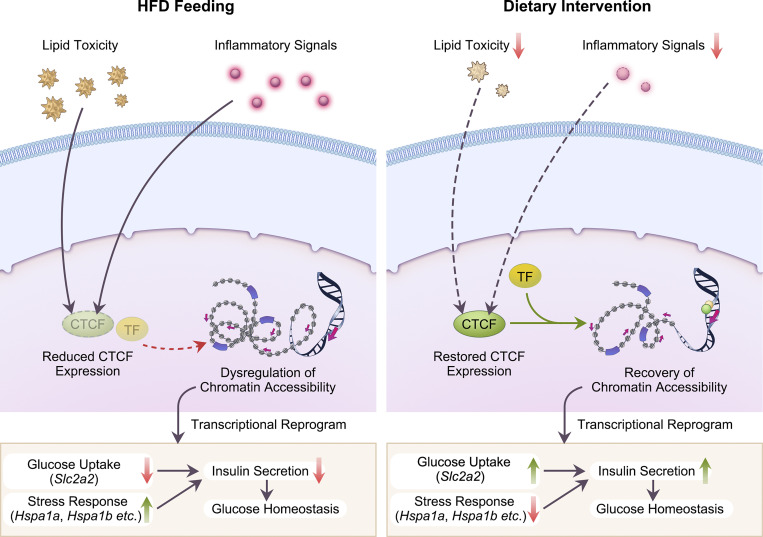
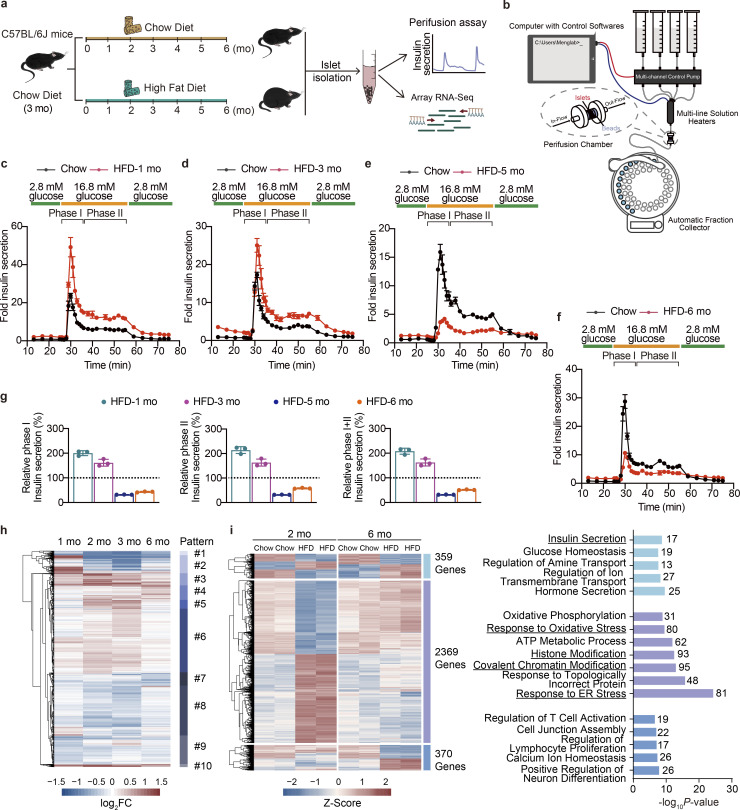
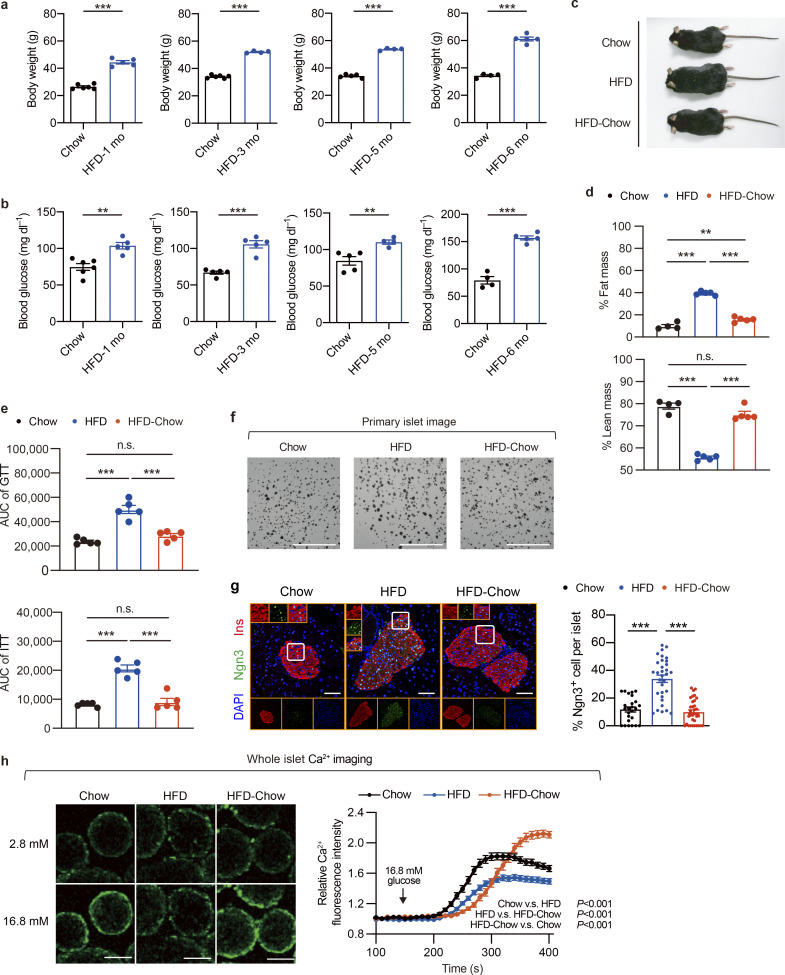
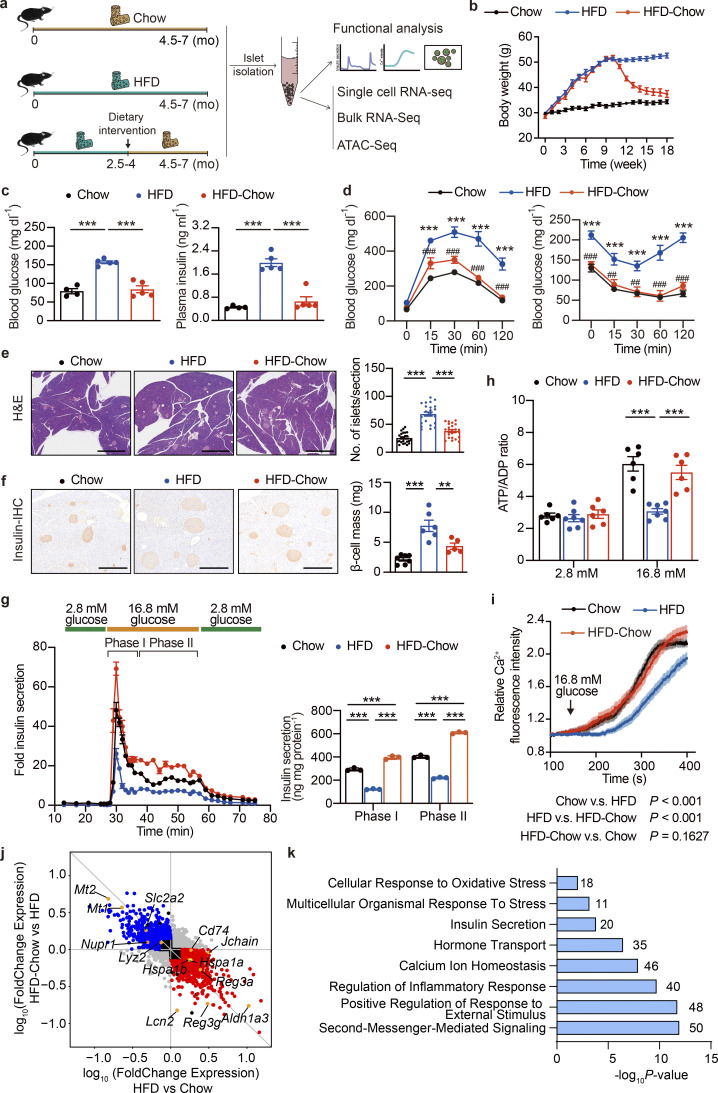
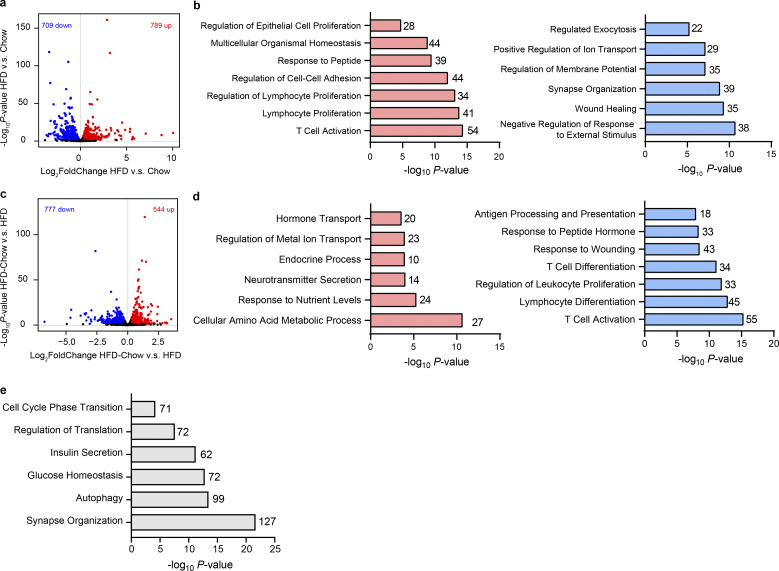
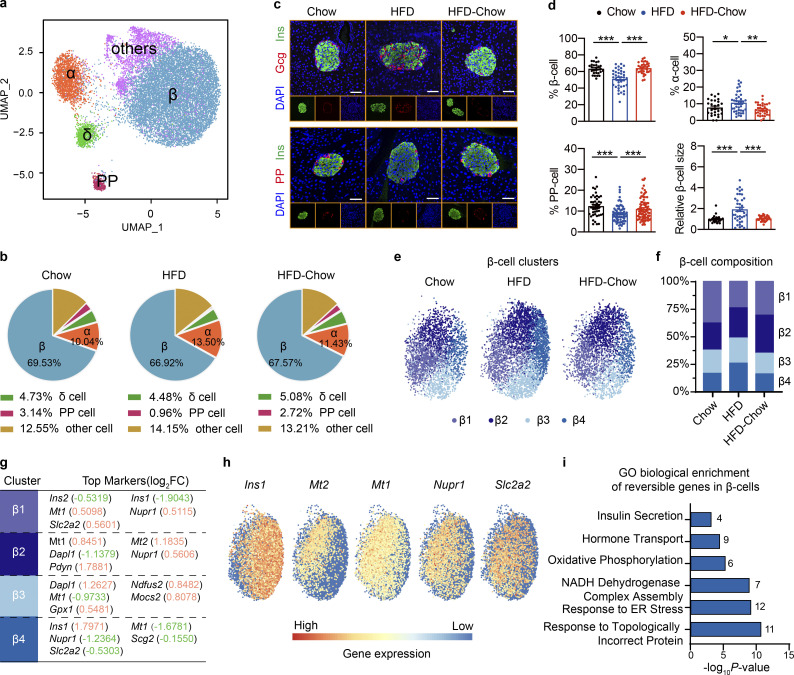
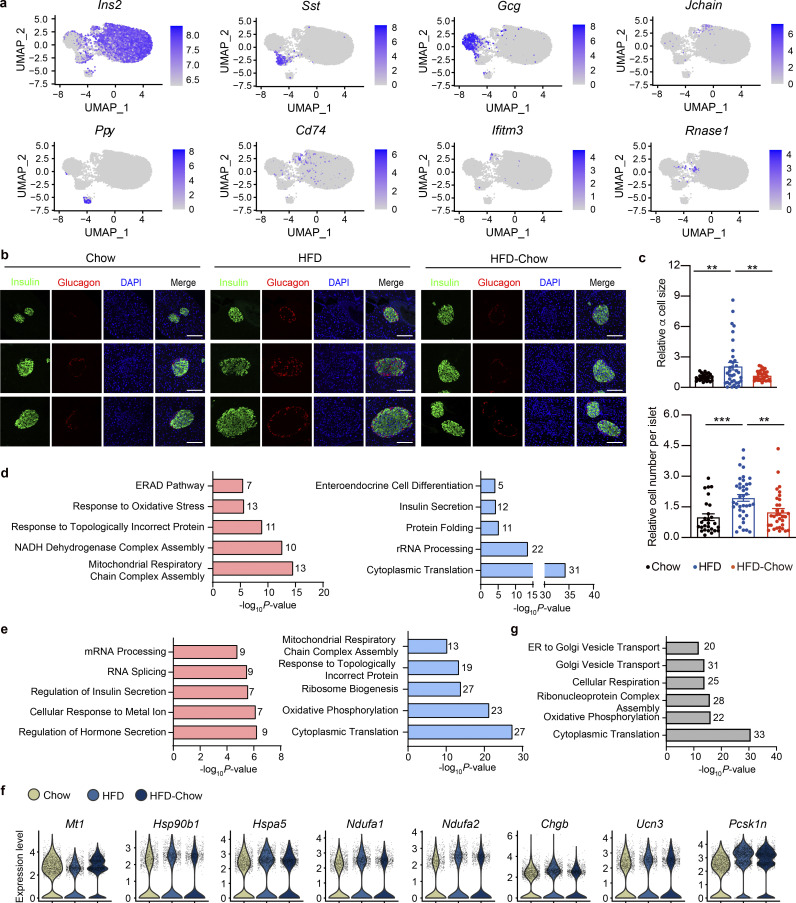
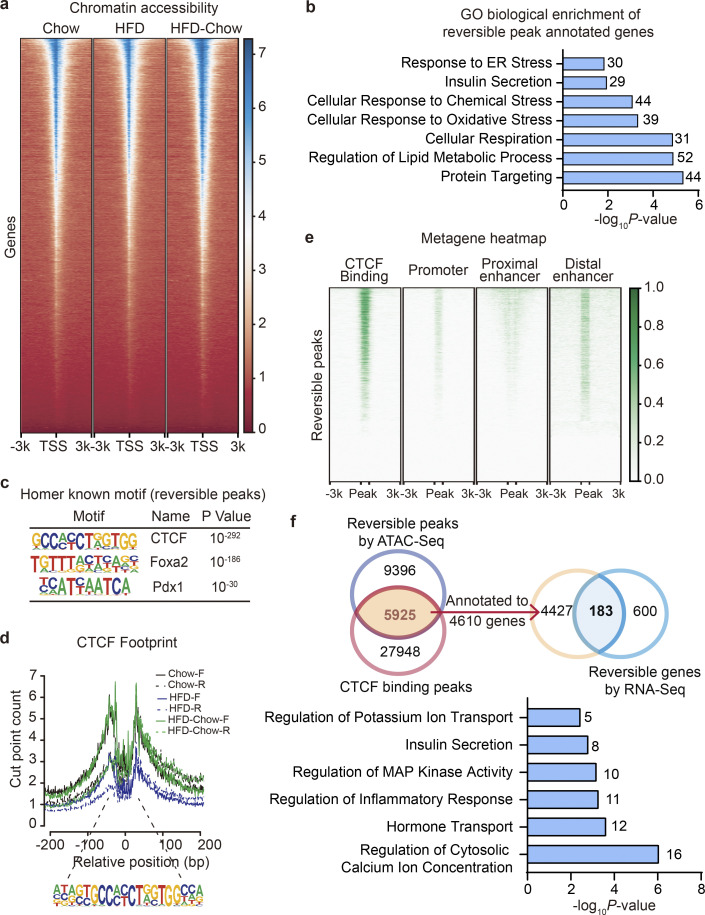
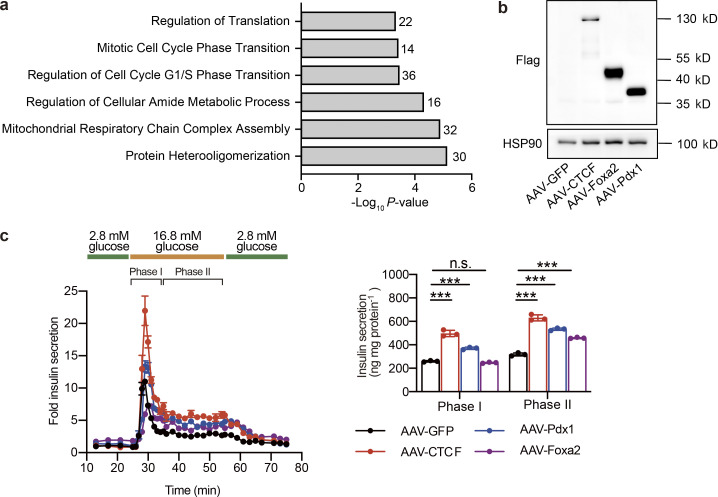
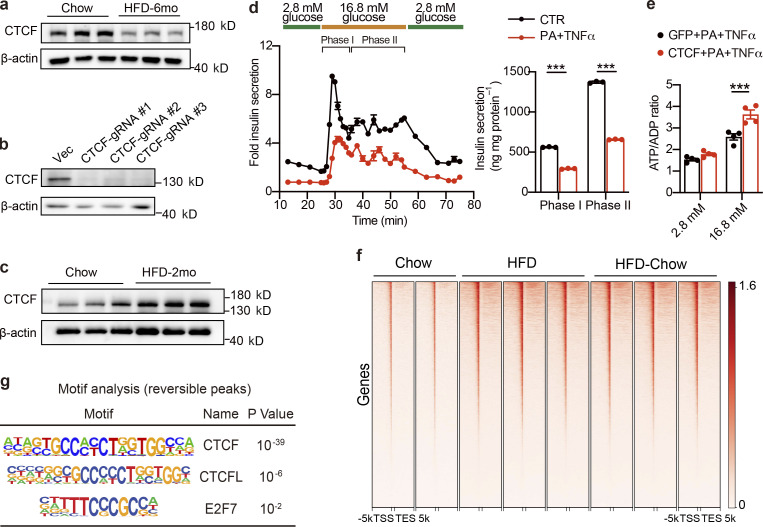
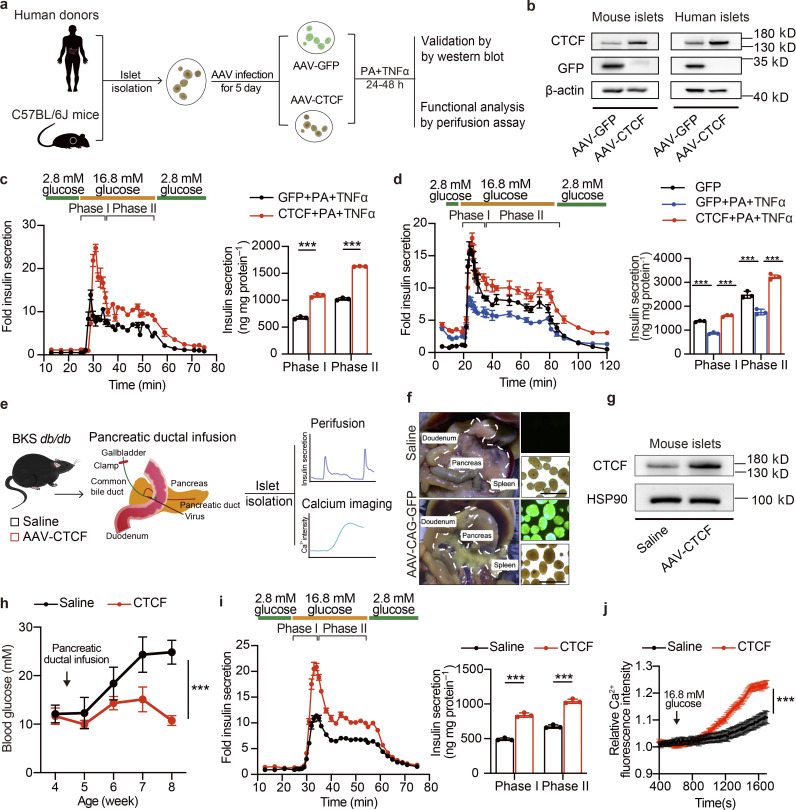
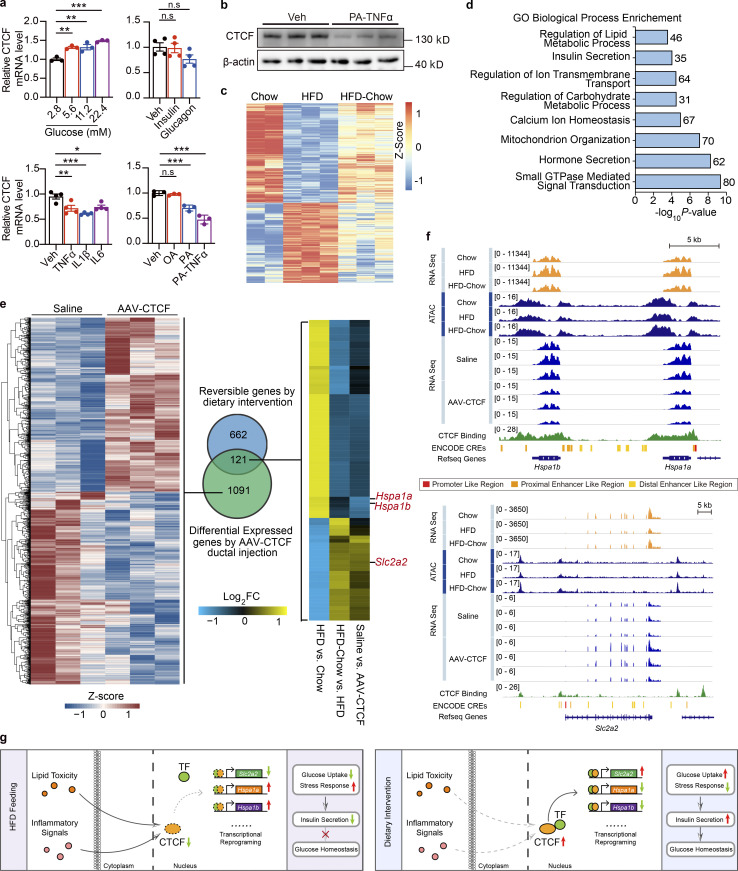
Pancreatic β cell plasticity is the primary determinant of disease progression and remission of type 2 diabetes (T2D). However, the dynamic nature of β cell adaptation remains elusive. Here, we establish a mouse model exhibiting the compensation-to-decompensation adaptation of β cell function in response to increasing duration of high-fat diet (HFD) feeding. Comprehensive islet functional and transcriptome analyses reveal a dynamic orchestration of transcriptional networks featuring temporal alteration of chromatin remodeling. Interestingly, prediabetic dietary intervention completely rescues β cell dysfunction, accompanied by a remarkable reversal of HFD-induced reprogramming of islet chromatin accessibility and transcriptome. Mechanistically, ATAC-based motif analysis identifies CTCF as the top candidate driving dietary intervention-induced preservation of β cell function. CTCF expression is markedly decreased in β cells from obese and diabetic mice and humans. Both dietary intervention and AAV-mediated restoration of CTCF expression ameliorate β cell dysfunction ex vivo and in vivo, through transducing the lipid toxicity and inflammatory signals to transcriptional reprogramming of genes critical for β cell glucose metabolism and stress response.


Conflict of interest statement

Disclosures: The authors declare no competing interests exist.

Figures

None
Graphical abstract
Figure 1.
Figure 1.
Dynamic functional and transcriptional profiles of pancreatic islet adaptation in response to continuous HFD feeding. (a) Schematic representation of the experimental setup. (b) Schematic of the islet perifusion system. (c–f) Perifusion analyses of dynamic glucose-stimulated phase I and phage II insulin secretion in islets from mice fed with HFD for 1, 3, 5, and 6 mo and their corresponding controls. Each islet sample was pooled from at least three animals. Data represent mean ± SD; n = 3 technical replicates. (g) Relative phase I and phase II and total (I + II) insulin secretion in islets from mice fed with HFD for 1, 3, 5, and 6 mo shown in c–f determined by calculating the AUC of each HFD group against their respective control group set as 100% (shown in black dashed lines). Each islet sample was pooled from at least three animals. Data represent mean ± SD; n = 3 technical replicates. (h) Unsupervised clustering of differentially expressed genes in timescale HFD feeding. log2FC values against their respective chow diet–fed control group in each time point are shown (scale bar, −1.5 to 1.5). Dendrogram was manually cut to obtain 10 clusters representing 10 change patterns. (i) Differential expression analysis of genes with significant changes in primary islets isolated from mice underwent either 2 or 6 mo of HFD feeding. Heatmap showing scaled fragments per kilobase of exon model per million mapped fragments (as Z-Score) of genes with significant changes in both time points (in light blue), exclusively in the 2 mo (in purple), and exclusively in the 6 mo (in sky blue; left, scale bar indicats −2 to 2), and GO enrichment analysis of biological processes featuring these patterns (right), most significant and nonredundant biological processes with respective gene numbers and P values are shown. Data in c–g are representative of at least two independent experiments.
Figure S1.
Figure S1.
Additional characterization of β cell compensation-to-decompensation model and dietary intervention model. (a) Body weight of mice fed with HFD for 1, 3, 5, and 6 mo. Littermates fed with chow diet were used as controls. Data represent mean ± SEM (n = 4–6 mice per group); ***, P < 0.001; two-tailed unpaired Student’s t test. (b) Overnight fasting blood glucose levels in mice as treated in a. Data represent mean ± SEM (n = 4–6 mice per group); **, P < 0.01; ***, P < 0.001; two-tailed unpaired Student’s t test. (c) Representative images of mice in Chow, HFD, and HFD-Chow groups. (d) Body composition of mice in indicated groups. Data represent mean ± SEM (n = 4–5 mice per group); **, P < 0.01; ***, P < 0.001; one-way ANOVA. (e) AUC quantification of GTT and ITT results shown in Fig. 2 d. Data represent mean ± SEM (n = 4–5 mice per group); ***, P < 0.001; one-way ANOVA. (f) Representative images of mouse islets isolated from indicated groups. Scale bar, 5 mm. (g) Representative immunofluorescent images (left panel) and quantification (right panel) of Ngn3+ cells in islets from indicated groups. Scale bar, 100 μm. Data represent mean ± SEM (n = 25–33 islets from 4 to 5 mice per group); ***, P < 0.001; one-way ANOVA. (h) Glucose-stimulated Ca2+ influx in mouse islets isolated from Chow (n = 53 islets), HFD (n = 52 islets), and HFD-Chow (n = 63 islets) groups. Each islet sample was pooled from at least three animals. Representative fluorescence images of calcium signal in islets treated with high glucose (16.8 mM) for 400 s (left), and dynamic Ca2+ fluorescence intensity in response to high-glucose treatment (right). Scale bar, 100 μm. Data represent mean ± SEM two-way ANOVA with multiple comparisons. Data are representative of at least two independent experiments for all panels.
Figure 2.
Figure 2.
Dietary intervention prevents HFD-induced β cell dysfunction and systemic metabolic defects. (a) Schematic representation of the experimental setup. (b) Body weight changes in mice with indicated treatments. Data represents mean ± SEM (n = 7–9 mice per group). (c) Overnight fasting blood glucose levels (left) and plasma insulin levels (right) of Chow, HFD, and HFD-Chow mice. Data represent mean ± SEM (n = 4–5 mice per group); ***, P < 0.001; one-way ANOVA. (d) GTT (left) and ITT (right) of Chow, HFD, and HFD-Chow mice. Data represent mean ± SEM (n = 5 mice per group), ***, P < 0.001, HFD vs. Chow; ##, P < 0.01, ###, P < 0.001, HFD-Chow vs. HFD; two-way ANOVA with multiple comparisons. (e) Representative H&E staining of pancreas sections from Chow, HFD, and HFD-Chow mice (left panel), and islet number per pancreas section (right). Scale bar, 1 mm. Data represent mean ± SEM (n = 24 pancreas sections from six mice/group; at least 4 sections/mouse).***, P < 0.001; one-way ANOVA. (f) Representative IHC images of mouse pancreas sections from Chow, HFD, and HFD-Chow mice immune-stained for insulin (brown) and counterstained with hematoxylin (blue; left). Quantitation of β cell mass in the pancreas of Chow, HFD, and HFD-Chow mice (right). Scale bar, 500 μm. Data represent mean ± SEM (n = 5–7 mice per group). **, P < 0.01; ***, P < 0.001; one-way ANOVA. (g) Perifusion analyses of dynamic glucose-stimulated insulin secretion in islets from Chow, HFD, and HFD-Chow mice (left) and biphasic insulin release levels (right). Each islet sample was pooled from at least three animals. Data represent mean ± SD (n = 3 technical replicates). ***, P < 0.001; one-way ANOVA. (h) ATP/ADP ratios of islets from Chow, HFD, and HFD-Chow mice under low-glucose (2.8 mM) or high-glucose (16.8 mM) treatments, islet samples were pooled from at least three animals. Data represent mean ± SEM (n = 6–7 replicates of islet samples, each sample represent 20 IEQ islets); ***, P < 0.001; one-way ANOVA. (i) Glucose (16.8 mM) stimulated Ca2+ influx in single islet β cells in mice from Chow (n = 128 cells), HFD (n = 178 cells), and HFD-Chow (n = 214 cells) groups. Each islet sample was pooled from at least three animals. Data represent mean ± SEM; two-way ANOVA. (j) Differential gene expression analysis of RNA-Seq of mouse islets from Chow, HFD, and HFD-Chow groups (RNA isolation from islets pooled from three mice). Log10 transferred fold change expression levels of all highly expressed genes (fragments per kilobase of exon model per million mapped fragments >1) in indicated comparisons are shown in the scatter plot. Reversible Genes with |log2FC| > 0.5, P < 0.05 were additionally marked in red (upregulated) and blue (downregulated). (k) GO analysis of Reversible Genes in i. Most significant and nonredundant biological processes with respective gene numbers and P values are shown. All panels report data verified in at least two independent experiments.
Figure S2.
Figure S2.
Pairwise gene expression comparison of bulk islet RNA-Seq data among Chow, HFD, and HFD-Chow groups. (a) Volcano plot showing the gene expression difference in islets between Chow and HFD groups. Genes that are significantly upregulated (log2FC > 0.4, P < 0.05, P values by Wald test) or downregulated (log2FC < −0.4, P < 0.05, P values by Wald test) were marked in red and blue, respectively. (b) GO analysis of significantly upregulated (left) and downregulated (right) genes by HFD compared to Chow group. (c) Volcano plot showing the gene expression difference in islets between HFD and HFD-Chow. Genes that are significantly upregulated (log2FC > 0.4, P < 0.05, P values by Wald test) or downregulated (log2FC < −0.4, P < 0.05, P values by Wald test) were marked in red and blue, respectively. (d) GO analysis of significantly upregulated (left) and downregulated (right) genes by HFD-Chow compared to HFD group. (e) GO analysis of genes unaltered by dietary intervention (|log2FC (HFD-Chow vs. Chow)| > 0.4, P < 0.05 AND NOT Reversible Genes). In a–e, islet samples were pooled from at least three animals. In b, d, and e, most significant and nonredundant biological processes with respective gene number and P value are shown.
Figure 3.
Figure 3.
scRNA-Seq analysis of dietary intervention on islet cell composition and β cell specific transcriptome. (a) scRNA-Seq and UMAP visualization of transcriptome similarity-based cell clustering of islet single cells from indicated groups. Islet sample for each treatment was pooled from at least three animals. In total, 4,231 (Chow), 6,454 (HFD), and 4,490 (HFD-Chow) cells were used in the clustering. (b) Cell composition of islets from indicated groups by scRNA-Seq. (c) Representative immunofluorescent images of insulin (Ins), glucagon (Gcg), and PP in islets from Chow, HFD, and HFD-Chow mice. Scale bar, 50 μm. (d) Quantification of β, α, and PP cell percentage and relative β cell size (n = 27–38 islets per group for % β, % α, and relative β cell size; n = 44–82 islets per group for % PP; islets were pooled from 4 to 5 mice; at least 6 islets per mice) in pancreas sections of Chow, HFD, and HFD-Chow mice. Data represent mean ± SEM; *, P < 0.05; **, P < 0.01; ***, P < 0.001; one-way ANOVA. Relative β cell size was normalized to the average β cell size in Chow group. (e) UMAP visualization of β cell sub-clusters in indicated groups; cells apart from the major β cell cluster on the UMAP plot were not shown. (f) Composition analysis of β cell sub-clusters in indicated groups. (g) Top markers of indicated β cell clusters. Upregulated genes were marked in red, downregulated genes were marked in green. Log2FC indicates the average log2 transferred fold change of indicated gene expression in given subcluster comparing to the expression level in other β cells. (h) Expression heatmap of indicated genes in all β cells. (i) GO analysis of reversible genes (with P < 0.05 by Wilcoxon Rank Sum test) in β cells. Most significant and nonredundant biological processes with respective gene numbers and P values are shown. Data in c and d are representative of at least two independent experiments.
Figure S3.
Figure S3.
Additional details of scRNA-Seq analysis. (a) scRNA-Seq and UMAP visualization of islet single cells from Chow, HFD, and HFD-Chow groups. Expression levels of indicated marker genes are shown. Scale bar indicates gene expression level. (b) Representative immunofluorescent images of insulin (marker for β cell) and glucagon (marker for α cell) staining in pancreas sections from indicated groups. Scale bar, 100 μm. (c) Relative α cell size and islet cell number quantified from immunofluorescent images and normalized to the average α cell size, and the islet cell number, respectively, in the Chow group. Data represent mean ± SEM (n = 4–5 mice per group, dots represent islets); **, P < 0.01; ***, P < 0.001; one-way ANOVA. (d) GO biological process analysis of upregulated (left) and downregulated (right) genes in β cell clusters from HFD group compared to Chow group. (e) GO biological process analysis of upregulated (left) and downregulated (right) genes in β cell clusters from HFD-Chow group compared to HFD group. (f) Violin plot of selected gene expression, expression level in each cell was marked in gray dot. (g) GO biological process analysis of genes unaltered by dietary intervention in β cell clusters (P < 0.05 AND NOT Reversible Genes). In d, e, and g, most significant and nonredundant biological processes with respective gene numbers and P values are shown. Significantly changed genes were identified by P < 0.05 with Wilcoxon Rank Sum test. Data in b and c are representative of two independent experiments.
Figure 4.
Figure 4.
Identification of CTCF as the top candidate mediating the preservation of β cell function by dietary intervention. (a) Metagene heatmap of the genome-wide ATAC peaks’ occupation in the −3 to +3 kb region flanking the TSS. Scale bar indicates peak density. In each treatment, ATAC-Seq libraries were prepared using islets pooled from three mice. (b) GO analysis of genes annotated to the Reversible Peaks (within −5,000 to +100 bp relative to TSS). Most significant and nonredundant biological processes with respective gene number and P value are shown. (c) Known motif analysis within Reversible Peaks. Consensus islet related motifs (Motif), transcriptional factor names (Name), and P values are shown. (d) Footprint aggregate plots at putative CTCF binding sites. (e) Metagene heatmap of CTCF CUT&Tag peaks and ENCODE annotated CREs around the Reversible Peaks. Scale bar indicates peak density. (f) Upper panel: Venn plot showing the overlap between given datasets and schematic representation of data integration pipeline. Lower panel: GO analysis of light blue shaded genes in the Venn plot. Most significant and nonredundant biological process with respective gene number and P value are shown.
Figure S4.
Figure S4.
GO analysis of unaltered genes in ATAC-Seq and effects of AAV-mediated overexpression of CTCF, Foxa2, and Pdx1 on islet insulin secretion. (a) GO Biological Process enrichment analysis of genes annotated to peaks with their chromatin accessibility unaltered by dietary intervention (|log2FC (HFD-Chow vs. Chow)| > 0.5 AND NOT Reversible Peaks). (b) Immunoblot of total protein lysates from islets transduced with AAV expressing CTCF, Foxa2, Pdx1, or GFP (as control) for 5 d. (c) Dynamic glucose-stimulated insulin secretion (left) and quantified phase I and phase II insulin levels (right) from islets as treated in b. Islets were isolated from mice fed with HFD for 3 mo. Each islet sample was pooled from at least three animals. Data represent mean ± SD, n = 3 technical replicates; ***, P < 0.001; one-way ANOVA. Data in b and c are representative of two independent experiments. Source data are available for this figure: SourceData FS4.
Figure 5.
Figure 5.
CTCF expression is downregulated in islets from obese and diabetic mice and humans. (a) Relative CTCF mRNA expression in islets from 12-wk-old ob/ob mice (n = 3 mice per group; data represent mean ± SEM) or 9-wk-old BKS-db/db mice (n = 5 mice per group; data represent mean ± SEM). The relative gene expression levels of CTCF were calculated using the expression values of CTCF in the RNA-Seq (ob/ob mice) or microarray datasets (BKS-db/db, GEO accession no. GSE31559), normalized to their respective controls. **, P < 0.01; ***, P < 0.001; two-tailed unpaired Student’s t test. (b) Representative immunoblots of total islet protein lysates from control (CTR) and 20-wk-old BKS-db/db mice (pooled islet sample from three mice). (c) Representative immunoblots of total islet protein lysates from Chow, HFD, and HFD-Chow mice (pooled islet sample from three mice). (d) Representative immunofluorescent images (up) and relative signal intensities of CTCF (down) in pancreas sections of indicated mouse groups. Data represent mean ± SEM (dots in left panel represent 34–43 islets from 4 to 5 mice; at least 6 islets/mice; dots in right panel represent 4–5 mice); ***, P < 0.001; one-way ANOVA. CTCF signal intensities were normalized to average signal intensity in Chow group. Scale bar, 10 μm (for zoomed-in view), 50 μm. (e) Relative CTCF mRNA expression in human islets from ND and T2D donors obtained from previously published microarray datasets. Data represent mean ± SEM (n = 6–7 donors per group); *, P < 0.05; two-tailed unpaired Student’s t test. (f) Donor information of ND and T2D donors. (g) Representative immunofluorescent images (left) and relative signal intensity of CTCF (right) in human pancreas sections obtained from ND and T2D donors in f. Data represent mean ± SEM (dots in left panel represent 57–75 islets from 6 to 7 donors; at least 6 islets per donor; dots in right panel represent 6–7 donors); *, P < 0.05; ***, P < 0.001; two-tailed unpaired Student’s t test. CTCF signal intensities were normalized to average signal intensity in control group. Scale bars, 10 μm (for zoomed-in view), 50 μm. (h) Immunoblots (left) of islets transduced with control siRNA (CTR) or CTCF siRNA. Islets were pooled from four wild-type mice. (i) Perifusion analyses of dynamic glucose-stimulated insulin secretion (left) and biphasic insulin release levels (right) of mouse islets as described in h. Islets were pooled from four wild-type mice. Data represent mean ± SD; n = 3 technical replicates; ***, P < 0.001; two-tailed unpaired Student’s t test. (j) GSIS of Min6 cell lines transduced with lentivirus delivering Cas9 and either control (Vec) or CTCF targeting (CTCF-gRNA#1–3) sgRNAs. Data represent mean ± SEM (n = 3); **, P < 0.01; ***, P < 0.001; two-way ANOVA. All panels report data verified in at least two independent experiments. Source data are available for this figure: SourceData F5.
Figure S5.
Figure S5.
Regulation of CTCF expression, its effect on islet function, and CUT&Tag analysis of CTCF genome-wide binding profiles. (a) Immunoblot of total islet protein lysates from mice fed with HFD for 6 mo and their corresponding controls (n = 3 biological triplicates). (b) Immunoblot of total protein lysates from Min6 cells transduced with spCas9 and sgRNA expressing lentivirus. Cells transduced with lentivirus expressing only spCas9 were used as the control group (CTR). (c) Immunoblot of total islet protein lysates from mice fed with HFD for 2 mo and their corresponding controls (n = 3 biological triplicates). (d) Dynamic glucose-stimulated insulin secretion (left panel) and biphasic glucose-stimulated insulin release levels (right panel) of mouse islets treated with TNFα (50 ng/ml) and PA (0.5 mM) for 24 h. Each islet sample was pooled from at least three animals. Data represent mean ± SD; n = 3 technical replicates; ***, P < 0.001; two-tailed unpaired Student’s t test. (e) ATP/ADP ratio of CTCF or GFP expressing mouse islets under low-glucose (2.8 mM) or high-glucose (16.8 mM) conditions. Islets were treated with TNFα (50 ng/ml) and PA (0.5 mM) for 24 h prior to glucose stimulation. Each sample was pooled from at least three animals. Data represent mean ± SEM (n = 4 replicates of islet samples, each sample represents 20 IEQ islets); ***, P < 0.001; two-tailed unpaired Student’s t test. (f) Metagene heatmap of the genome-wide CTCF CUT&Tag peaks’ occupation in the −5 to +5 kb regions flanking the TSS in islets from indicated groups. In each treatment, CUT&Tag libraries were prepared using islets pooled from three mice, with 2–3 technical replicates. The scale bar indicates peak density. (g) Known motif analysis within reversible CTCF binding peaks. Consensus non-redundant motifs (Motif), transcriptional factor names (Name), and P values are shown. Data in a–e are representative of two independent experiments. Source data are available for this figure: SourceData FS5.
Figure 6.
Figure 6.
AAV-mediated restore of CTCF expression ameliorates β cell dysfunction ex vivo and in vivo. (a) Schematic representation of experimental procedures for b–d. (b) Immunoblots of total cell lysates from mouse or human islets transduced with AAVs expressing CTCF or GFP for 5 d, followed by treatment with TNFα (50 ng/ml) and PA (0.5 mM) for an additional 24 h. (c) Perifusion analyses of dynamic glucose-stimulated insulin secretion (left) and biphasic insulin release levels (right) of mouse islets as described in b. Each islet sample was pooled from at least three animals. Data represent mean ± SD; n = 3 technical replicates; ***, P < 0.001; two-tailed unpaired Student’s t test. (d) Perifusion analyses of dynamic glucose-stimulated insulin secretion (left) and biphasic insulin release levels (right) of human islets as described in b. Data represent mean ± SD; n = 3 technical replicates; ***, P < 0.001; one-way ANOVA. (e) Schematic diagram of pancreatic ductal infusion of AAV and experimental design for f–j. (f) Representative image of pancreas and islets underwent pancreatic ductal infusion of AAV-GFP. Scale bar, 500 μm. (g) Immunoblots of total cell lysates from mouse islets from BKS-db/db mice 5 wk following AAV pancreatic ductal infusion. (h) Random blood glucose levels of BKS-db/db mice injected with saline or AAV-CTCF via pancreatic ductal infusion. Data represent mean ± SEM (n = 6 mice per group). ***, P < 0.001; two-way ANOVA. (i) Perifusion analyses of dynamic glucose-stimulated insulin secretion (left) and biphasic insulin release levels (right) of islets isolated from BKS-db/db mice as described in g. Each islet sample was pooled from at least three animals. Data represent mean ± SD; n = 3 technical replicates; ***, P < 0.001; two-tailed unpaired Student’s t test. (j) Glucose-stimulated Ca2+ influx in islets isolated from db/db mice as described in g. Each islet sample was pooled from at least three animals. Data represent mean ± SEM (n = 53–60 islets per group); ***, P < 0.001; two-way ANOVA. All panels report data verified in at least two independent experiments. Source data are available for this figure: SourceData F6.
Figure 7.
Figure 7.
CTCF regulates glucose metabolism and stress response related gene expression in murine islets. (a) Relative CTCF mRNA expression in Min6 cells treated with indicated reagents for 12 h. Data represent mean ± SEM; n = 3–4 biological replicates; expression levels were normalized to their respective controls; *, P < 0.05; **, P < 0.005; ***, P < 0.001; one-way ANOVA; Veh, Vehicle. (b) Immunoblots of total cell lysates from Min6 cells treated with PA and TNFα. (c and d) Heatmap showing scaled, normalized read-counts (as Z-Score) of significantly reversible CTCF bound peaks in islets between HFD vs. Chow and HFD-Chow vs. HFD comparison and GO analysis of genes annotated to these peaks. Most significant and nonredundant biological processes with respective gene number and P value are shown. (e) Overlapping analysis of significantly altered genes in islets isolated from BKS-db/db mice treatment with AAV-CTCF or saline via pancreatic ductal infusion and reversible genes by dietary intervention. Heatmap representation of significantly altered genes between AAV-CTCF and saline treatments (left, normalized read-counts were shown as Z-Score), Venn plot between two datasets (middle), and heatmap representation of overlapped genes with similar regulatory trends (right) are shown. (f) Representative RNA-Seq and ATAC-Seq browser tracks displaying dietary intervention and CTCF overexpression regulated gene loci including Hspa1a, Hspa1b, and Slc2a2. CTCF CUT&Tag tracks and ENCODE annotated CREs are also displayed. (g) Schematic representation of the working model presented in this paper. Data in a and b are representative of at least two independent experiments. Source data are available for this figure: SourceData F7.

Comment in

Similar articles

Cited by

References

    1. Al-Mrabeh, A., Hollingsworth K.G., Shaw J.A.M., McConnachie A., Sattar N., Lean M.E.J., and Taylor R.. 2020. 2-year remission of type 2 diabetes and pancreas morphology: A post-hoc analysis of the DiRECT open-label, cluster-randomised trial. Lancet Diabetes Endocrinol. 8:939–948. 10.1016/S2213-8587(20)30303-X - DOI - PubMed
    1. Bikopoulos, G., Pimenta da Silva A., Lee S.C., Lakey J.R., Der S.D., Chan C.B., Ceddia R.B., Wheeler M.B., and Rozakis-Adcock M.. 2008. Ex vivo transcriptional profiling of human pancreatic islets following chronic exposure to monounsaturated fatty acids. J. Endocrinol. 196:455–464. 10.1677/JOE-07-0174 - DOI - PubMed
    1. Boucher, A., Lu D., Burgess S.C., Telemaque-Potts S., Jensen M.V., Mulder H., Wang M.Y., Unger R.H., Sherry A.D., and Newgard C.B.. 2004. Biochemical mechanism of lipid-induced impairment of glucose-stimulated insulin secretion and reversal with a malate analogue. J. Biol. Chem. 279:27263–27271. 10.1074/jbc.M401167200 - DOI - PubMed
    1. Brereton, M.F., Iberl M., Shimomura K., Zhang Q., Adriaenssens A.E., Proks P., Spiliotis I.I., Dace W., Mattis K.K., Ramracheya R., et al. . 2014. Reversible changes in pancreatic islet structure and function produced by elevated blood glucose. Nat. Commun. 5:4639. 10.1038/ncomms5639 - DOI - PMC - PubMed
    1. Buenrostro, J.D., Giresi P.G., Zaba L.C., Chang H.Y., and Greenleaf W.J.. 2013. Transposition of native chromatin for fast and sensitive epigenomic profiling of open chromatin, DNA-binding proteins and nucleosome position. Nat. Methods. 10:1213–1218. 10.1038/nmeth.2688 - DOI - PMC - PubMed

Publication types