Identification of Two m6A Readers YTHDF1 and IGF2BP2 as Immune Biomarkers in Head and Neck Squamous Cell Carcinoma
- PMID: 35646049
- PMCID: PMC9133459
- DOI: 10.3389/fgene.2022.903634
Identification of Two m6A Readers YTHDF1 and IGF2BP2 as Immune Biomarkers in Head and Neck Squamous Cell Carcinoma
Abstract
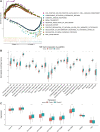
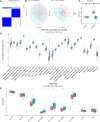
Background: N6-methyladenosine (m6A) is the most abundant internal modification pattern in mammals that a plays critical role in tumorigenesis and immune regulations. However, the effect of m6A modification on head and neck squamous cell carcinoma (HNSCC) has not been clearly studied. Methods: We screened m6A regulators that were significantly correlated with tumor immune status indicated by ImmuneScore using The Cancer Genome Atlas (TCGA) dataset and obtained distinct patient clusters based on the expression of these m6A regulators with the R package "CensusClusterPlus." We then performed gene set enrichment analysis (GSEA), CIBERSORT, and single-sample gene set enrichment analysis (ssGSEA) to assess the differences in gene function enrichment and tumor immune microenvironment (TIME) among these clusters. We further conducted differently expressed gene (DEG) analysis and weighted gene co-expression network analysis (WGCNA) and constructed a protein-protein interaction (PPI) network to determine hub genes among these clusters. Finally, we used the GSE65858 dataset as an external validation cohort to confirm the immune profiles related to the expression of m6A regulators. Results: Two m6A readers, YTHDF1 and IGF2BP2, were found to be significantly associated with distinct immune status in HNSCC. Accordingly, patients were divided into two clusters with Cluster 1 showing high expression of YTHDF1 and IGF2BP2 and Cluster 2 showing low expression levels of both genes. Clinicopathologically, patients from Cluster 1 had more advanced T stage and pathological grades than those from Cluster 2. GSEA showed that Cluster 1 was closely related to the RNA modification process and Cluster 2 was significantly correlated with immune regulations. Cluster 2 had a more active TIME characterized by a more relative abundance of CD8+ T cells and CD4+ T cells and higher levels of MHC I and MHC II molecules. We constructed a PPI network composed of 16 hub genes between the two clusters, which participated in the T-cell receptor signaling pathway. These results were externally validated in the GSE65858 dataset. Conclusions: The m6A readers, YTHDF1 and IGF2BP2, were potential immune biomarkers in HNSCC and could be potential treatment targets for cancer immunotherapy.
Keywords: HNSCC; IGF2BP2; YTHDF1; immune microenvironment; immunotherapy; m6A modification.
Copyright © 2022 Li, Wu, Liu and Zhong.
Conflict of interest statement
The authors declare that the research was conducted in the absence of any commercial or financial relationships that could be construed as a potential conflict of interest.
Figures


Similar articles
-
RNA N6-methyladenosine (m6A) modification in HNSCC: molecular mechanism and therapeutic potential.Cancer Gene Ther. 2023 Sep;30(9):1209-1214. doi: 10.1038/s41417-023-00628-9. Epub 2023 May 23. Cancer Gene Ther. 2023. PMID: 37221404 Review.
-
RNA N6-methyladenosine reader IGF2BP2 promotes lymphatic metastasis and epithelial-mesenchymal transition of head and neck squamous carcinoma cells via stabilizing slug mRNA in an m6A-dependent manner.J Exp Clin Cancer Res. 2022 Jan 3;41(1):6. doi: 10.1186/s13046-021-02212-1. J Exp Clin Cancer Res. 2022. PMID: 34980207 Free PMC article.
-
Clinical Significance of an m6A Reader Gene, IGF2BP2, in Head and Neck Squamous Cell Carcinoma.Front Mol Biosci. 2020 Apr 24;7:68. doi: 10.3389/fmolb.2020.00068. eCollection 2020. Front Mol Biosci. 2020. PMID: 32391379 Free PMC article.
-
Identification of m6A methyltransferase-related genes predicts prognosis and immune infiltrates in head and neck squamous cell carcinoma.Ann Transl Med. 2021 Oct;9(20):1554. doi: 10.21037/atm-21-4712. Ann Transl Med. 2021. PMID: 34790760 Free PMC article.
-
YTHDF1 in Tumor Cell Metabolism: An Updated Review.Molecules. 2023 Dec 26;29(1):140. doi: 10.3390/molecules29010140. Molecules. 2023. PMID: 38202722 Free PMC article. Review.
Cited by
-
A comprehensive prognostic score for head and neck squamous cancer driver genes and phenotype traits.Discov Oncol. 2023 Oct 28;14(1):193. doi: 10.1007/s12672-023-00796-y. Discov Oncol. 2023. PMID: 37897503 Free PMC article.
-
N6-methyladenosine RNA modification in head and neck squamous cell carcinoma (HNSCC): current status and future insights.Med Oncol. 2024 Nov 24;42(1):12. doi: 10.1007/s12032-024-02566-4. Med Oncol. 2024. PMID: 39580759 Review.
-
Regulation of epigenetic modifications in the head and neck tumour microenvironment.Front Immunol. 2022 Oct 28;13:1050982. doi: 10.3389/fimmu.2022.1050982. eCollection 2022. Front Immunol. 2022. PMID: 36405713 Free PMC article. Review.
-
VIM‑AS1 promotes proliferation and drives enzalutamide resistance in prostate cancer via IGF2BP2‑mediated HMGCS1 mRNA stabilization.Int J Oncol. 2023 Mar;62(3):34. doi: 10.3892/ijo.2023.5482. Epub 2023 Feb 3. Int J Oncol. 2023. PMID: 36734275 Free PMC article.
-
RNA N6-methyladenosine (m6A) modification in HNSCC: molecular mechanism and therapeutic potential.Cancer Gene Ther. 2023 Sep;30(9):1209-1214. doi: 10.1038/s41417-023-00628-9. Epub 2023 May 23. Cancer Gene Ther. 2023. PMID: 37221404 Review.
References
LinkOut - more resources
Full Text Sources
Research Materials

