

miR-155 exerts posttranscriptional control of autoimmune regulator (Aire) and tissue-restricted antigen genes in medullary thymic epithelial cells
- PMID: 35643451
- PMCID: PMC9145475
- DOI: 10.1186/s12864-022-08631-4
miR-155 exerts posttranscriptional control of autoimmune regulator (Aire) and tissue-restricted antigen genes in medullary thymic epithelial cells
Abstract
Background: The autoimmune regulator (Aire) gene is critical for the appropriate establishment of central immune tolerance. As one of the main controllers of promiscuous gene expression in the thymus, Aire promotes the expression of thousands of downstream tissue-restricted antigen (TRA) genes, cell adhesion genes and transcription factor genes in medullary thymic epithelial cells (mTECs). Despite the increasing knowledge about the role of Aire as an upstream transcriptional controller, little is known about the mechanisms by which this gene could be regulated.
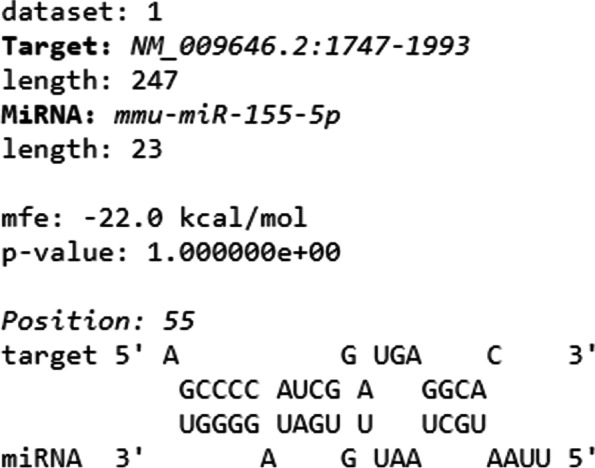
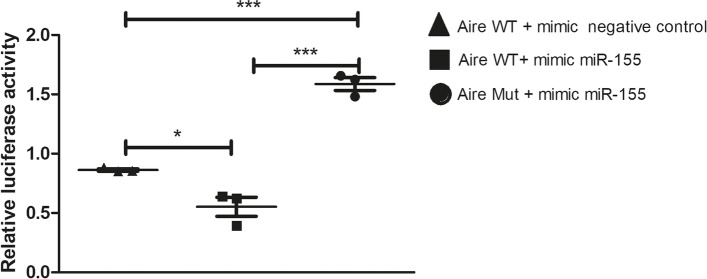
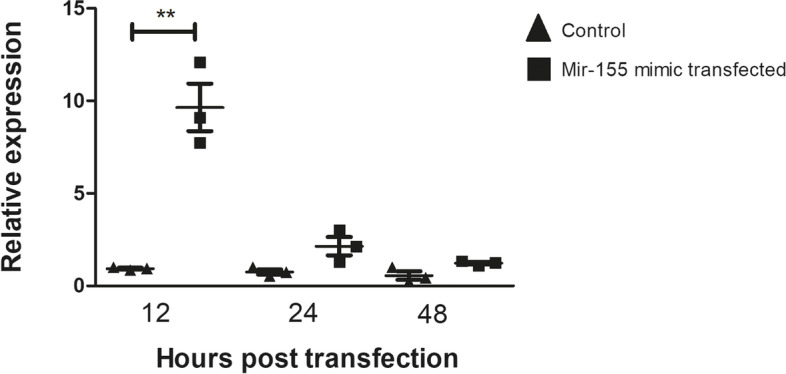
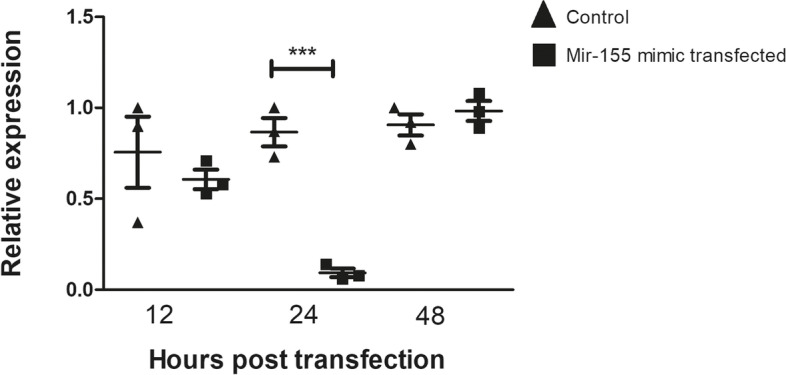
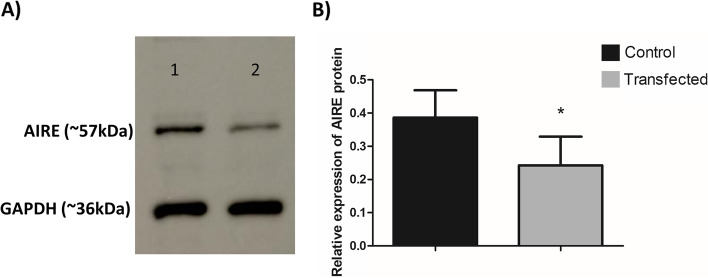
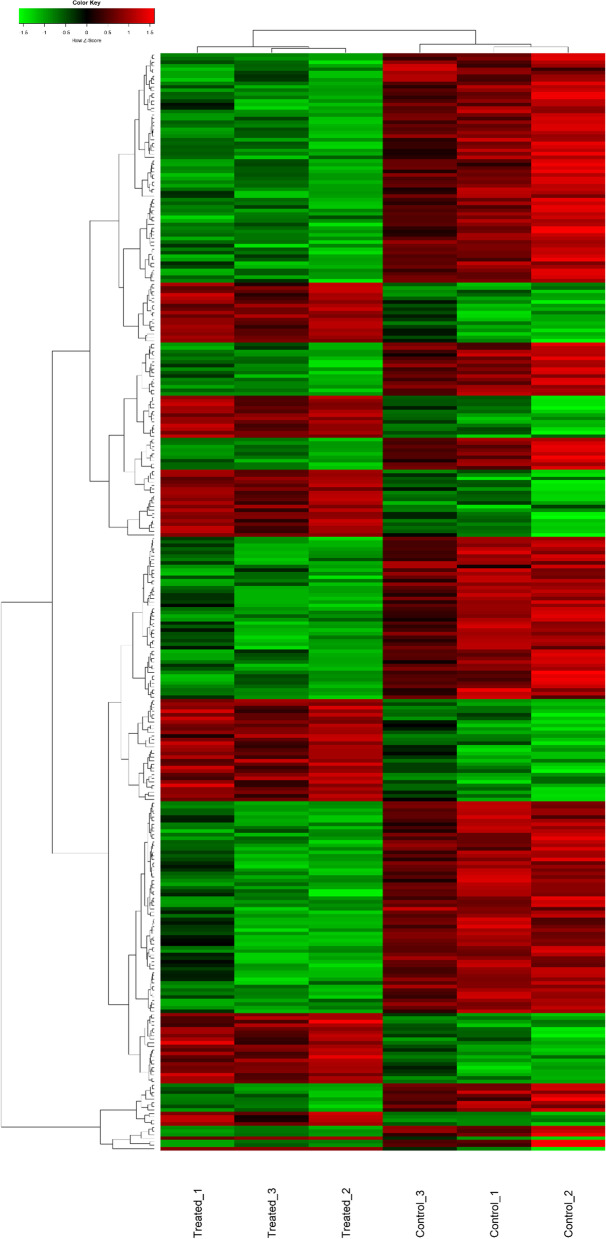
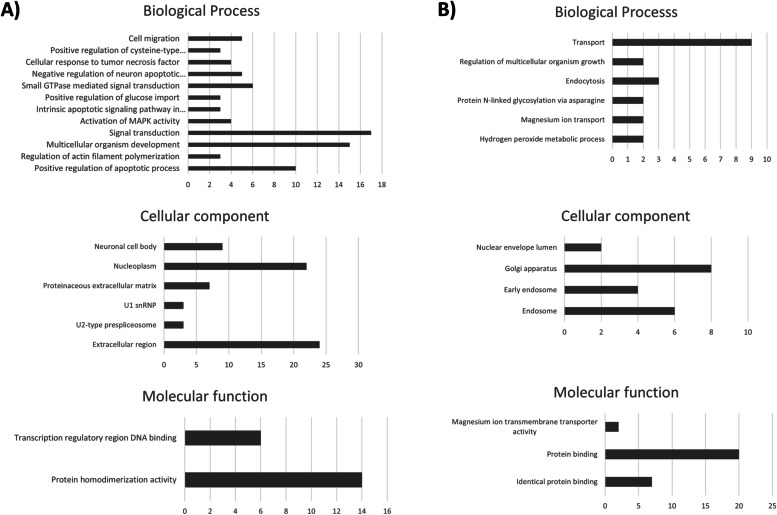
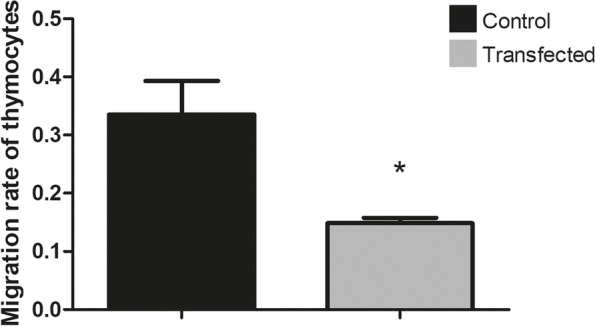
Results: Here, we assessed the posttranscriptional control of Aire by miRNAs. The in silico miRNA-mRNA interaction analysis predicted thermodynamically stable hybridization between the 3'UTR of Aire mRNA and miR-155, which was confirmed to occur within the cellular milieu through a luciferase reporter assay. This finding enabled us to hypothesize that miR-155 might play a role as an intracellular posttranscriptional regulator of Aire mRNA. To test this hypothesis, we transfected a murine mTEC cell line with a miR-155 mimic in vitro, which reduced the mRNA and protein levels of Aire. Moreover, large-scale transcriptome analysis showed the modulation of 311 downstream mRNAs, which included 58 TRA mRNAs. Moreover, miR-155 mimic-transfected cells exhibited a decrease in their chemotaxis property compared with control thymocytes.
Conclusion: Overall, the results indicate that miR-155 may posttranscriptionally control Aire mRNA, reducing the respective Aire protein levels; consequently, the levels of mRNAs encode tissue-restricted antigens were affected. In addition, miR-155 regulated a crucial process by which mTECs allow thymocytes' migration through chemotaxis.
Keywords: Aire; Medullary thymic epithelial cell; Posttranscriptional control; Transwell migration; miR-155.
© 2022. The Author(s).
Conflict of interest statement
Authors declare no competing interests.
Figures
Similar articles
-
Aire Gene Influences the Length of the 3' UTR of mRNAs in Medullary Thymic Epithelial Cells.Front Immunol. 2020 May 28;11:1039. doi: 10.3389/fimmu.2020.01039. eCollection 2020. Front Immunol. 2020. PMID: 32547551 Free PMC article.
-
Aire knockdown in medullary thymic epithelial cells affects Aire protein, deregulates cell adhesion genes and decreases thymocyte interaction.Mol Immunol. 2016 Sep;77:157-73. doi: 10.1016/j.molimm.2016.08.003. Epub 2016 Aug 8. Mol Immunol. 2016. PMID: 27505711
-
Aire Downregulation Is Associated with Changes in the Posttranscriptional Control of Peripheral Tissue Antigens in Medullary Thymic Epithelial Cells.Front Immunol. 2016 Nov 23;7:526. doi: 10.3389/fimmu.2016.00526. eCollection 2016. Front Immunol. 2016. PMID: 27933063 Free PMC article.
-
The Thymic Orchestration Involving Aire, miRNAs, and Cell-Cell Interactions during the Induction of Central Tolerance.Front Immunol. 2015 Jul 14;6:352. doi: 10.3389/fimmu.2015.00352. eCollection 2015. Front Immunol. 2015. PMID: 26236310 Free PMC article. Review.
-
Update on Aire and thymic negative selection.Immunology. 2018 Jan;153(1):10-20. doi: 10.1111/imm.12831. Epub 2017 Sep 26. Immunology. 2018. PMID: 28871661 Free PMC article. Review.
Cited by
-
The single-cell transcriptome of mTECs and CD4+ thymocytes under adhesion revealed heterogeneity of mTECs and a network controlled by Aire and lncRNAs.Front Immunol. 2024 Aug 26;15:1376655. doi: 10.3389/fimmu.2024.1376655. eCollection 2024. Front Immunol. 2024. PMID: 39328409 Free PMC article.
References
-
- Sansom SN, Shikama-Dorn N, Zhanybekova S, Nusspaumer G, Macaulay IC, Deadman ME, et al. Population and single-cell genomics reveal the Aire dependency, relief from Polycomb silencing, and distribution of self-antigen expression in thymic epithelia. Genome Res. 2014;24(12):1918–1931. doi: 10.1101/gr.171645.113. - DOI - PMC - PubMed
-
- Passos GA, Genari AB, Assis AF, Monteleone-Cassiano AC, Donadi EA, Oliveira EH, et al. The thymus as a mirror of the body’s gene expression. In: Passos GA, et al., editors. Thymus transcriptome and cell biology. Cham: Springer-Nature; 2019. pp. 215–234.
MeSH terms
Substances
LinkOut - more resources
Full Text Sources
Research Materials
