. 2022 Jun 10;50(10):5864-5880.
doi: 10.1093/nar/gkac411.

Transcription feedback dynamics in the wake of cytoplasmic mRNA degradation shutdown

Affiliations

Transcription feedback dynamics in the wake of cytoplasmic mRNA degradation shutdown

Alon Chappleboim et al. Nucleic Acids Res. .

Abstract

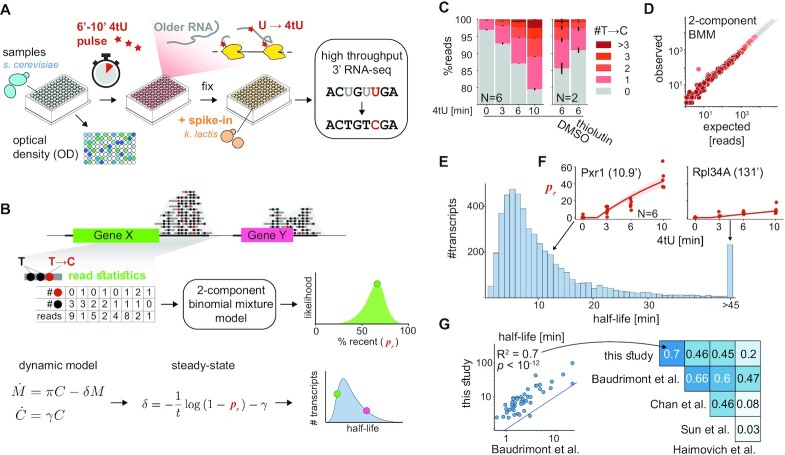
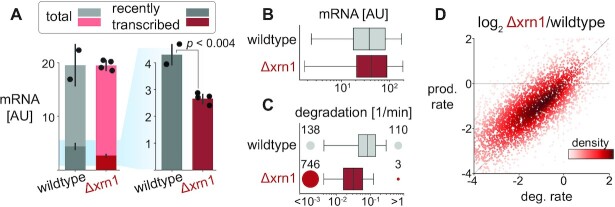
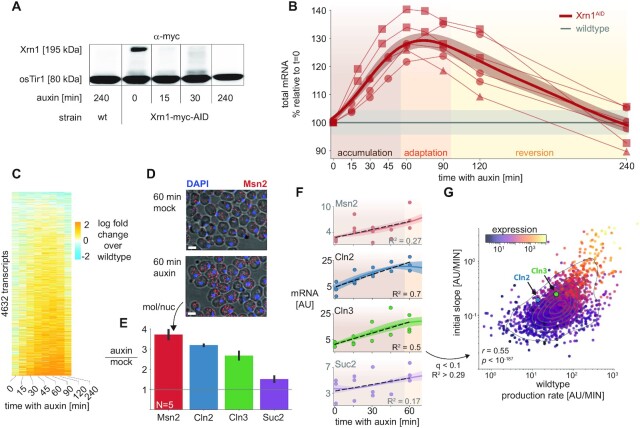
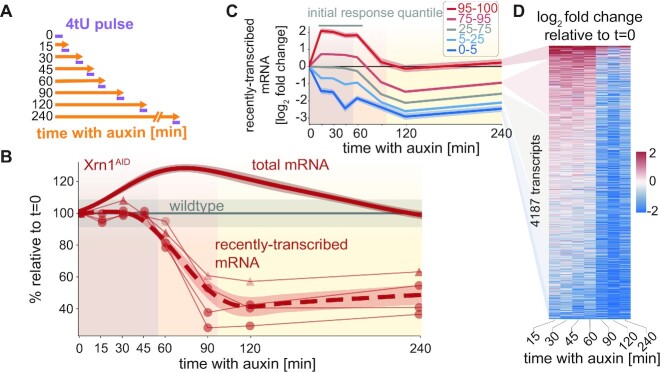
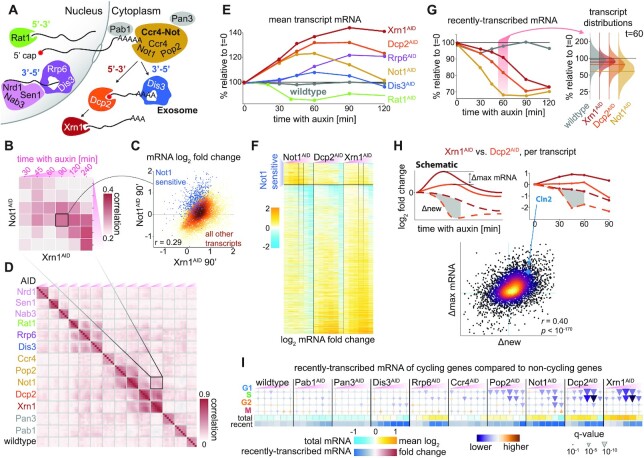
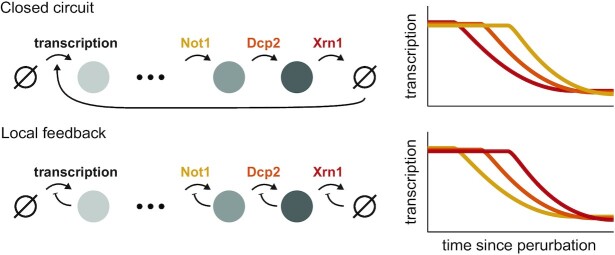
In the last decade, multiple studies demonstrated that cells maintain a balance of mRNA production and degradation, but the mechanisms by which cells implement this balance remain unknown. Here, we monitored cells' total and recently-transcribed mRNA profiles immediately following an acute depletion of Xrn1-the main 5'-3' mRNA exonuclease-which was previously implicated in balancing mRNA levels. We captured the detailed dynamics of the adaptation to rapid degradation of Xrn1 and observed a significant accumulation of mRNA, followed by a delayed global reduction in transcription and a gradual return to baseline mRNA levels. We found that this transcriptional response is not unique to Xrn1 depletion; rather, it is induced earlier when upstream factors in the 5'-3' degradation pathway are perturbed. Our data suggest that the mRNA feedback mechanism monitors the accumulation of inputs to the 5'-3' exonucleolytic pathway rather than its outputs.


Figures

Figure 1.
Figure 1.
cDTA-seq and genome-wide transcript half-life estimation. (A) cDTA-seq protocol outline. 4tU is added to dozens of quantified samples to label new RNA molecules. Cells are then immediately fixed with a pre-fixed constant amount of spike-in cells (K. lactis yeast in this case). RNA is extracted, 4tU is alkylated and RNA-seq libraries are prepared, resulting in T→C conversions where 4tU was incorporated. The entire process is performed in a 96 sample format. (B) Transcript-level analysis outline. Read conversion statistics per gene are fitted with a binomial mixture model to estimate the percent of recently-transcribed molecules (pr). Assuming a first-order kinetic model (C - number of cells, M—number of mRNA molecules, formula image are growth, production, and degradation rates respectively), and assuming steady-state, pr can be translated to transcript half-life given the known labeling period (t). See methods and supplementary material for more details. (C) 4tU conversion is effective, reproducible and measures transcription. Percent of reads (y-axis) along a 4tU time course (x-axis) with a different number of observed T→C conversions (legend, N = 6). Samples exposed to vehicle (DMSO) or the transcription inhibitor thiolutin for 15 min (and labeled with 4tU for 6 min, N = 2). Note that the y-axis begins at 75%, i.e. most reads have no conversions. (D) Binomial Mixture Model (BMM) fits the data. Read conversion statistics are fitted with a 2-component BMM. Each dot represents the number of reads with a certain number of observed Ts and T→C conversions (color as in E). x-axis is the expected number of reads for each (T,T→C) pair assuming the model and the observed #T distribution in the data, the y-axis is the observed number of reads in each (T, T→C) combination. Additional components do not improve the likelihood of the data (Supplementary Figure S1D). (E) Half-life distribution for all yeast transcripts. Assuming steady-state, transcript-specific and global parameters are iteratively fitted, resulting in the half-life of each transcript. The median of the distribution is 8.2', transcripts with a half-life of 45′ or longer are counted in the rightmost bin. (F) Examples of estimated pr along the time course. The individually estimated pr per time point and replicate (N = 6) for two transcripts (Pxr1 and Rpl34A) are shown as red dots along the time course. The data is fitted with a single parameter per gene (degradation rate) resulting in an estimate of 10.9’ half-life for Pxr1 and a 131’ half-life for Rpl34A. Using these estimates, the expected pr along the time course is plotted as a red line with 95% CI as a red shaded area. (G) Half-life estimates correlate with various studies. Half-lives from this and four other published studies are compared to each other and the linear explanatory value (R2) is denoted in the upper diagonal matrix. The scatter depicts a specific example of the comparison between this study and the rates from Baudrimont et al where estimates were not obtained by metabolic labeling.
Figure 2.
Figure 2.
Xrn1 knockout causes a genome-wide decrease in degradation and transcription rates but maintains global mRNA levels. (A) Total mRNA levels are maintained but the recently-transcribed fraction decreases significantly. The amount of total mRNA (y-axis) in wildtype and Δxrn1 is the same (cumulative bars), while the fraction of recently-transcribed molecules decreases significantly (t-test P < 0.004, dark bars, 4tU labeling was performed for 9 min). (B) mRNA distribution is relatively unchanged between Xrn1 and wildtype. Transcript abundance distribution in wildtype (gray) and Δxrn1 (red). Boxes throughout the manuscript mark the interquartile range (IQR) with whiskers at 1.5 × IQR. (C) Xrn1 knockout causes a transcriptome-wide decrease in degradation rates. Transcript degradation rate distributions. Circles (and numbers) to the left and right of boxes correspond to the number of transcripts that are too stable (half-life >3 h, left) or too volatile (half-life < 1 min, right) to be estimated confidently. (D) Changes in degradation and production rates are correlated. Production rates are inferred from mRNA levels and estimated degradation rates (methods). Log2 fold changes between Δxrn1 and wildtype in production rate (x-axis) and degradation rate (y-axis) per transcript (dots, colored by their local density). Pearson r = 0.87, P < 10–300.
Figure 3.
Figure 3.
Xrn1 acute depletion causes a transient increase in mRNA levels. (A) Auxin inducible degradation (AID) of Xrn1 is rapid and stable. Western blot (anti-myc) for Xrn1 tagged with an auxin-inducible degron (AID) and a myc-tag. Shown are the isogenic untagged strain (left), and a time course that demonstrates virtually no Xrn1 protein within 15 min. osTir1 is also tagged with Myc in these strains and is used as a loading control. See also Supplementary Figure S5G. (B) Accumulation of mRNA immediately following Xrn1 depletion. mRNA counts (scaled by spike-in reads) from the Xrn1 depletion time course experiment (x-axis). mRNA is scaled to initial values, and to the corresponding wildtype measurement (y-axis) in a total of six biological replicates (lines) in three different experimental batches (markers). The gray line indicates the wildtype trajectory under the same transformation with standard deviation as a shaded area. The thick red line represents the average of the smoothed interpolations of each separate trajectory. We label the three stages of the response for convenience (accumulation → adaptation → reversion). (C) Genome-wide mRNA accumulation and reversion. mRNA per transcript (y-axis) was normalized with the corresponding measurement from the wildtype time course (time along the x-axis), and the log fold change is color-coded. Transcripts were filtered to not have any missing values along the trajectory (N = 4632, ∼70%), and were sorted by their average log fold change between 15 and 120 min. (D) Single-molecule FISH validation. Composite micrographs (from a confocal Z-stack image), showing DIC image of cells with a max-projection of DAPI stain in blue and fluorescent probes for Msn2 in red (1 μm scale bar). Individual molecules and nuclei are discernible and are counted. Xrn1AID cells were treated with auxin or mock (DMSO) for 60 minutes, fixed, stained, and imaged. A clear increase in molecule counts is observed. (E) Single-molecule FISH quantification. In each field (N = 5), the number of observed molecules is divided by the number of observed nuclei to estimate the mRNA content of each cell in four different probes (x-axis). The y-axis denotes the ratio of the mRNA content in auxin versus mock treatment. (F) scaled RNA trajectories, and rate of accumulation. Each subplot shows the (spike-in scaled) mRNA counts (y-axis, points) from three replicates in the same experiment along the time course following Xrn1 depletion (x-axis). The line is the mean (+SEM) over interpolations of each separate repeat (N = 3). Selected transcripts correspond to smFISH probes (D, E). The dashed black line indicates the linear fit for the accumulation phase of the response (R2 noted per gene). Only fits within the 10% FDR threshold (R2 > 0.29, see S3E) are plotted in (G), Msn2 and Suc2 are shaded and do not appear in (G) as they are below this threshold. (G) mRNA accumulation correlates to transcript production rate. Comparing slopes from the FDR-selected linear fits (y-axis), to the production rate estimated from the wildtype sample (Figure 2D), 30% of the observed variability (R2) can be attributed to the production rate (P < 10–187). Note that there is a strong correlation between the two measures and the overall expression (color-coded, log scale), see text and Supplementary Figure S3F, G.
Figure 4.
Figure 4.
The transcription adaptation response to Xrn1 depletion. (A) AID/cDTA-seq experimental scheme. Cells are grown to the mid-log phase and split. At each indicated time-point auxin is added to an aliquot, and after 4 h (240 min) all are subjected to a short 4tU pulse simultaneously and harvested for cDTA-seq. (B) Recently-transcribed mRNA is reduced by ∼50% after ∼60 min. Global recently-transcribed counts (thin lines) relative to t = 0 from two experiments (markers) are plotted as a function of time since auxin addition (x-axis). The dashed red line represents the average of the smoothed interpolations of each separate trajectory (N = 4). The gray line indicates the wildtype trajectory under the same transformation with standard deviation as a shaded area. The solid red line is the change in total mRNA levels (same as in Figure 3B). (C) Transcription reduction is evident even in genes that were initially upregulated. Transcripts were grouped by their average initial change (15 < t < 60, gray bar above plot) into percentile groups (legend), and the average log fold change trajectory of each group (y-axis) was plotted as a function of time since auxin addition (x-axis). (D) Transcription reduction is abrupt and observed genome-wide. Color-coded log-fold change in recently-transcribed mRNA relative to t = 0 per transcript (y-axis) along the Xrn1 depletion time course (x-axis, excluding t = 0). Transcripts were filtered to not have any missing values along the trajectory (N = 4187, ∼63%), and were sorted by their average log fold change between 15 and 60 min.
Figure 5.
Figure 5.
The transcription adaptation response is induced earlier when the 5′-3′ pathway is perturbed upstream. (A) AID-tagged proteins in this figure. Nuclear factors to the left - Rat1 is the nuclear 5′-3′ exoribonuclease, Nrd1, Sen1 and Nab3 survey aberrant transcripts and recruit the nuclear exosome (Dis3, Rrp6). Mature mRNA leaves the nucleus and will be deadenylated in the cytoplasm by the Ccr4–Not complex (Not1, Pop2, Ccr4). After deadenylation transcripts will continue to degrade 3′-5′ by the cytosolic exosome (Dis3), or 5′-3′ by Xrn1 after decapping by the DCP complex (Dcp2). Pab1 is the polyA binding protein, and Pan3 is part of an alternative deadenylation complex (37). (B) Factors noted in (A) were subjected to a 4-h depletion time course and cDTA-seq (as in Figure 4A). The matrix summarizes the Pearson correlation between the log-fold changes to transcripts relative to t = 0 in Xrn1 and Not1 depletion. Highlighted square corresponds to the scatterplot shown in (C). (C) Correlation between Xrn1 and Not1 depletion. Fold change relative to t = 0 after 90 min in Xrn1AID (x-axis) and Not1AID (y-axis). Changes are generally correlated. Set of Not1-sensitive transcripts are marked in blue, other points are colored by density. Data correspond to marked columns in (F) and marked square in (B). (D) Same as in (B), but comparing all time-course experiments. Highlighted square corresponds to the square depicted in (B). Note that the color scale is different. (E) Average changes to transcripts’ mRNA relative to t = 0 (y-axis) along the time course (x-axis) for factors exhibiting significant correlation to Xrn1 (Supplementary Figure S5A, see Supplementary Figure S5B for the 240’ timepoint). (F) mRNA changes upon interference to the 5′-3′ cytosolic pathway are correlated. Changes to transcripts (rows) along the time-course (x-axis, 15, 30, 45, 60, 90, 120, 240 min) in three time-courses: upon depletion of Xrn1, Dcp2, and Not1. The mRNA log fold change relative to t = 0 is color-coded. Transcripts are split into to Not1-sensitive (N = 672), and the rest of the transcripts (N = 4539). Rows in each set are sorted by the extreme point in a smoothed trajectory of the Xrn1 response. Highlighted columns correspond to the x- and the y-axis in (C). (G) The transcription adaptation response occurs earlier when the 5′-3′ pathway is perturbed upstream. Each line represents the average change (over all transcripts) to recently-transcribed mRNA relative to t = 0 (y-axis) along the depletion time course (x-axis) in each one of the four strains. The transcript-change distribution in each strain at the 60’ time point is detailed on the right, where the median of each distribution is denoted by a horizontal line. (H) Recently-transcribed mRNA differences explain total mRNA differences between strains. To compare the differences in response profiles between strains (in this case, comparing Xrn1 and Dcp2), we calculate the difference between the maximum observed change in mRNA per transcript (‘Δmax’, y-axis in scatter) and between cumulative nascent trajectories (shaded gray area in examples, ‘Δnew’, x-axis in scatter). We plot these statistics per transcript (dots in scatter, color denotes density) and found a significant correlation (Pearson r = 0.4 P < 10–170). See Supplementary Figure S5H for the same comparison between Dcp2 and Not1 (Pearson r = 0.31, P < 10–98). (I) A unique cell-cycle signature when the 5′-3′ degradation pathway is perturbed. We compared the distributions of transcription changes (relative to t = 0) in cell-cycle genes (rows) to the distributions of non-cycling genes (84). Significant deviations are denoted as colored triangles (purple/down—lower than non-cycling genes, orange/up—higher than non-cycling genes, size proportional to Kolmogorov–Smirnov q-value). Each triangle denotes the difference in a specific depletion time point (columns, x-axis time since auxin addition, same as in (B)). The bottom panels denote the average log fold change to mRNA and nascent mRNA in the same samples (same as in E and G). For further details, data, and analysis see supplementary material.
Figure 6.
Figure 6.
Dynamic measurements distinguish between different feedback models. Temporal offsets between different perturbations suggest a local rather than a closed-circuit feedback mechanism. Two toy models that result in global mRNA feedback are presented. In the closed-circuit model (top) transcription is coupled to degradation directly, while the local feedback model (bottom) assumes that each stage self-regulates. The steady-state behavior of both models will be similar, but dynamic measurements can be used to distinguish the two by the delay in the propagation of the interference back to transcription. Our data are more consistent with a local feedback model (see Figure 5).

Similar articles

Cited by

References

    1. Baudrimont A., Voegeli S., Viloria E.C., Stritt F., Lenon M., Wada T., Jaquet V., Becskei A.. Multiplexed gene control reveals rapid mRNA turnover. Sci. Adv. 2017; 3:e1700006. - PMC - PubMed
    1. Yang E., van Nimwegen E., Zavolan M., Rajewsky N., Schroeder M., Magnasco M., Darnell J.E. Jr.. Decay rates of human mRNAs: correlation with functional characteristics and sequence attributes. Genome Res. 2003; 13:1863–1872. - PMC - PubMed
    1. Huch S., Nissan T.. Interrelations between translation and general mRNA degradation in yeast. Wiley Interdiscip. Rev. RNA. 2014; 5:747–763. - PMC - PubMed
    1. Hu W. The interplay between eukaryotic mRNA degradation and translation. Molecular cell biology. 2015; 1:346–353.
    1. Muhlrad D., Decker C.J., Parker R.. Deadenylation of the unstable mRNA encoded by the yeast MFA2 gene leads to decapping followed by 5′→3′ digestion of the transcript. Genes Dev. 1994; 8:855–866. - PubMed

Publication types