

Stochastic expression of invasion genes in Plasmodium falciparum schizonts
- PMID: 35637187
- PMCID: PMC9151791
- DOI: 10.1038/s41467-022-30605-z
Stochastic expression of invasion genes in Plasmodium falciparum schizonts
Abstract
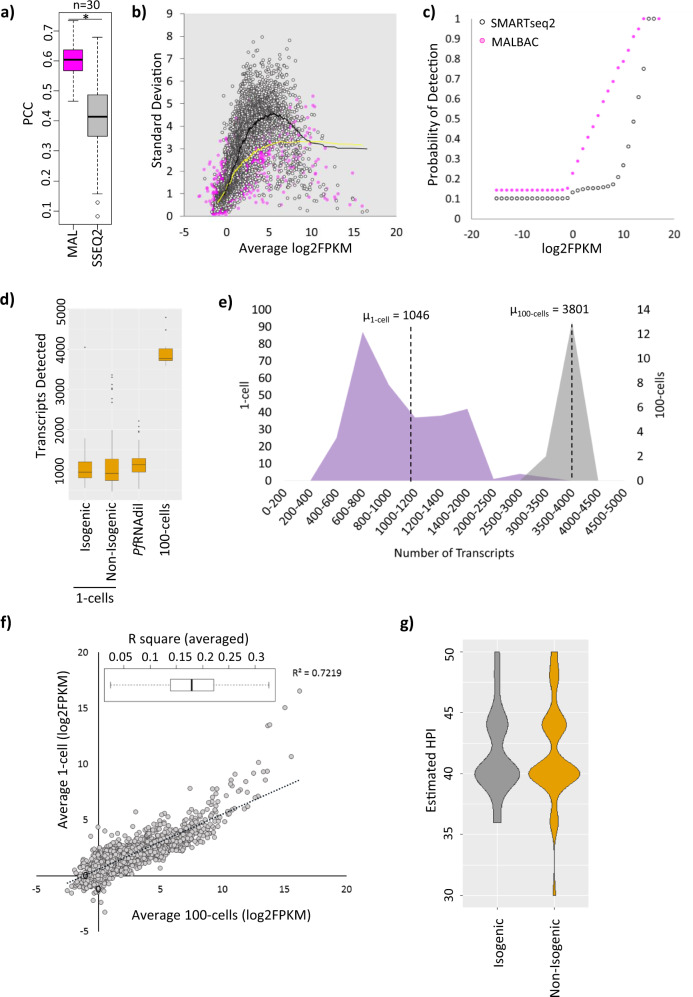
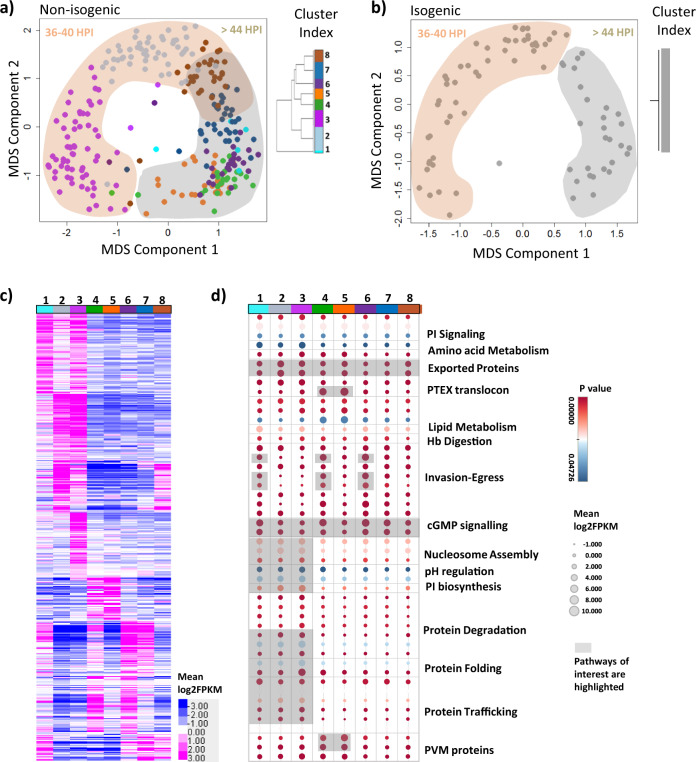
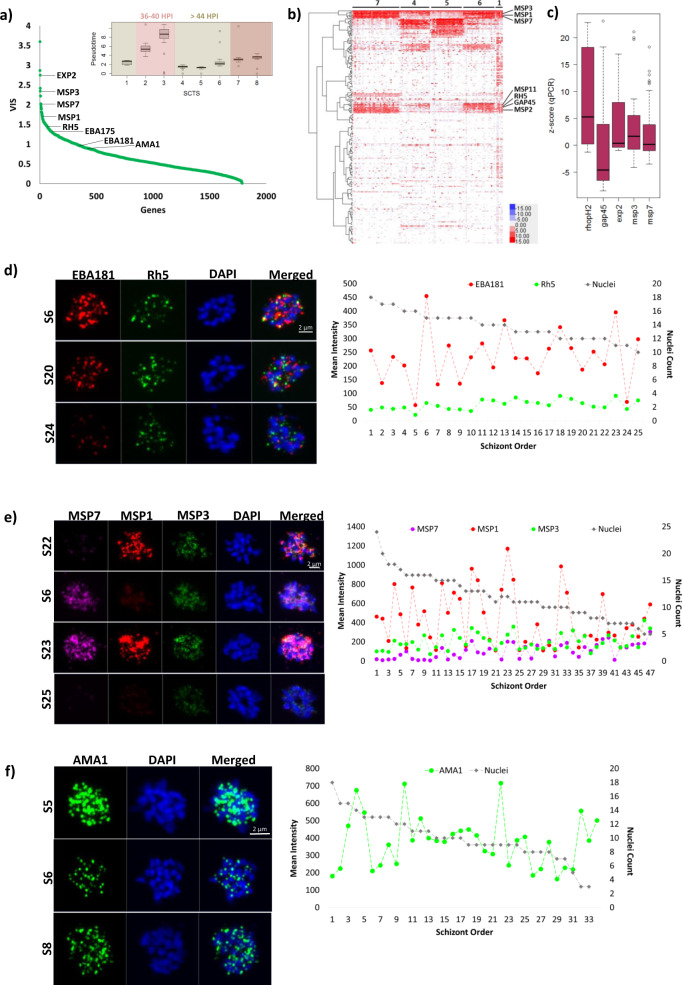
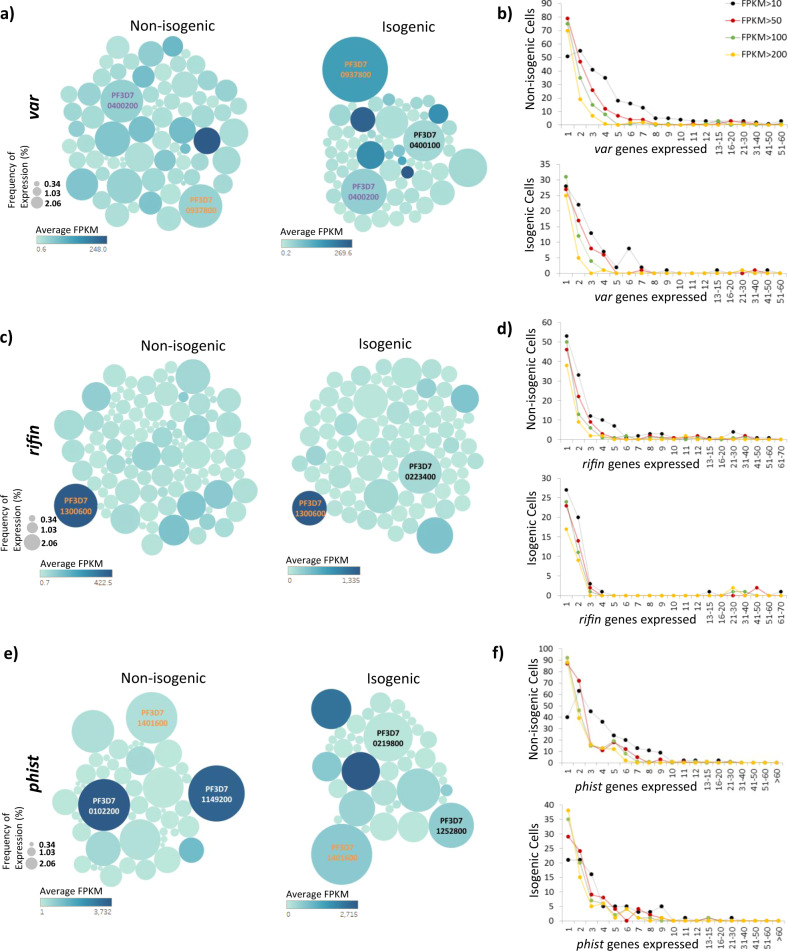
Genetically identical cells are known to exhibit differential phenotypes in the same environmental conditions. These phenotypic variants are linked to transcriptional stochasticity and have been shown to contribute towards adaptive flexibility of a wide range of unicellular organisms. Here, we investigate transcriptional heterogeneity and stochastic gene expression in Plasmodium falciparum by performing the quasilinear multiple annealing and looping based amplification cycles (MALBAC) based amplification and single cell RNA sequencing of blood stage schizonts. Our data reveals significant transcriptional variations in the schizont stage with a distinct group of highly variable invasion gene transcripts being identified. Moreover, the data reflects several diversification processes including putative developmental "checkpoint"; transcriptomically distinct parasite sub-populations and transcriptional switches in variable gene families (var, rifin, phist). Most of these features of transcriptional variability are preserved in isogenic parasite cell populations (albeit with a lesser amplitude) suggesting a role of epigenetic factors in cell-to-cell transcriptional variations in human malaria parasites. Lastly, we apply quantitative RT-PCR and RNA-FISH approach and confirm stochastic expression of key invasion genes, such as, msp1, msp3, msp7, eba181 and ama1 which represent prime candidates for invasion-blocking vaccines.
© 2022. The Author(s).
Conflict of interest statement
The authors declare no competing interests.
Figures
Similar articles
-
Highly Variable Expression of Merozoite Surface Protein MSPDBL2 in Diverse Plasmodium falciparum Clinical Isolates and Transcriptome Scans for Correlating Genes.mBio. 2022 Aug 30;13(4):e0194822. doi: 10.1128/mbio.01948-22. Epub 2022 Aug 11. mBio. 2022. PMID: 35950755 Free PMC article.
-
Schizont transcriptome variation among clinical isolates and laboratory-adapted clones of the malaria parasite Plasmodium falciparum.BMC Genomics. 2018 Dec 10;19(1):894. doi: 10.1186/s12864-018-5257-x. BMC Genomics. 2018. PMID: 30526479 Free PMC article.
-
Single-cell RNA sequencing reveals a signature of sexual commitment in malaria parasites.Nature. 2017 Nov 2;551(7678):95-99. doi: 10.1038/nature24280. Epub 2017 Sep 25. Nature. 2017. PMID: 29094698 Free PMC article.
-
Deletion of the Plasmodium falciparum merozoite surface protein 7 gene impairs parasite invasion of erythrocytes.Eukaryot Cell. 2008 Dec;7(12):2123-32. doi: 10.1128/EC.00274-08. Epub 2008 Sep 26. Eukaryot Cell. 2008. PMID: 18820076 Free PMC article.
-
The varieties of gene amplification, diversification and hypervariability in the human malaria parasite, Plasmodium falciparum.Mol Biochem Parasitol. 2009 Aug;166(2):109-16. doi: 10.1016/j.molbiopara.2009.04.003. Epub 2009 Apr 16. Mol Biochem Parasitol. 2009. PMID: 19375460 Review.
Cited by
-
High-throughput analysis of the transcriptional patterns of sexual genes in malaria.Parasit Vectors. 2023 Jan 13;16(1):14. doi: 10.1186/s13071-022-05624-w. Parasit Vectors. 2023. PMID: 36639683 Free PMC article.
-
Density physics-informed neural networks reveal sources of cell heterogeneity in signal transduction.Patterns (N Y). 2023 Dec 26;5(2):100899. doi: 10.1016/j.patter.2023.100899. eCollection 2024 Feb 9. Patterns (N Y). 2023. PMID: 38370126 Free PMC article.
-
Highly Variable Expression of Merozoite Surface Protein MSPDBL2 in Diverse Plasmodium falciparum Clinical Isolates and Transcriptome Scans for Correlating Genes.mBio. 2022 Aug 30;13(4):e0194822. doi: 10.1128/mbio.01948-22. Epub 2022 Aug 11. mBio. 2022. PMID: 35950755 Free PMC article.
-
Epigenetics and environmental health.Front Med. 2024 Aug;18(4):571-596. doi: 10.1007/s11684-023-1038-2. Epub 2024 May 28. Front Med. 2024. PMID: 38806988 Review.
-
Comparative analysis of codon usage patterns of Plasmodium helical interspersed subtelomeric (PHIST) proteins.Front Microbiol. 2023 Dec 14;14:1320060. doi: 10.3389/fmicb.2023.1320060. eCollection 2023. Front Microbiol. 2023. PMID: 38156001 Free PMC article.
References
-
- World Health Organization. World malaria report 2019. WHO Regional Office for Africahttps://www.who.int/news-room/fact-sheets/detail/malaria (2019).
Publication types
MeSH terms
LinkOut - more resources
Full Text Sources
Molecular Biology Databases
