. 2022 May 13;13(5):874.
doi: 10.3390/genes13050874.

STIM1-Orai1 Interaction Exacerbates LPS-Induced Inflammation and Endoplasmic Reticulum Stress in Bovine Hepatocytes through Store-Operated Calcium Entry

Affiliations

STIM1-Orai1 Interaction Exacerbates LPS-Induced Inflammation and Endoplasmic Reticulum Stress in Bovine Hepatocytes through Store-Operated Calcium Entry

Yang Xue et al. Genes (Basel). .

Abstract

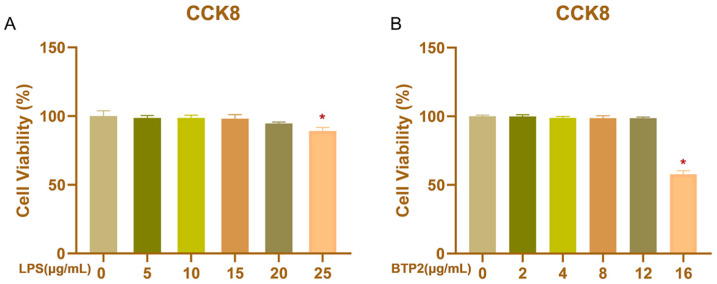
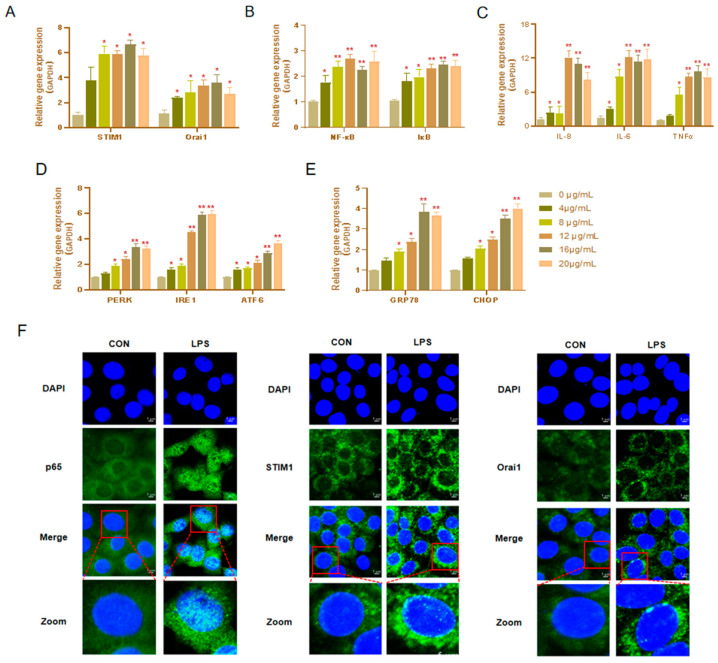
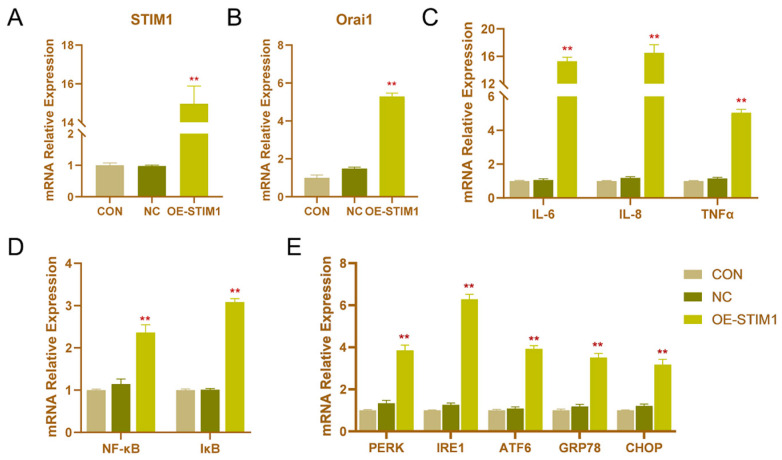
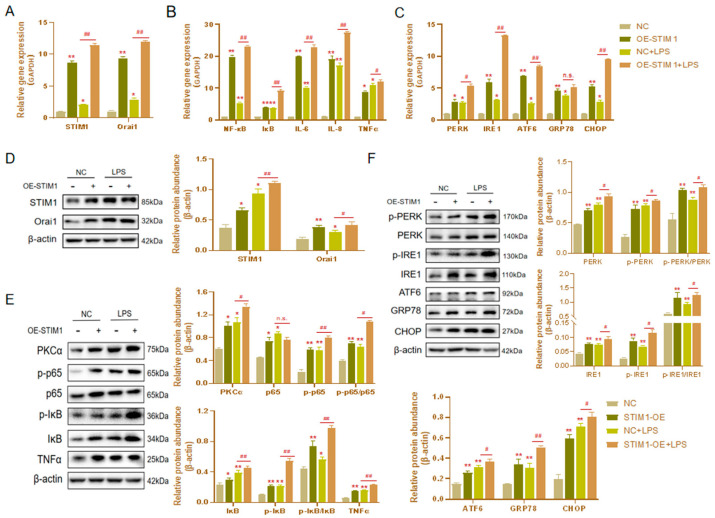
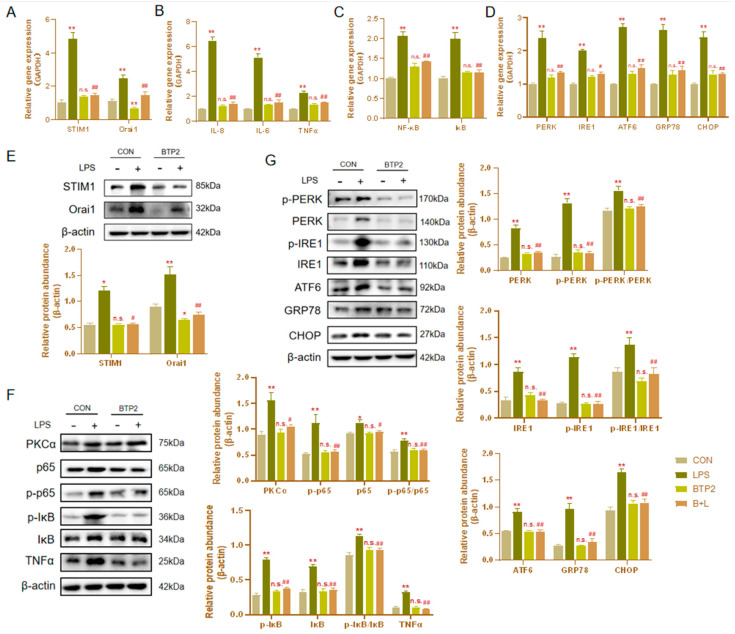
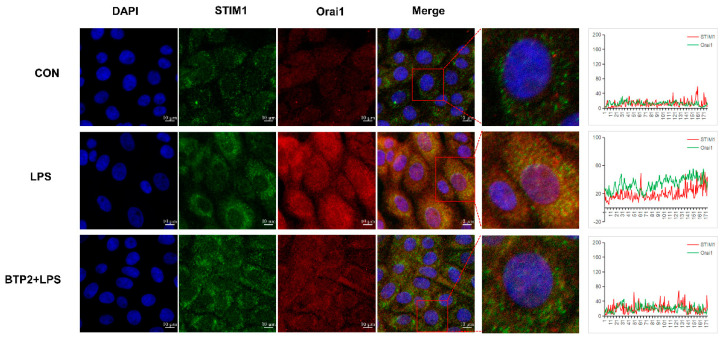
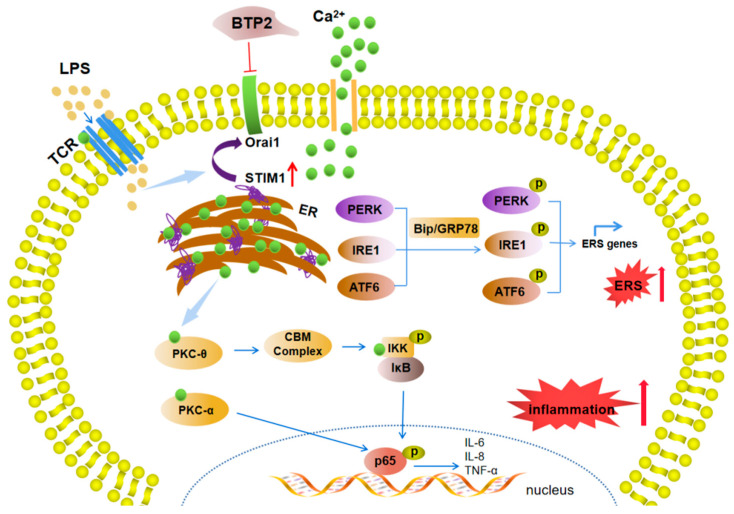
(1) Background: The basic mechanism of store-operated Ca2+ entry (SOCE) in bovine hepatocytes (BHEC) is related to the activation of STIM1 and Orai1. The effect of STIM1- and Orai1-dependent calcium ion signaling on the NF-κB signaling pathway is unclear. (2) Methods: In this study, the expression of STIM1 and Orai1 in BHEC was regulated. RT-qPCR, Western blotting, and an immunofluorescence antibody (IFA) assay were performed to elucidate the effect of inflammation and endoplasmic reticulum stress (ERS) in BHEC. (3) Results: First of all, in this study, RT-PCR and Western blotting were used to detect the levels of IκB, NF-κB, and inflammatory factors (IL-6, IL-8, and TNF-α) and the expression of genes and proteins related to ERS (PERK, IRE1, ATF6, GRP78, and CHOP), which reached peak levels simultaneously when BHEC were treated with 16 μg/mL LPS for 1 h. For STIM1, we overexpressed STIM1 in BHEC by using plasmid transfection technology. The results showed that after overexpression of STIM1, the gene and protein expression of STIM1 levels were significantly upregulated, and the expression of Orai1 on the cell membrane was also upregulated, which directly activated the SOCE channel and induced inflammation and ERS in BHEC. The overexpression group was then treated with LPS, and it was found that the overexpression of STIM1 could enhance LPS-induced BHEC inflammation and ERS in BHEC. For Orai1, BHEC were pretreated with 8 μg/mL of the specific inhibitor BTP2 for 6 h. It was found that BTP2 could inhibit the expression of mRNA in Orai1, significantly reduce the gene expression of STIM1, inhibit the activation of the NF-κB signaling pathway, and alleviate inflammation and ERS in BHEC under LPS stimulation. (4) Conclusions: In conclusion, STIM1/Orai1 can intervene and exacerbate LPS-induced inflammation and ERS in bovine hepatocytes through SOCE.

Keywords: LPS; Orai1; STIM1; endoplasmic reticulum stress; inflammation.


Conflict of interest statement

The authors declare that they have no conflicts of interest.

Figures

Figure 1
Figure 1
The effect of LPS and BTP2 on the viability of bovine hepatocytes (BHECs) was detected by a CCK-8 assay. BHECs were exposed to 0, 5, 10, 15, 20, or 25 μg/mL LPS for 12 h (A) or were treated with 0, 2, 4, 8, 12, or 16 μg/mL BTP2 for 12 h (B). Absorbance was measured at 450 nm to evaluate cell viability. Error bars represent the mean ± SEM (n = 6). * p < 0.05 compared with the controls (0 μg/mL).
Figure 2
Figure 2
Effects of different concentrations of LPS on bovine hepatocytes (BHEC). When the adherent density of BHEC reached about 70%, the BHEC was treated with LPS at 0, 4, 8, 12, 16, or 20 μg/mL for 12 h. Gene expression was normalized with GAPDH as the reference protein. (A) Gene expression of STIM1 and Orai1 in BHECs. (B,C) Gene expression levels of NF-κB, IκB, IL-6, IL-8, and TNF-α. (D,E) Changes in endoplasmic reticulum stress (ERS)-related genes (PERK, IRE1, ATF6, GRP78, CHOP) under different doses of LPS. Error bars represent the means ± SEM (n = 3, n = 3). * p < 0.05, ** p < 0.01 compared with the controls. (F) After treatment with 16 μg/mL LPS for 1 h, the fluorescence signals and position changes of STIM1, Orai1, and p65 in BHEC were observed by confocal immunofluorescence microscopy. DAPI blue fluorescence was used to label the location of the nucleus; FITC green fluorescence was used to label the target proteins.
Figure 3
Figure 3
Effects of the overexpression of STIM1 on inflammation and endoplasmic reticulum stress (ERS) in BHEC. Treatments: BHEC were transfected with overexpressed plasmids and cultured for 48 h. CON, complete control groups; NC, transfected blank plasmid and cultured for 48 h; OE-STIM1, BHEC transfected with overexpressed STIM1 plasmid cultured for 48 h. All groups were cultured without LPS. (A,B) Expression of (A) STIM1 and (B) Orai1 in BHECs. (C,D) Expression of (C) IL-6, IL-8, and TNF-α, and (D) NF-κB and IκB associated with the inflammatory response. (E) Expression levels of ERS-related genes (PERK, IRE1, ATF6, GRP78, and CHOP) in BHEC. Gene expression was normalized to the expression of GAPDH. The results are presented as the means ± SEM., ** p < 0.01.
Figure 4
Figure 4
Effects of STIM1 overexpression on LPS-induced inflammation and endoplasmic reticulum stress (ERS) in BHEC. Treatments: BHEC were transfected with overexpressed plasmids and cultured for 48 h. NC, transfected blank plasmid cultured for 48 h without LPS treatment; OE-STIM1, BHEC transfected with overexpressed STIM1 plasmids that were cultured for 48 h without LPS treatment; LPS, transfected blank plasmids cultured for 48 h, then treated with 16 μg/mL LPS for 1 h; OE-STIM1 + LPS, BHEC transfected with overexpressed STIM1 plasmids that were cultured for 48 h and then treated with 16 μg/mL LPS for 1 h. Gene expression of STIM1/Orai1 (A), inflammatory cytokines (NF-κB, IκB, IL-6, IL-8, and TNF-α) (B), and ERS-related genes (PERK, IRE1, ATF6, GRP78, and CHOP) (C) in BHEC. The protein abundance of STIM1/Orai1 (D), inflammatory cytokines (PKCα, p65, p-p65, IκB, p-IκB, and TNFα) (E), and ERS-related genes (PERK, IRE1, ATF6, GRP78, and CHOP) (F) was normalized to the abundance of β-actin. The results are presented as the means ± SEM. * p < 0.05, ** p < 0.01 indicate that the LPS groups and the OE-STIM1 groups were significantly different from control group. # p < 0.05, ## p < 0.01 indicates the significant difference between the OE-STIM1 + LPS groups and the NC + LPS groups; n.s. indicates no difference between the two groups.
Figure 5
Figure 5
Protein expression and location of STIM1/Orai1 in BMEC. DAPI blue fluorescence was used to label the nuclear locations, FITC green fluorescence was used to label STIM1 protein, and Cy3 red fluorescence was used to label Orai1 protein. ImageJ was used to draw the line graph to show the fluorescence co-location trends.
Figure 6
Figure 6
Effects of the Orai1 inhibitor BTP2 on LPS-induced inflammation and endoplasmic reticulum stress (ERS) in BHEC. Treatments: BHEC were cultured in a BTP2-free medium for 24 h. CON, complete control groups; LPS, cells treated with 16 μg/mL LPS for 1 h; BTP2, pretreatment with 8 μg/mL BTP2 for 6 h without LPS treatment; LPS + BTP2, 8 μg/mL BTP2 for 6 h, followed by 16 μg/mL LPS for 1 h. (AD) Expression levels of STIM1/Orai1 and the genes related to inflammatory cytokines (NF-κB, IκB, IL-6, IL-8, and TNFα) and ERS (PERK, IRE1, ATF6, GRP78, and CHOP) were shown. Gene expression levels were normalized to that of GAPDH. (EG) Protein abundance levels of STIM1/Orai1, PKCα, p65, p-p65, IκB, p-IκB, TNFα, PERK, p-PERK, IRE1, p-IRE1, ATF6, GRP78, and CHOP in BHEC, showing representative bands of the Western blot analysis and the quantified volume of specific bands. The results are presented as the means ± SEM. * p < 0.05, ** p < 0.01 indicate a significant difference between the LPS groups and the control groups; n.s. indicates that there was no significant difference between the BTP2 group and the CON group. # p < 0.05, ## p < 0.01 indicate a significant difference between the BTP2 pretreatment groups and the LPS groups.
Figure 7
Figure 7
Protein expression and location of STIM1/Orai1 in BMEC. DAPI blue fluorescence was used to label the nuclear location, FITC green fluorescence was used to label STIM1 protein, and Cy3 red fluorescence was used to label Orai1 protein. ImageJ was used to draw the line graph to show the fluorescence co-location trends.
Figure 8
Figure 8
Schematic representation shows that Toll-like receptors are stimulated by LPS, activate the STIM1/Orai1-mediated SOCE channel, cause endoplasmic reticulum stress (ERS), and turn on the NF-κB signaling pathway to induce inflammation. The upregulation of STIM1 intensifies LPS-induced inflammation and endoplasmic reticulum stress (ERS), whereas the inhibition of Orai1 alleviates the inflammatory effects of LPS and ERS. LPS, lipopolysaccharide; STIM1, stromal interaction molecule 1; Orai1, calcium release-activated calcium channel protein 1; NF-κB, nuclear factor-kappa B; IκB, inhibitor of NF-κB; PERK, pancreatic elf-2 kinase pancreatic ER kinase; ATF6, activating transcription factor 6; IRE1, inositol requiring enzyme 1; GRP78, glucose-regulated protein 78; CHOP, C/EBP homologous protein; IL-6, interleukin-6; IL-8, interleukin-8; TNF-α, tumor necrosis factor-α.

Similar articles

Cited by

References

    1. Oakes S.A., Papa F.R. The Role of Endoplasmic Reticulum Stress in Human Pathology. Annu. Rev. Pathol. Mech. Dis. 2015;10:173–194. doi: 10.1146/annurev-pathol-012513-104649. - DOI - PMC - PubMed
    1. Gidalevitz T., Stevens F., Argon Y. Orchestration of secretory protein folding by ER chaperones. Biochim. Biophys. Acta. 2013;1833:2410–2424. doi: 10.1016/j.bbamcr.2013.03.007. - DOI - PMC - PubMed
    1. Lin Y., Jiang M., Chen W., Zhao T., Wei Y. Cancer and ER stress: Mutual crosstalk between autophagy, oxidative stress and inflammatory response. Biomed. Pharmacother. 2019;118:109249. doi: 10.1016/j.biopha.2019.109249. - DOI - PubMed
    1. Kleizen B., Braakman I. Protein folding and quality control in the endoplasmic reticulum. Curr. Opin. Cell Biol. 2004;16:343–349. doi: 10.1016/j.ceb.2004.06.012. - DOI - PubMed
    1. Wang J., Yang X., Zhang J. Bridges between mitochondrial oxidative stress, ER stress and mTOR signaling in pancreatic beta cells. Cell Signal. 2016;28:1099–1104. doi: 10.1016/j.cellsig.2016.05.007. - DOI - PubMed

Publication types

Grants and funding

This project was financially supported by grants from the National Natural Science Foundation of China (grants 31872528, 32172933), the Key R&D Program of Ningxia Hui Autonomous Region of China (21BEF02019), the Fundamental Research Funds for the Central Universities (grant KYXJ202005), and the Priority Academic Program Development of Jiangsu Higher Education Institutions (PAPD, Nanjing, China).