. 2022 May 20;11(10):1705.
doi: 10.3390/cells11101705.

Interleukin-6 Signaling in Triple Negative Breast Cancer Cells Elicits the Annexin A1/Formyl Peptide Receptor 1 Axis and Affects the Tumor Microenvironment

Affiliations

Interleukin-6 Signaling in Triple Negative Breast Cancer Cells Elicits the Annexin A1/Formyl Peptide Receptor 1 Axis and Affects the Tumor Microenvironment

Lara Vecchi et al. Cells. .

Abstract

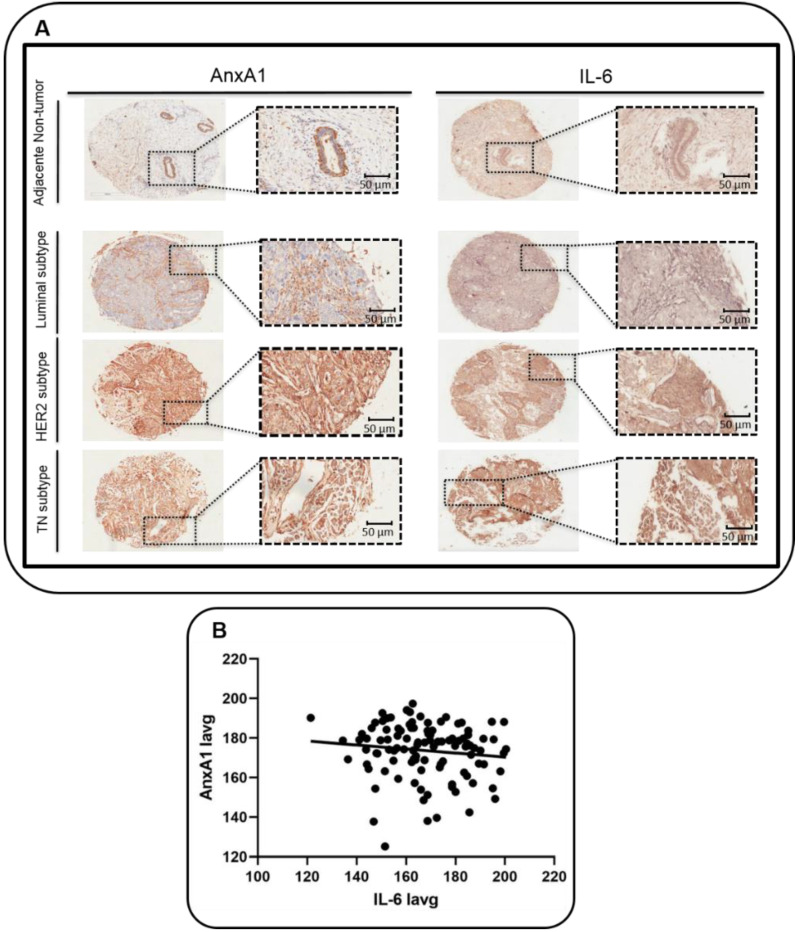
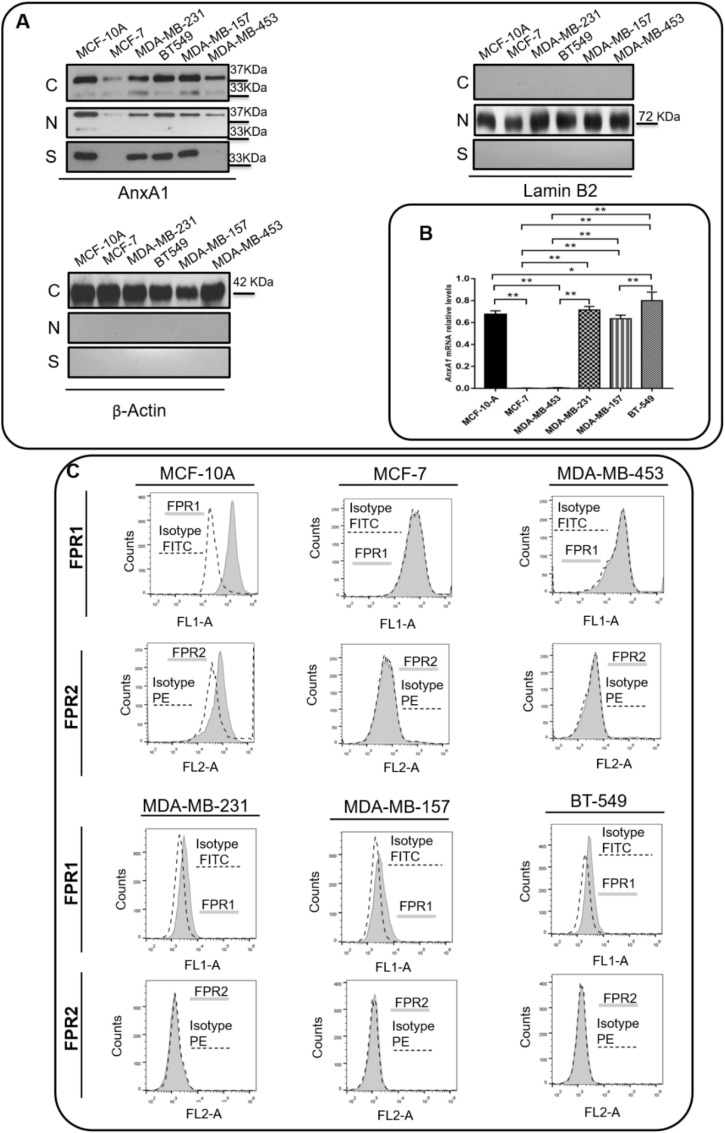
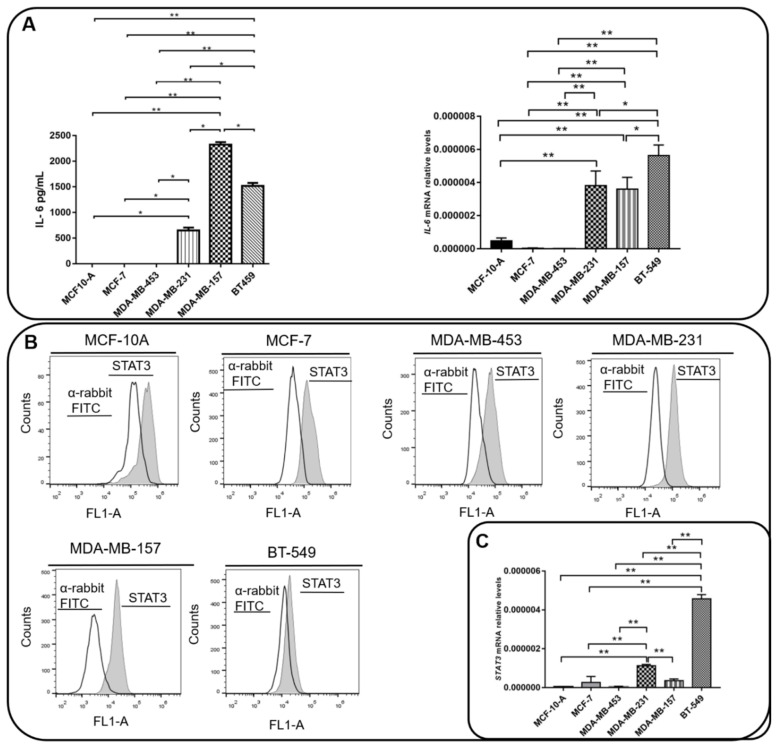
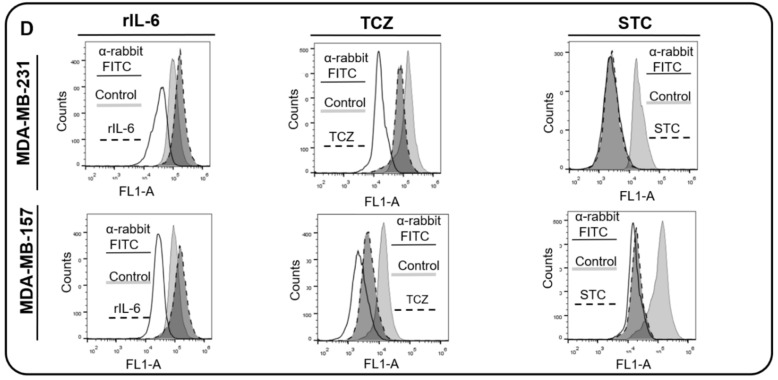
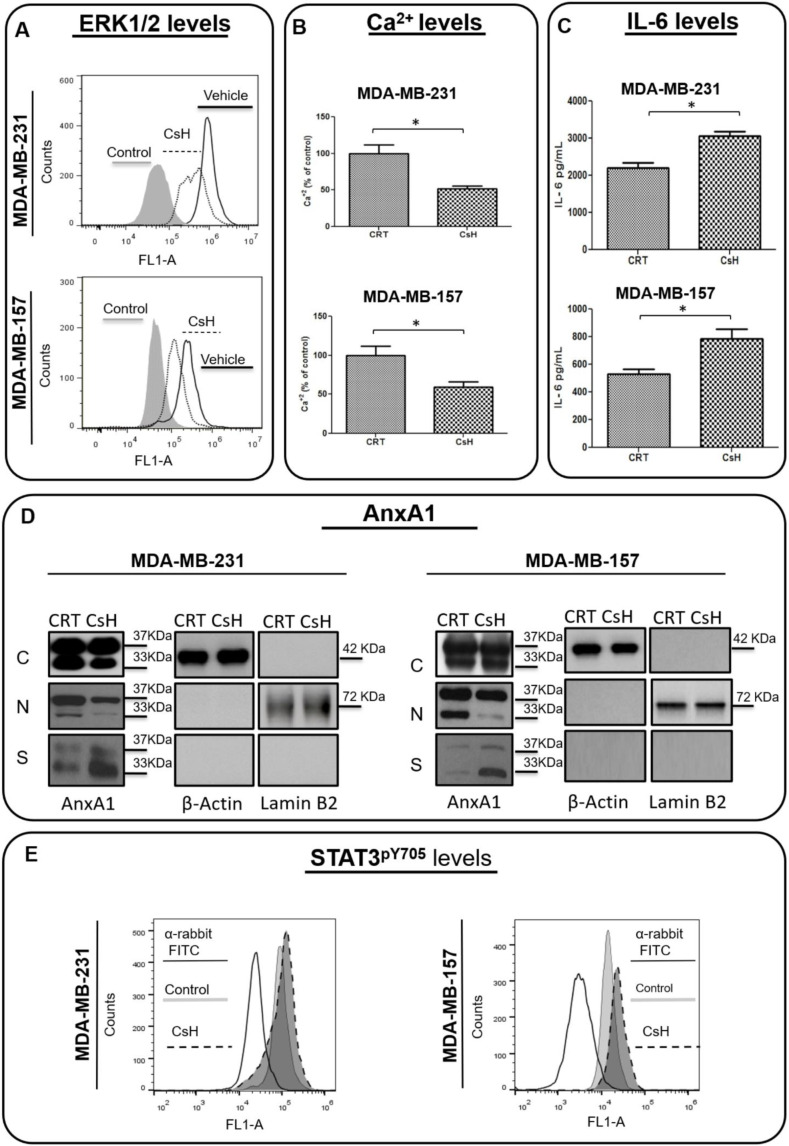
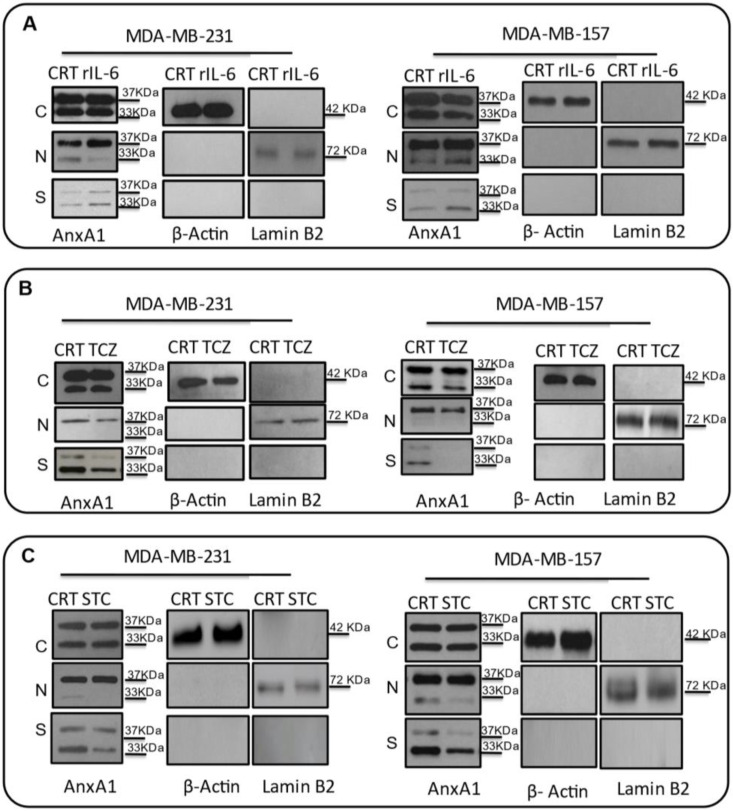
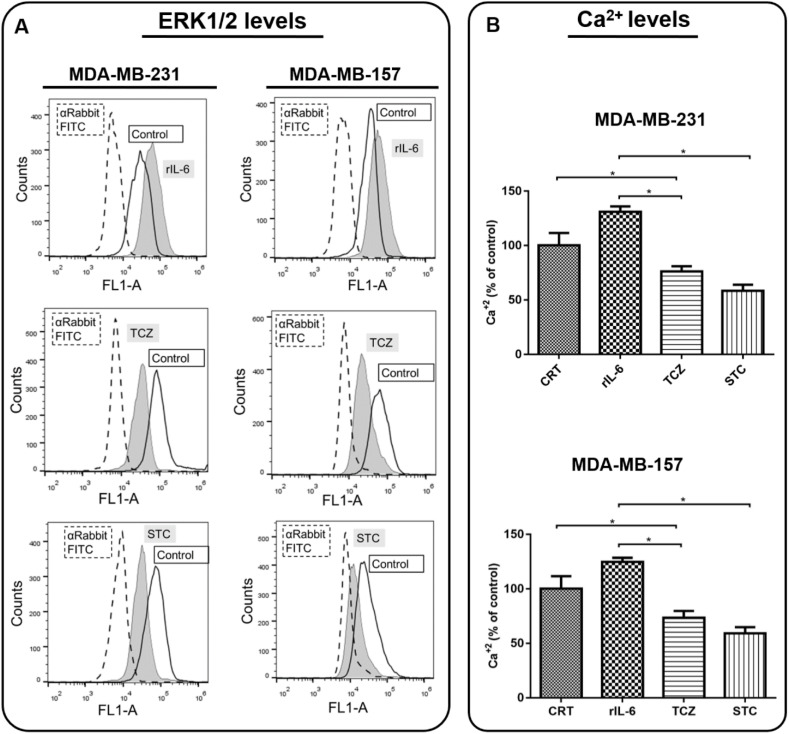
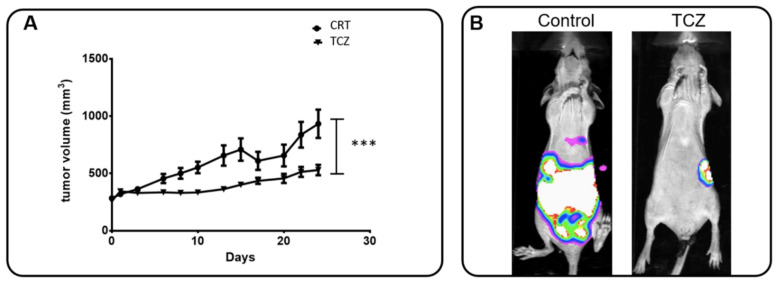
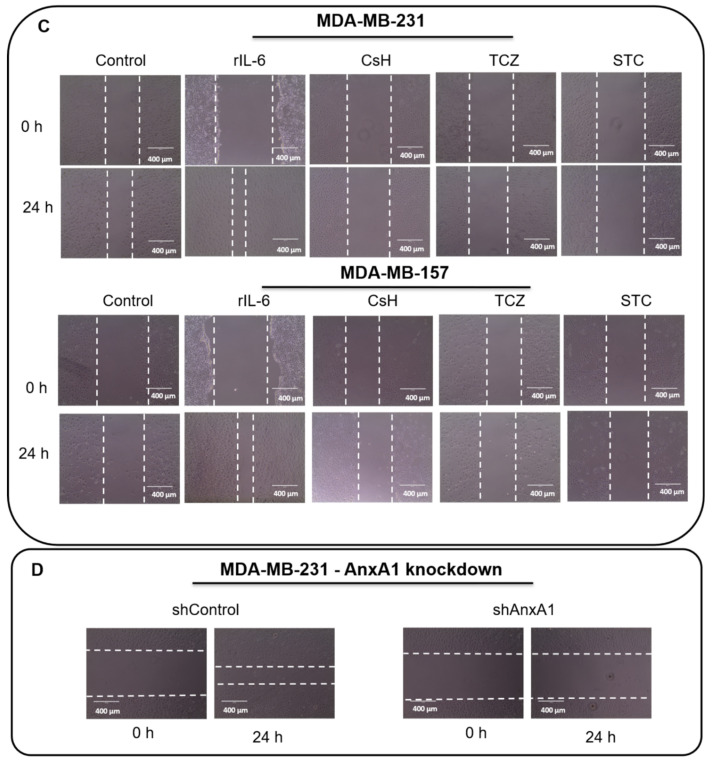
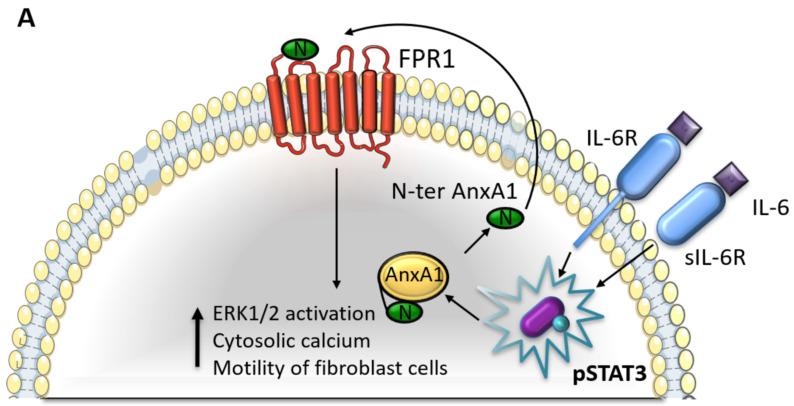
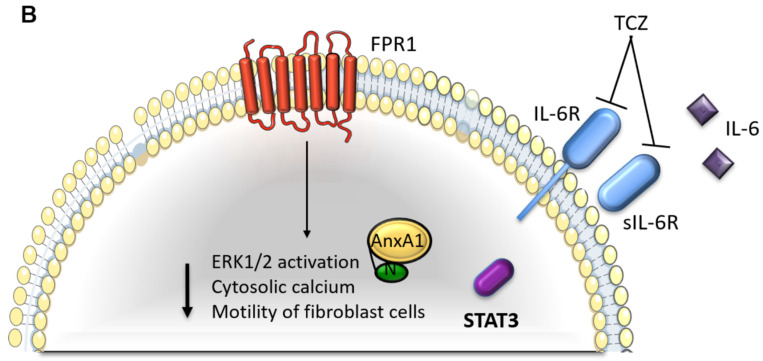
Annexin A1 (AnxA1) is a pleiotropic protein that exerts essential roles in breast cancer (BC) growth and aggressiveness. In our previous work, we described the autocrine signaling of AnxA1 through formyl peptide receptor 1 (FPR1) in the triple-negative (TN) BC cell line, MDA-MB-231. Here, we aimed to describe the interaction between the AnxA1/FPR1 and the Interleukin-6 (IL-6) signaling pathways and their role in the tumor microenvironment (TME). First, we demonstrated that AnxA1 and IL-6 expression levels are correlated in BC tissue samples. In three TNBC cell lines, overexpression of both AnxA1 and IL-6 was also identified. Next, we inhibited FPR1, the IL-6 receptor and STAT3 in both MDA-MB-231 and MDA-MB-157 cells. The FPR1 inhibition led to increased levels of IL-6 and secreted AnxA1 in both cell lines. On the other side, inhibition of the IL-6 receptor or STAT3 led to the impairment of AnxA1 secretion, suggesting the essential role of the IL-6 signaling cascade in the activation of the AnxA1/FPR1 autocrine axis. Finally, we described the interaction between IL-6 and the AnxA1/FPR1 pathways and their role on the TME by analyzing the effect of supernatants derived from MDA-MB-231 and MDA-MB-157 cells under the inhibition of FPR1 or IL-6 signaling on fibroblast cell motility.

Keywords: Annexin A1; IL-6; STAT3; autocrine signaling; breast cancer; formyl peptide receptor.


Conflict of interest statement

The authors report no declarations of interest.

Figures

Figure 1
Figure 1
Expression of Annexin A1 (AnxA1) and Interleukin-6 (IL-6) in tumor and adjacent non-tumor breast tissues. (A) Representative images of adjacent non-tumor breast tissue, and of the tumor subtypes Luminal, HER2-enriched and Triple negative (TN). Tissue microarrays (TMA) were stained for AnxA1 and IL-6 through immunohistochemistry. Outset shows the magnified image of the corresponding panel (20 × with the outset showing a 40 × aperture magnified view of the same TMA spot). Scale bar = 50 μm (magnification). (B) Correlation between the expression of AnxA1 and IL-6 evaluated by linear regression (R2 = 0.96 and p < 0.00001). Iavg: average intensity of all pixels.
Figure 2
Figure 2
TNBC cell lines express Annexin A1 (AnxA1). (A) The cropped Western blotting of AnxA1 expression in cytoplasm (C), nuclei (N), and supernatants (S) of MCF-10, MCF-7, MDA-MB-231, BT-549, MDA-MB-157 and MDA-MB-453 cells. Full length AnxA1 (37 kDa) and the cleaved AnxA1 form (33 kDa) were detected. β-Actin (42 kDa) and Laminin B2 (72 kDa) were used to check the proper cell fractionation and as loading controls of cytoplasmic and nuclear extracts, respectively. (B) ANXA1 mRNA relative level of MCF-10, MCF-7, MDA-MB-231, BT-549, MDA-MB-157 and MDA-MB-453 cells. (C) Expression analysis of AnxA1 receptors (FPR1 and FPR2) on the cell surface of MCF-10, MCF-7, MDA-MB-231, BT-549, MDA-MB-157 and MDA-MB-453 cells by flow cytometry (black peak with tracing line). As the negative control, the secondary antibody alone was used (solid gray peak). Three independent experiments were performed. * p < 0.05; ** p < 0.001.
Figure 3
Figure 3
Interleukin 6 (IL-6) and STAT3 expression in BC cells. (A) IL-6 levels were measured by ELISA assay in supernatants of MCF-10, MCF-7, MDA-MB-231, BT-549, MDA-MB-157 and MDA-MB-453 cells. IL-6 mRNA relative levels of MCF-10, MCF-7, MDA-MB-231, BT-549, MDA-MB-157 and MDA-MB-453 cells were also recorded. (B) Expression of activated STAT3 (STAT3pY705) in MCF-10, MCF-7, MDA-MB-231, BT-549, MDA-MB-157 and MDA-MB-453 cells was analyzed by flow cytometry (gray peak). As the negative control, the secondary antibody alone was used (white peak). (C) STAT3 mRNA relative levels of MCF-10, MCF-7, MDA-MB-231, BT-549, MDA-MB-157 and MDA-MB-453 cells. (D) STAT3 phosphorylation levels (STAT3pY705-dark gray peak with tracing line) were analyzed in MDA-MB-231 and MDA-MB-157 cells treated with Tocilizumab (TCZ), recombinant IL-6 (rIL-6) and STAT3 inhibitor, STATTIC (STC). As the negative control, the secondary antibody alone was used (white peak). * p < 0.05; ** p < 0.001. Three independent experiments were performed.
Figure 3
Figure 3
Interleukin 6 (IL-6) and STAT3 expression in BC cells. (A) IL-6 levels were measured by ELISA assay in supernatants of MCF-10, MCF-7, MDA-MB-231, BT-549, MDA-MB-157 and MDA-MB-453 cells. IL-6 mRNA relative levels of MCF-10, MCF-7, MDA-MB-231, BT-549, MDA-MB-157 and MDA-MB-453 cells were also recorded. (B) Expression of activated STAT3 (STAT3pY705) in MCF-10, MCF-7, MDA-MB-231, BT-549, MDA-MB-157 and MDA-MB-453 cells was analyzed by flow cytometry (gray peak). As the negative control, the secondary antibody alone was used (white peak). (C) STAT3 mRNA relative levels of MCF-10, MCF-7, MDA-MB-231, BT-549, MDA-MB-157 and MDA-MB-453 cells. (D) STAT3 phosphorylation levels (STAT3pY705-dark gray peak with tracing line) were analyzed in MDA-MB-231 and MDA-MB-157 cells treated with Tocilizumab (TCZ), recombinant IL-6 (rIL-6) and STAT3 inhibitor, STATTIC (STC). As the negative control, the secondary antibody alone was used (white peak). * p < 0.05; ** p < 0.001. Three independent experiments were performed.
Figure 4
Figure 4
Effects of Cyclosporin H (CsH) treatment on the Annexin A1 (AnxA1) expression and formyl peptide receptor 1 (FPR1)-downstream cellular events in MDA-MB-231 and MDA-MB-157 cells. All treatments were conducted with 1 μM of CsH for 24 h. (A) The expression of phosphorylated ERK1/2 (ERK1pT202/Y204 + ERK2pT185/Y187) was measured using flow cytometry in treated and not-treated control cells. (B) Cytosolic calcium levels were measured by using Fluo 4 AM in MDA-MB-231 and MDA-MB-157 cells in the presence or absence of CsH. (C) IL-6 levels were measured by the ELISA assay in the supernatant of cells. (D) The cropped Western blotting of the AnxA1 expression in the cytoplasm (C), nuclei (N), and supernatants (S) of MDA-MB-231 and MDA-MB-157 cells treated or not treated (control) with CsH. β-Actin and Lamin B2 were used to check the proper cell fractionation and as loading controls of cytoplasmic and nuclear extracts, respectively. (E) STAT3 phosphorylation levels (STAT3pY705) were analyzed in cells treated with CsH compared to control cells (not treated). * p < 0.05. Three independent experiments were performed.
Figure 5
Figure 5
Effects on the Annexin A1 (AnxA1) expression in MDA-MB-231 and MDA-MB-157 after the stimulation and inhibition of the IL-6 pathway. The cropped Western blotting of AnxA1 expression in the cytoplasm (C), nuclei (N), and supernatants (S) of MDA-MB-231 and MDA-MB-157 cells. (A) Cells were treated for 24 h with 1 μM of recombinant human IL-6 (rIL-6). (B) Cells were treated for 24 h with 1 μM of neutralizing antibody anti-human IL-6 (Tocilizumab; TCZ), and (C) cells were treated for 24 h with 1 μM of an inhibitor of the IL-6 signaling pathway molecule, STAT3 (STATTIC; STC). β-Actin and Lamin B2 were used to check the proper cell fractionation and as loading controls of cytoplasmic and nuclear extracts, respectively. Three independent experiments were performed.
Figure 6
Figure 6
Analysis of the Interleukin 6 (IL-6) signaling pathway downstream cellular events in MDA-MB-231 and MDA-MB-157. Cells were treated with recombinant human IL-6 (rIL-6), with neutralizing antibody anti-human IL-6 (Tocilizumab; TCZ), and with an inhibitor of the IL-6 signaling pathway molecule, STAT3 (STATTIC; STC), for 24 h. Untreated cells were used as the control (A). The expression of phosphorylated ERK1/2 was measured using flow cytometry. (B) Cytosolic calcium levels were measured by using Fluo 4 AM. * p < 0.05. Three independent experiments were performed.
Figure 7
Figure 7
Tocilizumab (TCZ) inhibits tumor growth and distal metastasis in the in vivo model and influences the motility of fibroblast cells. (A) Female nude mice bearing MDA-MB-231 tumors were treated with the control solution (PBS + DMSO 5%) or TCZ (10 mg/kg) 3 times a week for 1 month. The volumes (in mm3) of primary tumors were measured at each corresponding time point. Date show that TCZ treatment totally inhibited (significantly at p = 0.0005, analyzed by Paired Student’s t-test) the primary tumor growth. (B) After tumor removal, tumor relapse and spontaneous metastasis occurrence were monitored via bioluminescence imaging and representative mice for groups were exemplified (control: n = 11; TCZ: n = 7). (C) The supernatants derived from MDA-MB-231 and MDA-MB-157 cells were used to evaluate the motility of fibroblast cells (HFF) by a wound-healing assay in the presence of recombinant human IL-6 (rIL-6), Cyclosporin H (CsH), STATTIC (STC) and TCZ. Cells were scratched with a cell scraper and photographed by phase-contrast 221 microscopy. Representative images show cell migration at 0 h and after 24 h. (D) The supernatants derived from the MDA-MB-231 cell line stably knocked down for AnxA1 (shAnxA1) were used to evaluate the motility of HFF and were compared to the MDA-MB-231 cell line stably expressing a control shRNA (shControl). Three independent experiments were performed. Scale bar = 400 µm.
Figure 7
Figure 7
Tocilizumab (TCZ) inhibits tumor growth and distal metastasis in the in vivo model and influences the motility of fibroblast cells. (A) Female nude mice bearing MDA-MB-231 tumors were treated with the control solution (PBS + DMSO 5%) or TCZ (10 mg/kg) 3 times a week for 1 month. The volumes (in mm3) of primary tumors were measured at each corresponding time point. Date show that TCZ treatment totally inhibited (significantly at p = 0.0005, analyzed by Paired Student’s t-test) the primary tumor growth. (B) After tumor removal, tumor relapse and spontaneous metastasis occurrence were monitored via bioluminescence imaging and representative mice for groups were exemplified (control: n = 11; TCZ: n = 7). (C) The supernatants derived from MDA-MB-231 and MDA-MB-157 cells were used to evaluate the motility of fibroblast cells (HFF) by a wound-healing assay in the presence of recombinant human IL-6 (rIL-6), Cyclosporin H (CsH), STATTIC (STC) and TCZ. Cells were scratched with a cell scraper and photographed by phase-contrast 221 microscopy. Representative images show cell migration at 0 h and after 24 h. (D) The supernatants derived from the MDA-MB-231 cell line stably knocked down for AnxA1 (shAnxA1) were used to evaluate the motility of HFF and were compared to the MDA-MB-231 cell line stably expressing a control shRNA (shControl). Three independent experiments were performed. Scale bar = 400 µm.
Figure 8
Figure 8
Interaction between Annexin A1 (AnxA1) and Interleukin 6 (IL-6) in breast cancer. (A) IL-6 signaling pathway in MDA-MB-231 and MDA-MB-157 cells. (B) Cellular events in MDA-MB-231 and MDA-MB-157 lineages after the inhibition of IL-6 signaling using Tocilizumab (TCZ), decreasing STAT3 phosphorylation levels (pSTAT3). FPR1: formyl peptide receptor 1; IL-6R: IL-6-receptor; sIL-6R: soluble form of IL-6 receptor.
Figure 8
Figure 8
Interaction between Annexin A1 (AnxA1) and Interleukin 6 (IL-6) in breast cancer. (A) IL-6 signaling pathway in MDA-MB-231 and MDA-MB-157 cells. (B) Cellular events in MDA-MB-231 and MDA-MB-157 lineages after the inhibition of IL-6 signaling using Tocilizumab (TCZ), decreasing STAT3 phosphorylation levels (pSTAT3). FPR1: formyl peptide receptor 1; IL-6R: IL-6-receptor; sIL-6R: soluble form of IL-6 receptor.

Similar articles

Cited by

References

    1. Harborg S., Zachariae R., Olsen J., Johannsen M., Cronin-Fenton D., Bøggild H., Borgquist S. Overweight and prognosis in triple-negative breast cancer patients: A systematic review and meta-analysis. Npj Breast Cancer. 2021;7:119. doi: 10.1038/s41523-021-00325-6. - DOI - PMC - PubMed
    1. Huang J., Chan P.S., Lok V., Chen X., Ding H., Jin Y., Yuan J., Lao X.-Q., Zheng Z.-J., Wong M.C. Global incidence and mortality of breast cancer: A trend analysis. Aging. 2021;13:5748–5803. doi: 10.18632/aging.202502. - DOI - PMC - PubMed
    1. Burguin A., Diorio C., Durocher F. Breast Cancer Treatments: Updates and New Challenges. J. Pers. Med. 2021;11:808. doi: 10.3390/jpm11080808. - DOI - PMC - PubMed
    1. Rossing M., Pedersen C.B., Tvedskov T., Vejborg I., Talman M.-L., Olsen L.R., Kroman N., Nielsen F.C., Jensen M.-B., Ejlertsen B. Clinical implications of intrinsic molecular subtypes of breast cancer for sentinel node status. Sci. Rep. 2021;11:2259. doi: 10.1038/s41598-021-81538-4. - DOI - PMC - PubMed
    1. Kanwal B. Untangling Triple-Negative Breast Cancer Molecular Peculiarity and Chemo-Resistance: Trailing Towards Marker-Based Targeted Therapies. Cureus. 2021;13:e16636. doi: 10.7759/cureus.16636. - DOI - PMC - PubMed

Publication types

MeSH terms

Grants and funding

This research was funded by Fundação de Amparo a Pesquisa de Minas Gerais (FAPEMIG-Project APQ-00760-18 and REMITRIBIC RED-00031-21), Conselho Nacional de Desenvolvimento Científico e Tecnológico (CNPq), Coordenadoria de Aperfeiçoamento de Pessoal de Nível Superior (CAPES), and the National Institute of Science and Technology in Theranostics and Nanobiotechnology-INCT–Teranano and Public Labour Prosecution Office (MPT-Patos de Minas), Fundação de Amparo a Pesquisa do Estado de São Paulo (FAPESP-Projects 2015-02098-3 and 2009/14027-2).