. 2022 May 12;14(10):2377.
doi: 10.3390/cancers14102377.

Mutation of PTPN11 (Encoding SHP-2) Promotes MEK Activation and Malignant Progression in Neurofibromin-Deficient Cells in a Manner Sensitive to BRAP Mutation

Affiliations

Mutation of PTPN11 (Encoding SHP-2) Promotes MEK Activation and Malignant Progression in Neurofibromin-Deficient Cells in a Manner Sensitive to BRAP Mutation

Ritsuko Harigai et al. Cancers (Basel). .

Abstract

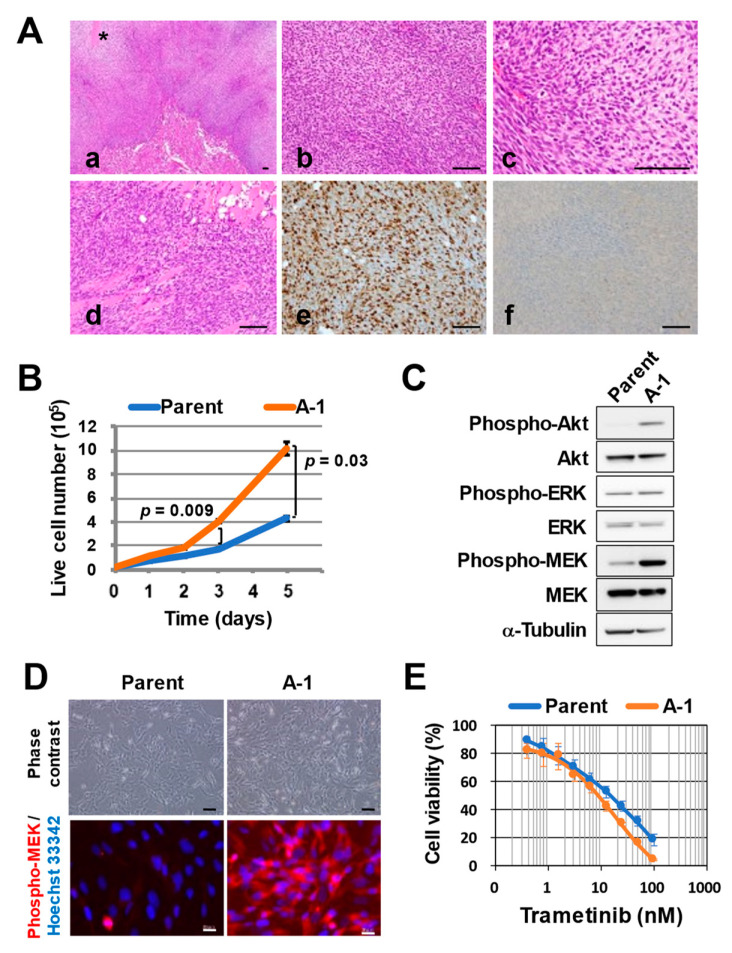
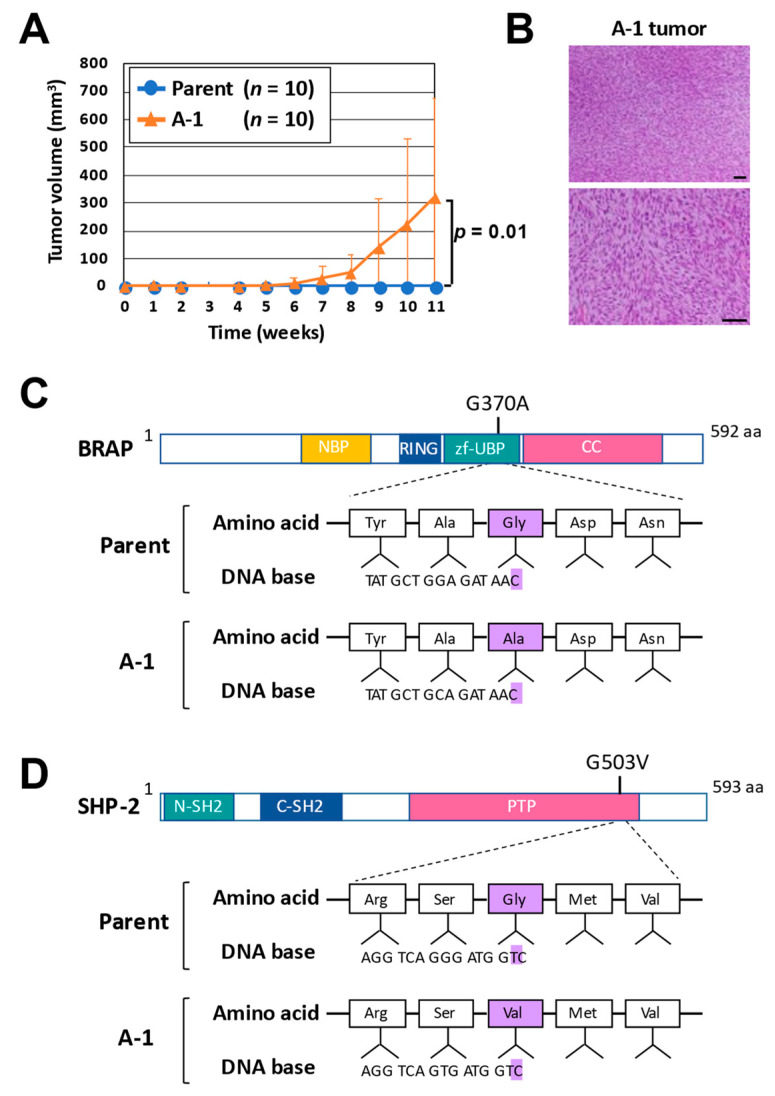
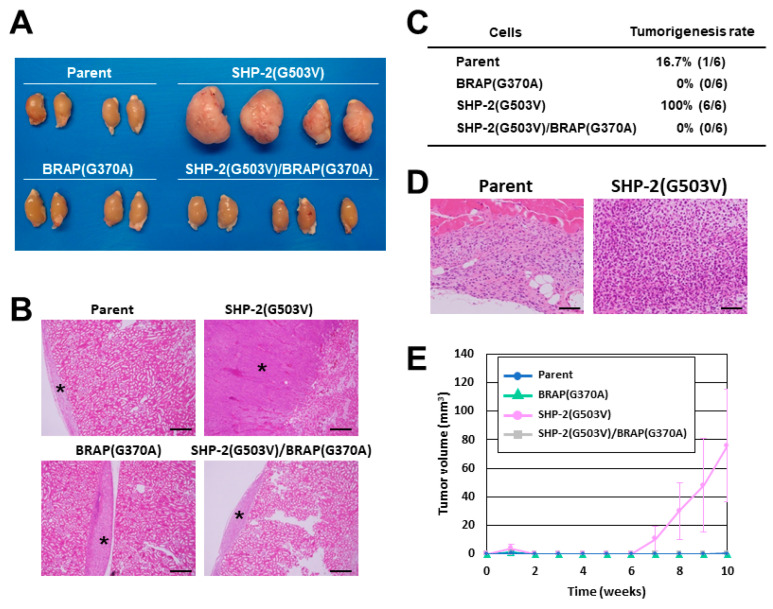
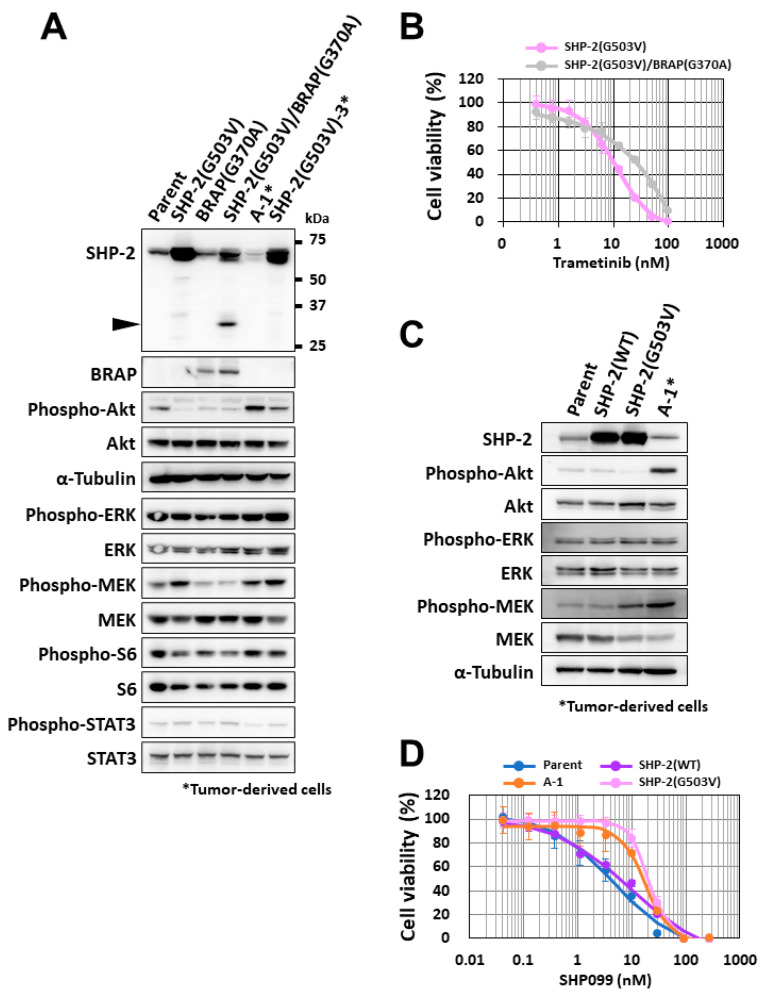
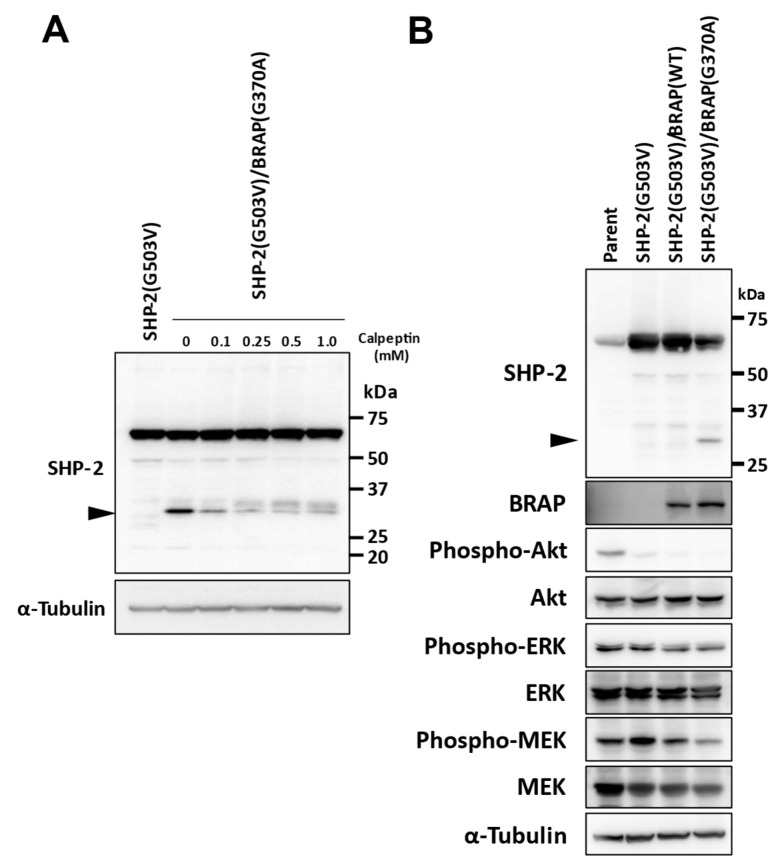
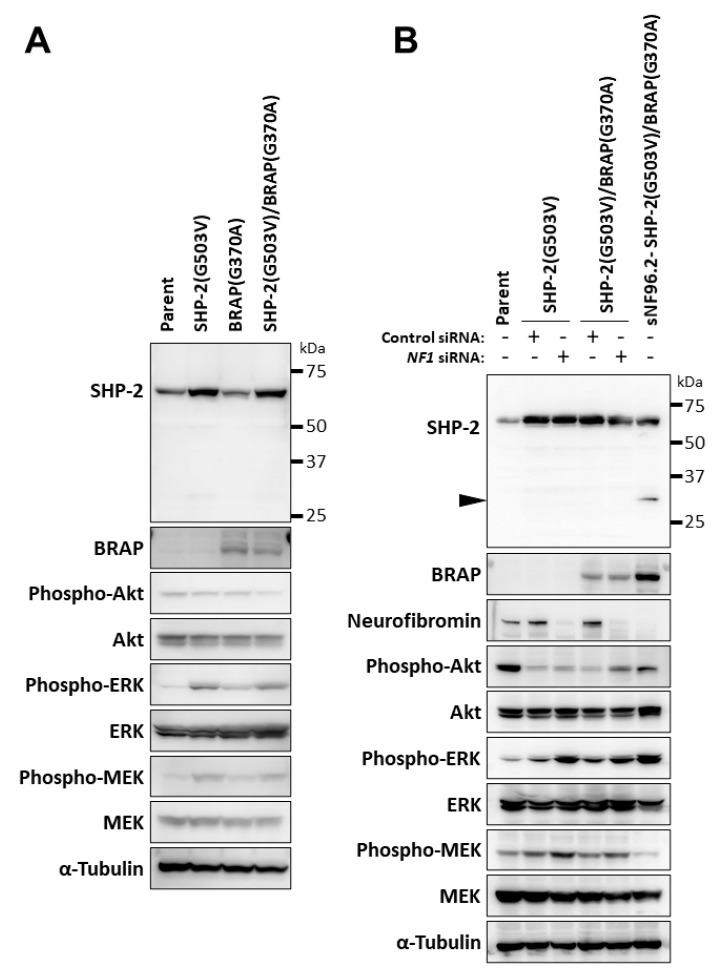
Germline mutations of NF1 cause neurofibromatosis type 1 (NF1) through the activation of the RAS signaling pathway, and some NF1 patients develop malignant peripheral nerve sheath tumors (MPNSTs). Here, we established subclones of the human NF1-MPNST cell line sNF96.2 that manifest increased tumorigenic activity and increased phosphorylation of the protein kinases MEK and Akt relative to the parental cells. Genomic DNA sequencing identified 14 additional heterozygous mutations within the coding regions of 13 cancer- and other disease-related genes in these subclones. One of these genes, PTPN11, encodes SHP-2, and the forced expression of the identified G503V mutant of SHP-2 increased both tumorigenic activity and MEK phosphorylation in parental sNF96.2 cells, suggesting that the combination of PTPN11 and NF1 mutations induces the pathological activation of the RAS pathway. These effects of SHP-2 (G503V) were inhibited by the coexpression of the G370A mutant of BRAP, which was also detected in the highly malignant subclones, and this inhibition was accompanied by the calpain-dependent cleavage of SHP-2 (G503V). The cleavage of SHP-2 (G503V) and suppression of MEK phosphorylation mediated by BRAP (G370A) were not detected in NF1-intact (HeLa) cells. Tumor promotion by SHP-2 (G503V) and its suppression by BRAP (G370A) may serve as a basis for the development of new treatment strategies for NF1.

Keywords: BRAP; MEK; PTPN11; SHP-2; neurofibromatosis type 1 (NF1).


Conflict of interest statement

The authors declare no conflict of interest.

Figures

Figure 1
Figure 1
Establishment of tumor-derived cells via sNF96.2-GFP cell injection into a nude mouse. (A) Representative hematoxylin–eosin staining (ad) and immunohistochemical staining of Ki67 (e) or S-100 (f) for a tumor formed at 154 days after kidney subcapsular injection of sNF96.2-GFP cells into a Balb/c nu/nu mouse. Scale bars, 100 µm. Invasion of tumor cells into skeletal muscle is shown in image (d). The asterisk indicates a necrotic area. (B) Comparison of cell proliferative ability in vitro between sNF96.2-GFP (parent) and A-1 cells. Trypan-blue-negative cells were counted at the indicated times. Data are means ± SD from three independent experiments, and the p values were calculated with the two-tailed unpaired Student’s t test. (C) Immunoblot analysis of phosphorylated and total forms of Akt, ERK (extracellular signal-regulated kinase), and MEK (ERK kinase) in sNF96.2-GFP (parent) and A-1 cells. α-Tubulin was examined as a loading control. The uncropped western blot figures are shown in Figure S5. (D) Representative phase-contrast microscopy (scale bars, 100 µm) and immunofluorescence staining of phospho-MEK (scale bars, 20 µm) in sNF96.2-GFP (parent) and A-1 cells. Nuclei were stained with Hoechst 33342. (E) Comparison of the effects of trametinib on cell viability after incubation of sNF96.2-GFP (parent) or A-1 cells with the MEK inhibitor for 72 h. Data are means ± SD for four replicates of a representative experiment.
Figure 2
Figure 2
Identification of genetic alterations related to NF1 tumor malignancy. (A) Tumor volume measured at the indicated times after subcutaneous injection of sNF96.2-GFP (parent) or A-1 cells (5 × 10⁶) into Balb/c nu/nu mice. Data are means ± SD (n = 10 mice), and the p value was calculated with the two-tailed unpaired Student’s t test. (B) Representative hematoxylin–eosin staining of a tumor formed at 11 weeks after subcutaneous injection of A-1 cells. Scale bars, 100 µm. (C) Domain organization of human BRAP and location of the amino acid difference between sNF96.2-GFP (parent) and A-1 cells. BRAP encodes BRCA1-associated protein (BRAP, also known as RNF52, BRAP2, and IMP), which contains a nucleotide-binding a/b plait (NBP) domain, a really interesting new gene zinc finger (RING) domain, a ubiquitin-specific protease (UBP)-like zinc finger (zf-UBP) domain, and a coiled-coil (CC) domain and functions as a RAS-responsive E3 ubiquitin ligase [21]. (D) Domain organization of human SHP-2 and location of the amino acid difference between sNF96.2-GFP (parent) and A-1 cells. PTPN11 encodes protein tyrosine phosphatase nonreceptor type 11 (SHP-2), which contains an NH2-terminal SRC homology 2 (N-SH2) domain, a COOH-terminal SRC homology 2 (C-SH2) domain, and a protein tyrosine phosphatase (PTP) domain [22].
Figure 3
Figure 3
Tumor formation by sNF96.2 cells harboring missense mutations of BRAP and PTPN11. (A) Macroscopic appearance of the kidneys of Balb/c nu/nu mice at 3 months after renal subcapsular injection of sNF96.2-GFP (Parent) or SHP-2 (G503V)-, BRAP (G370A)-, or SHP-2 (G503V)/BRAP (G370A)-expressing sNF96.2 cells (1 × 10⁶). (B) Representative hematoxylin–eosin staining of tumors in (A). Asterisks indicate tumor tissue. Scale bars, 500 µm. (C) Tumorigenic rate for the indicated cells (5 × 10⁶) at 70 days after subcutaneous injection in Balb/c nu/nu mice. (D) Representative hematoxylin–eosin staining of tumors in C. Scale bars, 100 µm. (E) Time course of tumor volume for tumors in C. Data are means ± SD (n = 6).
Figure 4
Figure 4
Role of missense mutations of BRAP and PTPN11 in tumor malignancy. (A) Immunoblot analysis of SHP-2, BRAP, and both phosphorylated and total forms of Akt, ERK, MEK, S6, and STAT3 (signal transducer and activator of transcription 3) in sNF96.2-GFP (parent) cells, A-1 cells, SHP-2 (G503V)-expressing cells, BRAP (G370A)-expressing cells, SHP-2 (G503V)/BRAP (G370A)-expressing cells, and cells derived from a kidney subcapsular tumor formed by SHP-2 (G503V)-expressing cells (SHP-2 (G503V)-3 cells). Arrowhead indicates a lower-molecular-weight protein reactive with the antibodies to SHP-2. The uncropped western blot figures are shown in Figure S5. (B) Comparison of the effects of trametinib on cell viability after incubation of SHP-2 (G503V)-expressing and SHP-2 (G503V)/BRAP (G370A)-expressing cells with the MEK inhibitor for 72 h. Data are means ± SD for four replicates of a representative experiment. (C) Immunoblot analysis of SHP-2 as well as of phosphorylated and total forms of Akt, ERK, and MEK in sNF96.2-GFP (parent) cells, A-1 cells, SHP-2(WT)-expressing cells, and SHP-2 (G503V)-expressing cells. The uncropped western blot figures are shown in Figure S5. (D) Comparison of the effects of SHP099 on cell viability after incubation of cells as in (C) with the SHP-2 inhibitor for 72 h. Data are means ± SD for four replicates of a representative experiment.
Figure 5
Figure 5
Mechanism of MEK inhibition by BRAP missense mutation. (A) Immunoblot analysis of SHP-2 in SHP-2 (G503V)-expressing sNF96.2-GFP cells as well as in SHP-2 (G503V)/BRAP (G370A)-expressing sNF96.2-GFP cells incubated in the absence or presence of calpeptin (0.1 to 1 mM) for 1 h. The uncropped western blot figures are shown in Figure S5. (B) Immunoblot analysis of SHP-2, BRAP, as well as phosphorylated and total forms of Akt, ERK, and MEK in sNF96.2-GFP (parent) cells, SHP-2 (G503V)-expressing cells, SHP-2 (G503V)/BRAP (WT)-expressing cells, and SHP-2 (G503V)/BRAP (G370A)-expressing cells. Arrowheads indicate a lower-molecular-weight protein reactive with the antibodies to SHP-2. The uncropped western blot figures are shown in Figure S5.
Figure 6
Figure 6
Relation of phenotypes induced by BRAP and PTPN11 missense mutations to NF1 inactivation. Immunoblot analysis was performed for SHP-2, BRAP, neurofibromin, as well as phosphorylated and total forms of Akt, ERK, and MEK in parental HeLa cells as well as HeLa cells transiently expressing SHP-2 (G503V) or BRAP (G370A). The uncropped western blot figures are shown in Figure S5. (A) or in the corresponding stably infected cells transfected with control or NF1 siRNAs for 48 h (B). sNF96.2-GFP cells expressing SHP-2 (G503V) and BRAP (G370A) are shown for comparison to indicate the cleavage product of SHP-2 (arrowhead). The uncropped western blot figures are shown in Figure S5.

Similar articles

Cited by

References

    1. James A.W., Shurell E., Singh A., Dry S.M., Eilber F.C. Malignant Peripheral Nerve Sheath Tumor. Surg. Oncol. Clin. N. Am. 2016;25:789–802. doi: 10.1016/j.soc.2016.05.009. - DOI - PubMed
    1. Reilly K.M., Kim A., Blakely J., Ferner R.E., Gutmann D.H., Legius E., Miettinen M.M., Randall R.L., Ratner N., Jumbé N.L., et al. Neurofibromatosis Type 1-Associated MPNST State of the Science: Outlining a Research Agenda for the Future. J. Natl. Cancer Inst. 2017;109:djx124. doi: 10.1093/jnci/djx124. - DOI - PMC - PubMed
    1. Holt G.R. Von Recklinghausen’s neurofibromatosis. Otolaryngol. Clin. N. Am. 1987;20:179–193. doi: 10.1016/S0030-6665(20)31698-4. - DOI - PubMed
    1. Viskochil D., White R., Cawthon R. The neurofibromatosis type 1 gene. Annu. Rev. Neurosci. 1993;16:183–205. doi: 10.1146/annurev.ne.16.030193.001151. - DOI - PubMed
    1. Rad E., Tee A.R. Neurofibromatosis type 1: Fundamental insights into cell signalling and cancer. Semin. Cell. Dev. Biol. 2016;52:39–46. doi: 10.1016/j.semcdb.2016.02.007. - DOI - PubMed