. 2022 May 18;10(5):1162.
doi: 10.3390/biomedicines10051162.

Targeted Inhibition of O-Linked β-N-Acetylglucosamine Transferase as a Promising Therapeutic Strategy to Restore Chemosensitivity and Attenuate Aggressive Tumor Traits in Chemoresistant Urothelial Carcinoma of the Bladder

Affiliations

Targeted Inhibition of O-Linked β-N-Acetylglucosamine Transferase as a Promising Therapeutic Strategy to Restore Chemosensitivity and Attenuate Aggressive Tumor Traits in Chemoresistant Urothelial Carcinoma of the Bladder

Hye Won Lee et al. Biomedicines. .

Abstract

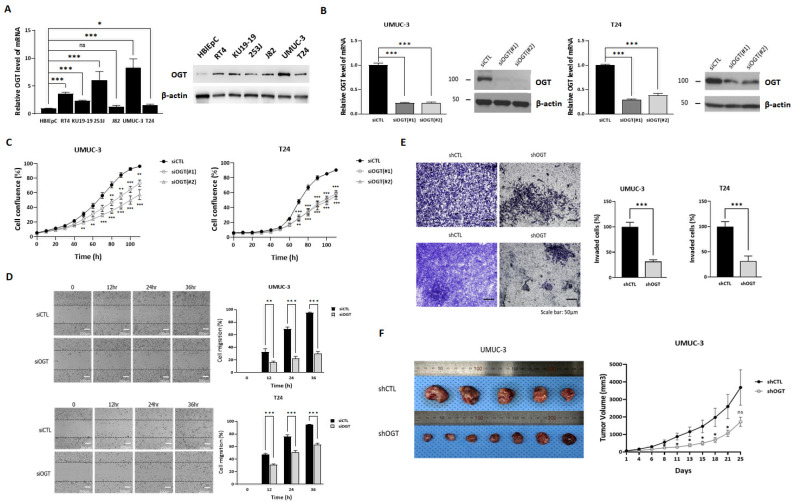
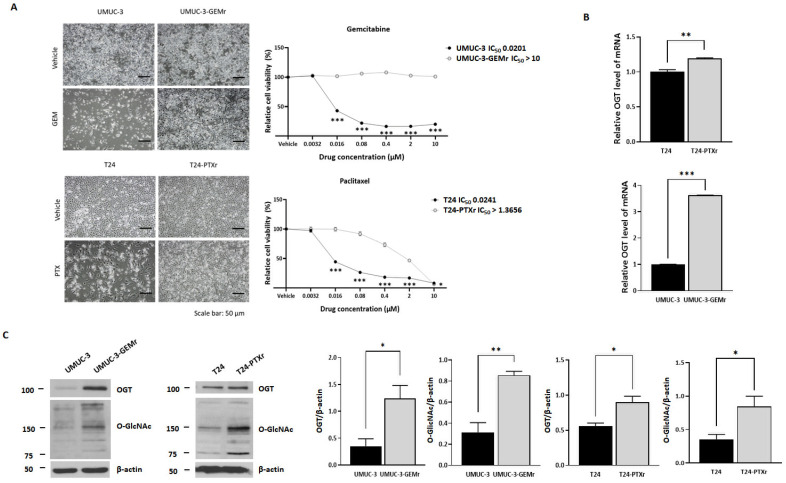
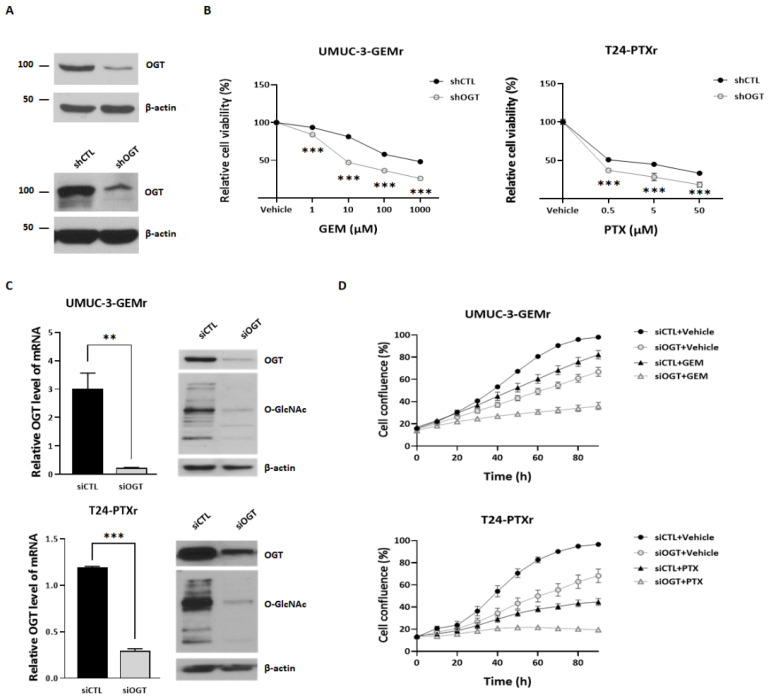
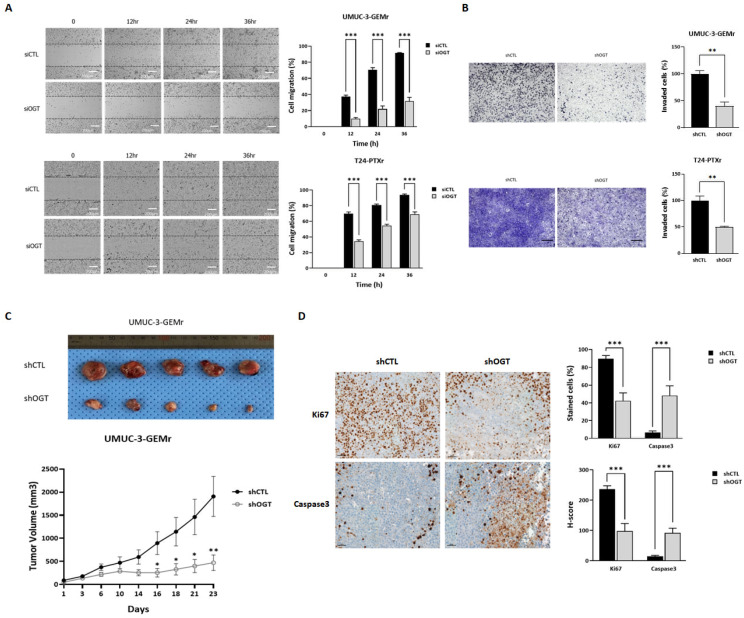
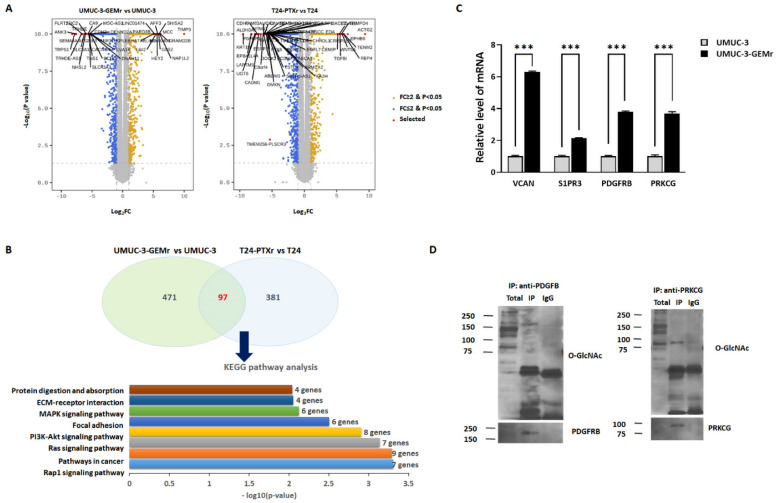
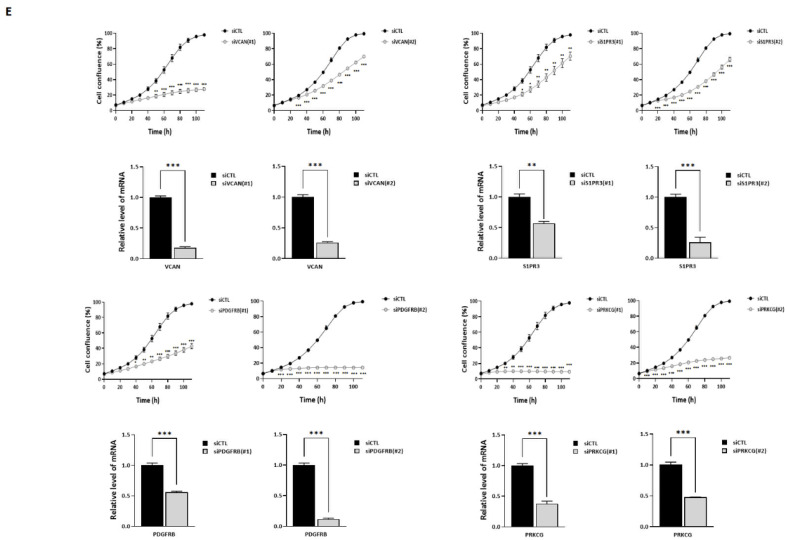
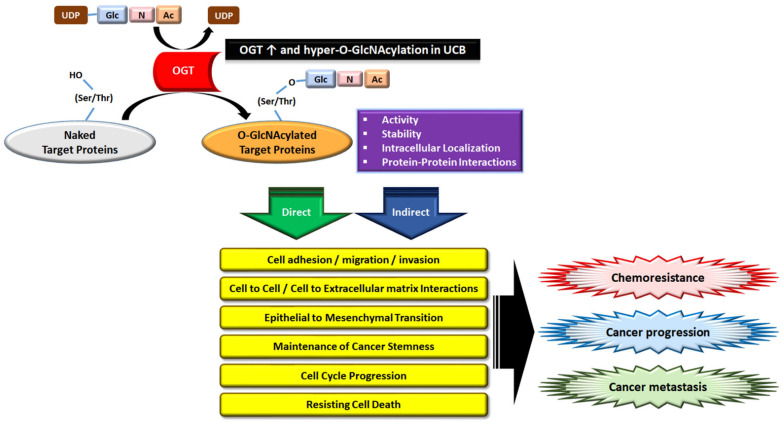
Acquisition of acquired chemoresistance during treatment cycles in urothelial carcinoma of the bladder (UCB) is the major cause of death through enhancing the risk of cancer progression and metastasis. Elevated glucose flux through the abnormal upregulation of O-linked β-N-acetylglucosamine (O-GlcNAc) transferase (OGT) controls key signaling and metabolic pathways regulating diverse cancer cell phenotypes. This study showed that OGT expression levels in two human UCB cell models with acquired resistance to gemcitabine and paclitaxel were significantly upregulated compared with those in parental cells. Reducing hyper-O-GlcNAcylation by OGT knockdown (KD) markedly facilitated chemosensitivity to the corresponding chemotherapeutics in both cells, and combination treatment with OGT-KD showed more severe growth defects in chemoresistant sublines. We subsequently verified the suppressive effects of OGT-KD monotherapy on cell migration/invasion in vitro and xenograft tumor growth in vivo in chemoresistant UCB cells. Transcriptome analysis of these cells revealed 97 upregulated genes, which were enriched in multiple oncogenic pathways. Our final choice of suspected OGT glycosylation substrate was VCAN, S1PR3, PDGFRB, and PRKCG, the knockdown of which induced cell growth defects. These findings demonstrate the vital role of dysregulated OGT activity and hyper-O-GlcNAcylation in modulating treatment failure and tumor aggression in chemoresistant UCB.

Keywords: O-linked N-acetylglucosaminylation; O-linked β-N-acetylglucosamine transferase; biomarkers; chemoresistance; gemcitabine; paclitaxel; urothelial carcinoma of bladder.


Conflict of interest statement

The authors declare no conflict of interest.

Figures

Figure 1
Figure 1
Downregulation of O-linked β-N-acetylglucosamine (O-GlcNAc) transferase (OGT) in urothelial carcinoma of the bladder (UCB) cells via gene targeting attenuated cell growth, cell migration and invasion, and tumor growth in vivo. (A) Western blot (WB) and qRT-PCR examination of OGT expression in human bladder epithelial cells and UCB cells. (B) WB and qRT-PCR examination of OGT expression in UMUC-3 and T24 UCB cells reverse transfected with control siRNA (siCTL) or siOGT. (C) UMUC-3 and T24 cells were reverse transfected with siCTL or two pairs of siOGT and incubated in the IncuCyteTM analyzer to monitor cell proliferation. Cell confluence levels were measured in real time using the IncuCyteTM analyzer and are presented as a percentage. (D) Wound healing assay of cell migration in UMUC-3 and T24 cells reverse transfected with siCTL or siOGT. Migrated cell images were acquired with Operetta CLS at 0, 12, 24, and 36 h. (E) Boyden Chamber assay analysis of the in vitro invasion capability of UMUC-3 and T24 cells stably expressing shCTL or shOGT. Cells were incubated for 48 h. (F) Tumor volume over time in nude mice injected subcutaneously with 5 × 10⁶ shCTL or shOGT UMUC-3 cells. Tumors were measured when average tumor size reached 40 mm3. After 4 weeks, the tumors were removed for morphological and histological examination. Representative images of tumors from shCTL (top) and shOGT cells (bottom) are shown. In panels (AE), the data represent at least three independent experiments and error bars indicate mean ± SEM. * p < 0.05; ** p < 0.01; *** p < 0.001.
Figure 2
Figure 2
OGT expression and activity was upregulated in UCB cell models with acquired chemoresistance to gemcitabine (GEM) and paclitaxel (PTX). (A) Cell morphology of resistant and nonresistant cells observed under a light microscope (magnification, ×10). UMUC-3 and UMUC-3-GEM-resistant (GEMr) cells were treated with a vehicle or 10 μM GEM. T24 and T24-PTX-resistant (PTXr) cells were treated with a vehicle or 1 μM PTX. Observations were made 72 h after treatment. After observation, cell viability was analyzed by MTT assay. The data represent at least three independent experiments and error bars indicate the mean ± SEM. (B) qRT-PCR was used to detect OGT and GAPDH expression in UMUC-3/UMUC-3-GEMr and T24/T24-PTXr cells. Error bars indicate the mean ± SEM for three independent regions each. (C) Immunoblots of lysates derived from UMUC-3, UMUC-3-GEMr, T24, and T24-PTXr cells against OGT and O-GlcNAc. β-actin was used as the loading control. Error bars indicate the mean ± SEM for three independent regions each. For all panels * p < 0.05; ** p < 0.01; *** p < 0.001.
Figure 3
Figure 3
Knockdown of OGT restored sensitivity to chemotherapy drugs in UCB cells with acquired chemoresistance. (A) WB examination of OGT expression in UMUC-3-GEMr and T24-PTXr cells stably expressing shCTL or shOGT after incubation for 48 h. The data represent at least three independent experiments. (B) Cell viability analysis by MTT assay. UMUC-3-GEMr and T24-PTXr cells stably expressing shCTL or shOGT were treated with a vehicle or the corresponding drugs for 72 h. The data represent at least three independent experiments and error bars indicate the mean ± SEM. *** p < 0.001. (C) Immunoblot and qRT-PCR detection of OGT knockdown in UMUC-3-GEMr and T24-PTXr cells reverse transfected with siCTL or siOGT. UMUC-3-GEMr and T24-PTXr cell lysates were immunoblotted against OGT and O-GlcNAc. β-actin was used as the loading control. qRT-PCR was used to detect OGT and GAPDH expression in UMUC-3-GEMr and T24-PTXr cells. Error bars indicate the mean ± SEM for three independent regions each. ** p  <  0.01; *** p < 0.001. (D) UMUC-3-GEMr and T24-PTXr cells were reverse transfected with siCTL or siOGT. After 24 h, UMUC-3-GEMr cells were treated with a vehicle or 7 μM GEM and T24-PTXr cells were treated with a vehicle or 200 nM PTX. Cells were incubated in the IncuCyteTM analyzer to monitor cell proliferation. Cell confluence levels were measured by the IncuCyteTM analyzer in real time and are presented as a percentage. The data represent at least three independent experiments and error bars indicate the mean ± SEM.
Figure 4
Figure 4
Downregulation of OGT via gene targeting in chemoresistant UCB cells suppressed cell migration, invasion, and subcutaneous xenograft tumor growth via the inhibition of cell proliferation and the induction of cell apoptosis. (A) UMUC-3-GEMr and T24-PTXr cells were reverse transfected with either siCTL or siOGT and cell migration was examined using a wound healing assay. Images of the migrated cells were acquired with Operetta CLS at 0, 12, 24, and 36 h. The data represent at least three independent experiments and error bars indicate the mean ± SEM. Scale bar, 200 μm. (B) The in vitro invasion capability of UMUC-3-GEMr and T24-PTXr cells was analyzed using the Boyden Chamber assay. UMUC-3-GEMr and T24-PTXr cells stably expressing shCTL or shOGT were incubated for 48 h. The data represent at least three independent experiments and error bars indicate the mean ± SEM. Scale bar, 50 μm. (C) Representative images of tumors from shCTL (top) and shOGT cells (bottom). The mice were injected subcutaneously with UMUC-3-GEMr cells stably expressing shCTL or shOGT (5 × 10⁶/mouse). Tumor size was measured at the indicated time points and, after 4 weeks, the tumors were removed for morphological and histological examination. (D) Representative images of immunohistochemistry from tumor tissues and quantified H-scores of Ki-67 and Caspase 3 from tumor tissues. Tumors derived from shCTL or shOGT UMUC3-GEMr cells were dissected 6 weeks after cell inoculation and embedded in paraffin, and tumor sections were stained with antibodies against Ki-67 or Caspase 3. Error bars indicate the mean ± SEM for three independent regions each. Scale bars, 100 μm. For all panels * p < 0.05; ** p  <  0.01; *** p < 0.001.
Figure 5
Figure 5
Preliminary investigation of the mechanisms of chemoresistance in UCB cells using comparative gene expression analysis. (A) Volcano plot of significantly differentially expressed (SDE) genes in UMUC-3-GEMr and T24-PTXr cells compared to their parental cells. Yellow and blue dots indicate significantly up- and downregulated genes in chemoresistant cells, respectively. In UMUC-3-GEMr cells, 568 genes were upregulated, and 675 genes were downregulated; in T24-PTXr cells, 478 genes were upregulated, and 711 genes were downregulated. FC: fold change. (B) Common upregulated gene sets shared by two sets of UMUC-3-GEMr and T24-PTXr cells. Kyoto Encyclopedia of Genes and Genomes (KEGG) pathway enrichment analysis was run based on consistent SDE genes from the upregulated genes in UMUC-3-GEMr or T24-PTXr cells. (C) RT-qPCR detected VCAN, S1PR3, PDGFRB, and PRKCG expression in UMUC-3 and UMUC-3-GEMr cells. Error bars indicate the mean ± SEM for three independent regions each. *** p < 0.001. (D) Detection of O-GlcNAc modifications of endogenous PDGFRB and PRKCG in UMUC-3-GEMr cells. Cells were treated with 2 μM Thiamet G for 6 h before lysis. Lysates were immunoprecipitated with either anti-PDGFRB antibody or anti-PRKCG antibody, then immunoblotted against PDGFRB or PRKCG, and O-GlcNAc. (E) UMUC-3-GEMr cells were reverse transfected with either siCTL or two independent sets of siVCAN, S1PR3, PDGFRB, and PRKCG and incubated in the IncuCyteTM analyzer to monitor cell proliferation. Cell confluence levels were measured using the IncuCyteTM analyzer in real time and are presented as a percentage. The data represent at least three independent experiments and error bars indicate the mean ± SEM. * p  <  0.05; ** p  <  0.01; *** p  <  0.001.
Figure 5
Figure 5
Preliminary investigation of the mechanisms of chemoresistance in UCB cells using comparative gene expression analysis. (A) Volcano plot of significantly differentially expressed (SDE) genes in UMUC-3-GEMr and T24-PTXr cells compared to their parental cells. Yellow and blue dots indicate significantly up- and downregulated genes in chemoresistant cells, respectively. In UMUC-3-GEMr cells, 568 genes were upregulated, and 675 genes were downregulated; in T24-PTXr cells, 478 genes were upregulated, and 711 genes were downregulated. FC: fold change. (B) Common upregulated gene sets shared by two sets of UMUC-3-GEMr and T24-PTXr cells. Kyoto Encyclopedia of Genes and Genomes (KEGG) pathway enrichment analysis was run based on consistent SDE genes from the upregulated genes in UMUC-3-GEMr or T24-PTXr cells. (C) RT-qPCR detected VCAN, S1PR3, PDGFRB, and PRKCG expression in UMUC-3 and UMUC-3-GEMr cells. Error bars indicate the mean ± SEM for three independent regions each. *** p < 0.001. (D) Detection of O-GlcNAc modifications of endogenous PDGFRB and PRKCG in UMUC-3-GEMr cells. Cells were treated with 2 μM Thiamet G for 6 h before lysis. Lysates were immunoprecipitated with either anti-PDGFRB antibody or anti-PRKCG antibody, then immunoblotted against PDGFRB or PRKCG, and O-GlcNAc. (E) UMUC-3-GEMr cells were reverse transfected with either siCTL or two independent sets of siVCAN, S1PR3, PDGFRB, and PRKCG and incubated in the IncuCyteTM analyzer to monitor cell proliferation. Cell confluence levels were measured using the IncuCyteTM analyzer in real time and are presented as a percentage. The data represent at least three independent experiments and error bars indicate the mean ± SEM. * p  <  0.05; ** p  <  0.01; *** p  <  0.001.
Figure 6
Figure 6
Graphical representation of potential models of enhanced chemoresistance and tumor aggressiveness mediated by upregulated OGT activity and hyper-O-GlcNAcylation in UCB. Glc, glucose; UDP-GlcNAc, uridine diphosphate N-acetylglucosamine. O-GlcNAcylation is a dynamic post-translational modification occurring on serine (Ser) and threonine (Thr) residues of nuclear and cytoplasmic target proteins.

Similar articles

Cited by

References

    1. Wang T.W., Yuan H., Diao W.L., Yang R., Zhao X.Z., Guo H.Q. Comparison of gemcitabine and anthracycline antibiotics in prevention of superficial bladder cancer recurrence. BMC Urol. 2019;19:90. doi: 10.1186/s12894-019-0530-0. - DOI - PMC - PubMed
    1. Li R., Li Y., Song J., Gao K., Chen K., Yang X., Ding Y., Ma X., Wang Y., Li W., et al. Intravesical gemcitabine versus mitomycin for non-muscle invasive bladder cancer: A systematic review and meta-analysis of randomized controlled trial. BMC Urol. 2020;20:97. doi: 10.1186/s12894-020-00610-9. - DOI - PMC - PubMed
    1. Lu J.L., Xia Q.D., Lu Y.H., Liu Z., Zhou P., Hu H.L., Wang S.G. Efficacy of intravesical therapies on the prevention of recurrence and progression of non-muscle-invasive bladder cancer: A systematic review and network meta-analysis. Cancer Med. 2020;9:7800–7809. doi: 10.1002/cam4.3513. - DOI - PMC - PubMed
    1. Hurle R., Contieri R., Casale P., Morenghi E., Saita A., Buffi N., Lughezzani G., Colombo P., Frego N., Fasulo V., et al. Midterm follow-up (3 years) confirms and extends short-term results of intravesical gemcitabine as bladder-preserving treatment for non-muscle-invasive bladder cancer after BCG failure. Urol. Oncol. 2021;39:195.e7–195.e113. doi: 10.1016/j.urolonc.2020.09.017. - DOI - PubMed
    1. Nawara H.M., Afify S.M., Hassan G., Zahra M.H., Seno A., Seno M. Paclitaxel-Based Chemotherapy Targeting Cancer Stem Cells from Mono- to Combination Therapy. Biomedicines. 2021;9:500. doi: 10.3390/biomedicines9050500. - DOI - PMC - PubMed

LinkOut - more resources