

Antidepressants Fluoxetine Mediates Endoplasmic Reticulum Stress and Autophagy of Non-Small Cell Lung Cancer Cells Through the ATF4-AKT-mTOR Signaling Pathway
- PMID: 35620287
- PMCID: PMC9127500
- DOI: 10.3389/fphar.2022.904701
Antidepressants Fluoxetine Mediates Endoplasmic Reticulum Stress and Autophagy of Non-Small Cell Lung Cancer Cells Through the ATF4-AKT-mTOR Signaling Pathway
Abstract
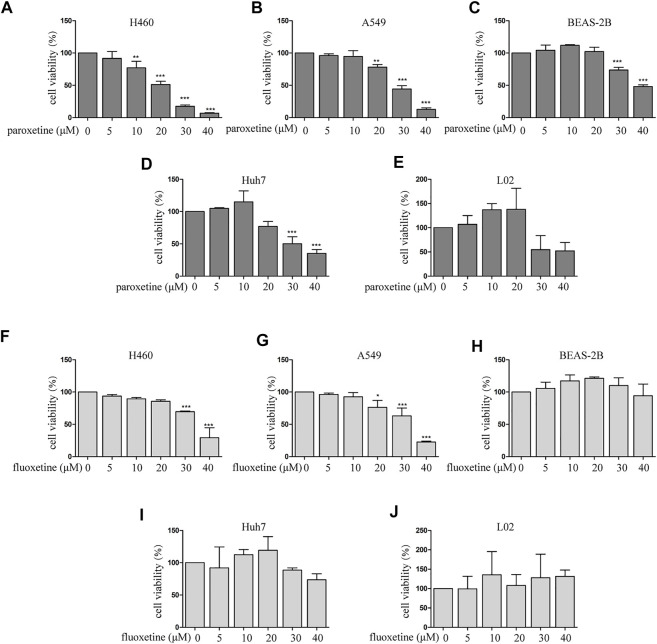
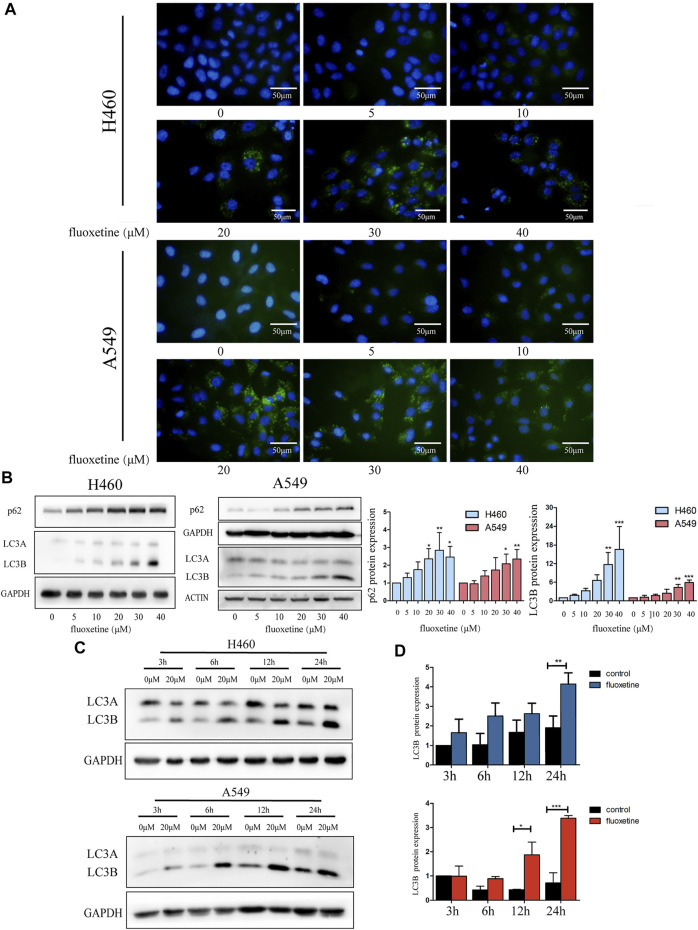
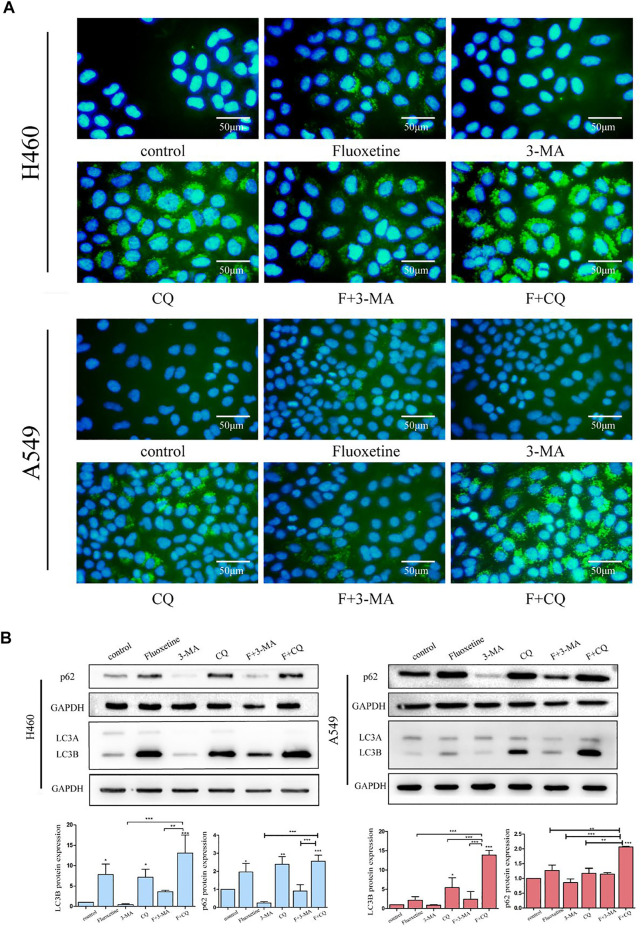
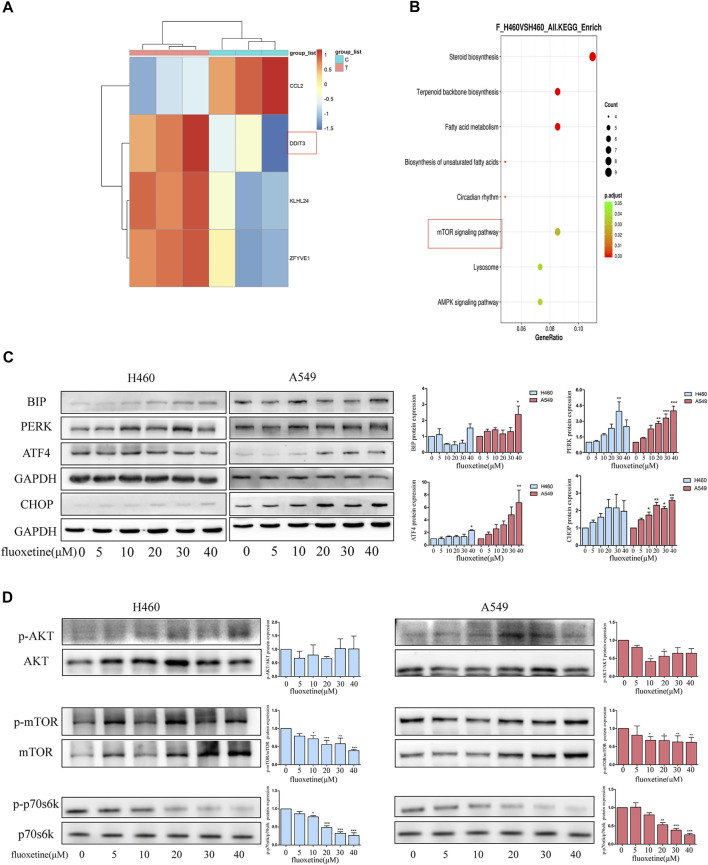
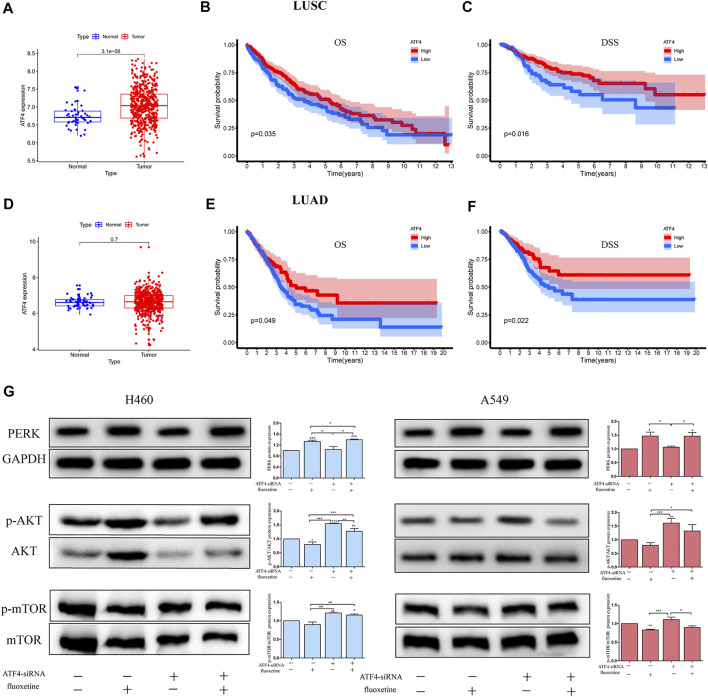
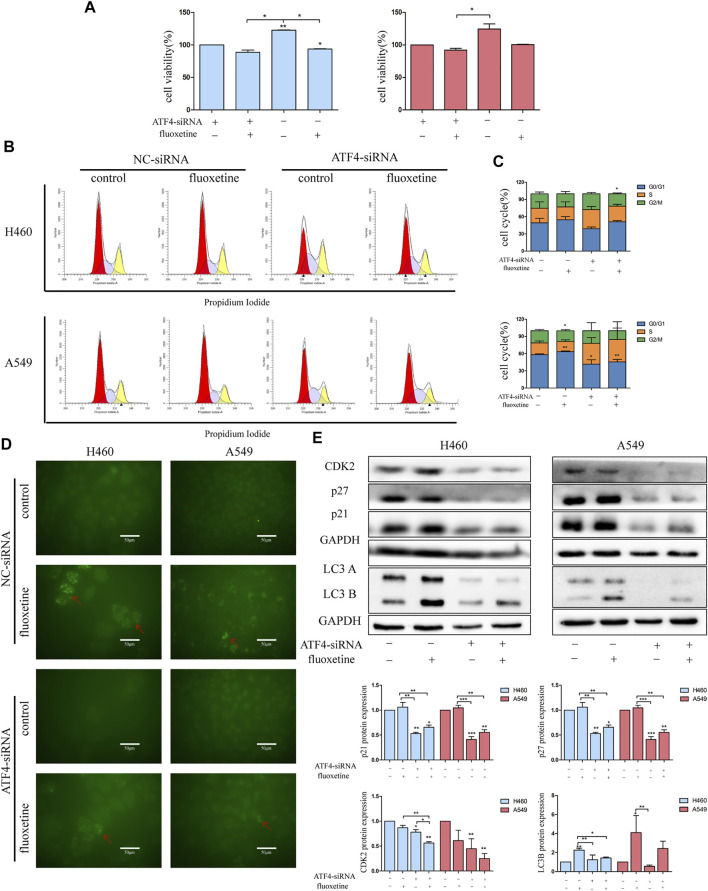
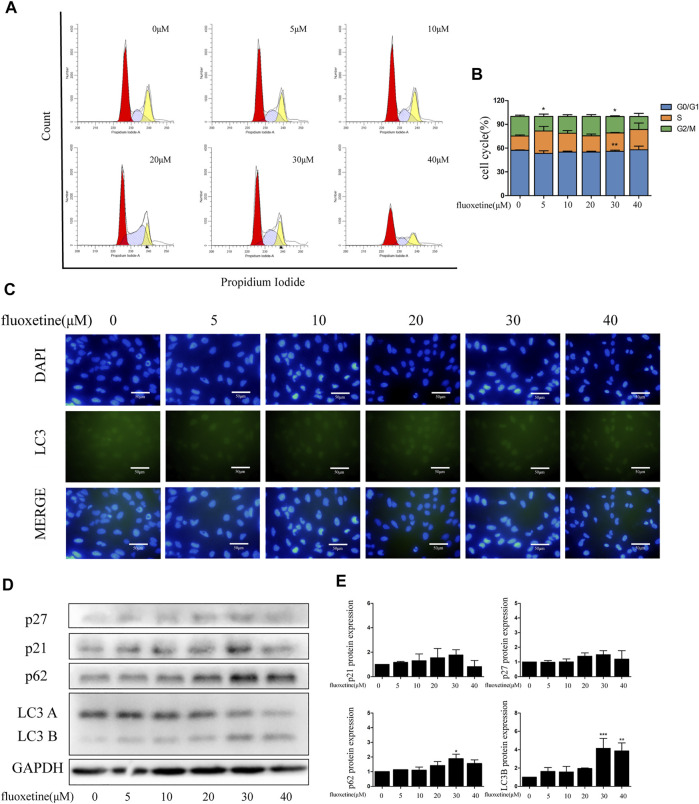
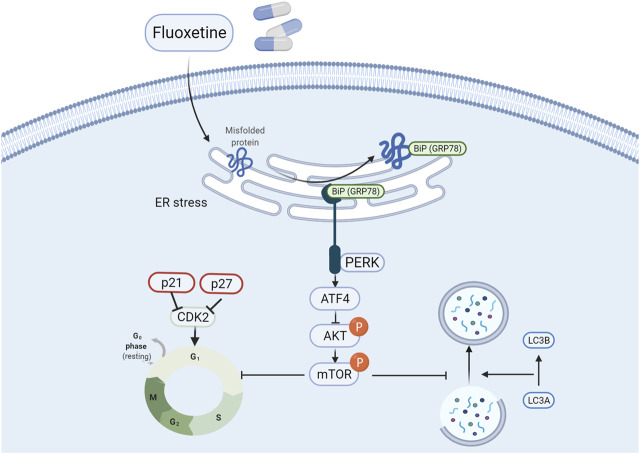
Fluoxetine, one of the latest clinical antidepressants, is reported to have the anti-proliferative effect on cancer cells via immune-related pathways. However, the mechanism is still not known. This study mainly focused on the discovery of the molecular basis of the inhibitory effect of fluoxetine in lung cancer. The specific anti-proliferation effect and autophagy induced by fluoxetine on lung cancer cell were shown in CCK8 and immunofluorescence. The RNA sequence hinted that the endoplasmic reticulum (ER) stress-related protein and mTOR pathway were enriched after fluoxetine treatment. Western blot results revealed that the ER stress pathway was activated by fluoxetine, including PERK, ATF4, and CHOP, while the AKT/mTOR pathway was inhibited. In addition, the transfection of ATF4 siRNA further discovered that ER stress participated in the inhibition of AKT/mTOR pathway and the induction of anti-proliferation and autophagy in the fluoxetine-treated cells. More importantly, fluoxetine was demonstrated to play cytotoxic activity in cancer cells without affecting normal cells. Our results showed that fluoxetine triggered the ATF4-AKT-mTOR signaling pathway to induce cell cycle arrest and autophagy restraining cancer cells' growth in lung cancer. This study found fluoxetine unaffected the proliferation of normal lung epithelial cells, providing safe clinical therapeutic strategies for lung cancer patients with depression.
Keywords: ATF4-AKT-mTOR signaling pathway; autophagy; endoplasmic reticulum stress; fluoxetine; non-small cell lung cancer.
Copyright © 2022 Shao, Zhuang, Zhang and Qiao.
Conflict of interest statement
The authors declare that the research was conducted in the absence of any commercial or financial relationships that could be construed as a potential conflict of interest.
Figures

Similar articles
-
Inhibition of ATF4-mediated elevation of both autophagy and AKT/mTOR was involved in antitumorigenic activity of curcumin.Food Chem Toxicol. 2023 Mar;173:113609. doi: 10.1016/j.fct.2023.113609. Epub 2023 Jan 12. Food Chem Toxicol. 2023. PMID: 36640941
-
Nelfinavir and bortezomib inhibit mTOR activity via ATF4-mediated sestrin-2 regulation.Mol Oncol. 2013 Dec;7(6):1012-8. doi: 10.1016/j.molonc.2013.07.010. Epub 2013 Jul 20. Mol Oncol. 2013. PMID: 23916134 Free PMC article.
-
Ampelopsin-induced autophagy protects breast cancer cells from apoptosis through Akt-mTOR pathway via endoplasmic reticulum stress.Cancer Sci. 2014 Oct;105(10):1279-87. doi: 10.1111/cas.12494. Epub 2014 Sep 18. Cancer Sci. 2014. PMID: 25088800 Free PMC article.
-
Activation of endoplasmic reticulum stress promotes autophagy and apoptosis and reverses chemoresistance of human small cell lung cancer cells by inhibiting the PI3K/AKT/mTOR signaling pathway.Oncotarget. 2016 Nov 22;7(47):76827-76839. doi: 10.18632/oncotarget.12718. Oncotarget. 2016. Retraction in: Oncotarget. 2019 Jun 25;10(41):4252. doi: 10.18632/oncotarget.27064. PMID: 27765907 Free PMC article. Retracted.
-
Inhibition of autophagy enhances heat-induced apoptosis in human non-small cell lung cancer cells through ER stress pathways.Arch Biochem Biophys. 2016 Oct 1;607:55-66. doi: 10.1016/j.abb.2016.08.016. Epub 2016 Aug 24. Arch Biochem Biophys. 2016. PMID: 27565443 Review.
Cited by
-
High-throughput drug screening identifies fluoxetine as a potential therapeutic agent for neuroendocrine prostate cancer.Front Oncol. 2023 Mar 13;13:1085569. doi: 10.3389/fonc.2023.1085569. eCollection 2023. Front Oncol. 2023. PMID: 36994207 Free PMC article.
-
Antidepressants as Autophagy Modulators for Cancer Therapy.Molecules. 2023 Nov 14;28(22):7594. doi: 10.3390/molecules28227594. Molecules. 2023. PMID: 38005316 Free PMC article. Review.
-
Chemical Structures and Pharmacological Properties of Typical Bioflavonoids in Polygonati Rhizoma (PGR).J Environ Public Health. 2022 Sep 20;2022:4649614. doi: 10.1155/2022/4649614. eCollection 2022. J Environ Public Health. 2022. Retraction in: J Environ Public Health. 2023 Aug 2;2023:9768436. doi: 10.1155/2023/9768436. PMID: 36570783 Free PMC article. Retracted. Review.
-
Immune Checkpoint Inhibitors and Their Impact on Thoughts, Feelings, and Behavior: Cognitive and Psychiatric Manifestations of Immune Checkpoint Therapy.Indian J Psychol Med. 2024 Aug 18:02537176241263308. doi: 10.1177/02537176241263308. Online ahead of print. Indian J Psychol Med. 2024. PMID: 39564310 Free PMC article. No abstract available.
-
Serotonin signalling in cancer: Emerging mechanisms and therapeutic opportunities.Clin Transl Med. 2024 Jul;14(7):e1750. doi: 10.1002/ctm2.1750. Clin Transl Med. 2024. PMID: 38943041 Free PMC article. Review.
References
-
- Amin N., Xie S., Tan X., Chen Y., Ren Q., Botchway B. O. A., et al. (2020). Optimized Integration of Fluoxetine and 7, 8-dihydroxyflavone as an Efficient Therapy for Reversing Depressive-like Behavior in Mice during the Perimenopausal Period. Prog. Neuropsychopharmacol. Biol. Psychiatry 101, 109939. 10.1016/j.pnpbp.2020.109939 - DOI - PubMed
LinkOut - more resources
Full Text Sources
Molecular Biology Databases
Research Materials
Miscellaneous