. 2022 May 26:11:e76308.
doi: 10.7554/eLife.76308.

Deciphering a hexameric protein complex with Angstrom optical resolution

Affiliations

Deciphering a hexameric protein complex with Angstrom optical resolution

Hisham Mazal et al. Elife. .

Abstract

Cryogenic optical localization in three dimensions (COLD) was recently shown to resolve up to four binding sites on a single protein. However, because COLD relies on intensity fluctuations that result from the blinking behavior of fluorophores, it is limited to cases where individual emitters show different brightness. This significantly lowers the measurement yield. To extend the number of resolved sites as well as the measurement yield, we employ partial labeling and combine it with polarization encoding in order to identify single fluorophores during their stochastic blinking. We then use a particle classification scheme to identify and resolve heterogenous subsets and combine them to reconstruct the three-dimensional arrangement of large molecular complexes. We showcase this method (polarCOLD) by resolving the trimer arrangement of proliferating cell nuclear antigen (PCNA) and six different sites of the hexamer protein Caseinolytic Peptidase B (ClpB) of Thermus thermophilus in its quaternary structure, both with Angstrom resolution. The combination of polarCOLD and single-particle cryogenic electron microscopy (cryoEM) promises to provide crucial insight into intrinsic heterogeneities of biomolecular structures. Furthermore, our approach is fully compatible with fluorescent protein labeling and can, thus, be used in a wide range of studies in cell and membrane biology.

Keywords: assembly; correlative imaging; cryogenic super-resolution; fluorescence; molecular biophysics; none; protein structure; structural biology.


Conflict of interest statement

HM, FW, VS No competing interests declared

Figures
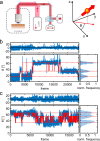
Figure 1.
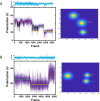
Figure 1.. Photo-physics and co-localization of fluorophores at cryogenic temperatures.
(a) Schematics of the cryogenic optical microscope. Polarization-resolved detection allows for direct measurement of the in-plane dipole moment of fluorophores. Here we use circularly polarized light from a laser at λ=635 nm. A polarizing beam splitter in the detection path allows one to resolve the polarization state of each individual molecule. (b, c) Exemplary polarization time traces of two single proteins. (b) demonstrates a case of well-separated polarization states, whereas (c) displays a case with smaller separations between polarization states. Blue traces present the experimental polarization values for each frame, and the red lines show the polarization determined by the algorithm (White et al., 2020). Top panels shows the residuals of the fit. The blinking kinetics are exceptionally slow with on/off times in the range of seconds to minutes.
Figure 1—figure supplement 1.
Figure 1—figure supplement 1.. Characterization and labeling of human PCNA protein.
(a) Schematics of the human PCNA crystal structure (PDB: 1AXC). Each monomer is presented in a different color (green, red and purple). The location of the N-terminal His-tag is shown in yellow. Native gel electrophoresis (4–15% Mini-PROTEAN TGX Precast Protein Gels) ran in 25 mM Tris and 192 mM glycine, pH 8, at 60 V for 3 hr. The gel was imaged with a ChemiDoc XRS system at 647 nm (b) and was then stained with Coomassie Blue (c). Lane 1 is the protein ladder PM2500 (SMOBIO), lane 2 is thyroglobulin from bovine serum labeled with ATTO647N-NHS, lane 3 is Bovine serum albumin protein (BSA) labeled with ATTO647N-NHS, lane 4 is the non-labeled human PCNA, lane 5 is human PCNA labeled with ATTO647N-NTA. Lanes 4 and 5 of human PCNA in the gel show only one band indicating a homogenous and pure solution of the assembled proteins. Also, this result shows that the labeled human PCNA ran similar to the non-labeled one, indicating that the dye did not affect the protein.
Figure 1—figure supplement 2.
Figure 1—figure supplement 2.. Photo-physics characterization of NTA-ATTO647N attached to human PCNA protein imaged at 4K.
(a) Fluorophore stability histogram shows the fraction of molecules which survived until a given time of data acquisition. Most molecules survived until the end of the measurement, allowing improved photon collection and higher localization precision. (b) Histogram of the mean number of photons per frame. On average we obtain ~260 photons per frame (per 14 ms). (c) Photon budget histogram plotted as a fraction of molecules versus total number of photons collected from 50,000 frames. Around 17% of the molecules emitted at least 107 photons. However, this number is mostly limited by the shorter recording time in these measurements and can be increased further if necessary. (d) The photo-switching behavior of the fluorophores is characterized by the dwell times in the off- and on-state. The ratio of their average duration indicates long-lived off-state facilitate localizing single emitters via polarization-trace fitting. Error bars in a and c represent standard errors of the mean.
Figure 1—figure supplement 3.
Figure 1—figure supplement 3.. Example of complete intensity and polarization trace processing for fluorophore localization.
(a) Raw total photon counts registered from the two channels (black line). Yellow highlights show the regions which were determined as on events and taken for further analysis. The inset shows the photon signal in each channel separately shown in blue and red. (b) Intensity time trace of the on events highlighted in (a). The blue and red lines represent the intensity of the two polarization channels, and the black line is the total signal. For clarity, the blue line was shifted 200 counts on the y-axis. (c) Polarization trace (purple color) of the signal calculated from (b). (d) The signal trace after filtering based on photon counts per frame (frames below 100 photons were excluded) with the yellow histogram on the side showing the photon distribution over the whole measurement. The color code is the same as in (b). For clarity, the blue line was shifted 200 counts on the y-axis. (e) The polarization trace (purple color) as calculated from intensity signal shown in (d) and used for fluorophore assignment and further analysis. The green histogram on the side shows the polarization distribution. The Orange solid line is the fit of the polarization trace as calculated using DISC algorithm, which combines unsupervised statistical learning tools with change-point detection in a model-independent manner (White et al., 2020). The fit clearly show three separate polarization states, which indicate the fluorophores attached to this molecule. Next, we take the assignment of the polarization trace to assign and localize the coordinate of each fluorophore separately.
Figure 1—figure supplement 4.
Figure 1—figure supplement 4.. Validation of polarization assignment.
(a) Example of 2D maps of the fluorophore localization as obtained for each fluorophore based on fitting the polarization trace, as described in Figure 1—figure supplement 3. (b) In order to validate the assignment of the detected photons originating from a diffraction-limited spot to a specific fluorophore, we performed random assignment of frames. After averaging these randomly assigned localizations, the super-resolved image shows single spots in the center. In comparison, the polarization time trace fit accurately resolves the three positions in (a).
Figure 1—figure supplement 5.
Figure 1—figure supplement 5.. Polarization histogram of single fluorophore ATTO647N imaged at 4 K.
The histogram shows a single peak with a width of 5 degrees, which matches the expected shot noise value estimated from 100 photons.
Figure 1—figure supplement 6.
Figure 1—figure supplement 6.. Fluorophore identification using polarization-resolved imaging.
The fraction of particles for which all fluorophores can be identified by the analysis of their polarization time-trace is shown as a function of the angular resolution of the fit. In order to resolve 50% of a hexamer sample with 6 fluorophores, an angular resolution of 2° is required. However, to resolve a partially labeled hexamer with 3 fluorophores only requires a resolution of 10°. For this simulation, we assumed random dipole angles and accounted for the mapping into the [0°, 90°] interval (see Materials and methods section).
Figure 2.
Figure 2.. 3D reconstruction of the PCNA protein trimer.
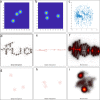
(a) Experimentally obtained super-resolved 2D images (top row) of single proteins and simulated images based on the crystal structure (bottom row). The color code represents the occupation probability determined by the localization precision for each fluorophore. The localization precision in the simulated data was normalized. Scale bar is 3 nm. (b) Overlay of the crystal structure of human PCNA with the reconstructed fluorophore volumes shown as red spheroids (see online Animation 1). The transparent white clouds represent the accessible volume of the dye linker attached to the N-terminal side of the protein, calculated using the parameter of ATTO647N as provided in Kalinin et al., 2012. By fitting the reconstructed 3D volumes obtained from polarCOLD into the theoretical accessible volumes of the dyes, we find a correlation score of 0.96, indicating a correct 3D reconstruction. (c) The Fourier shell correlation (FSC, blue curve) of the two half data sets gives a resolution of 4.9 Å based on the half-bit criterion (red curve). (d) Distribution of the projected side lengths (blue) obtained from the localized positions shown in (b). The model fit (red) takes the finite localization uncertainty and the random particle orientation into account, resulting in 9.9±0.6 nm. The error of the model fit was estimated from 200 fits. The reconstructed 3D volume was calculated from 119 particles.
Figure 2—figure supplement 1.
Figure 2—figure supplement 1.. From polarization trajectories to 2D images.
(A–B) Two different trajectories with three assigned polarizations. Each polarization state was colored differently and shown as red, green, and yellow line, respectively. The localization precision (nm) of each fluorophore is indicated on the 2D super-resolved image accordingly.
Figure 2—figure supplement 2.
Figure 2—figure supplement 2.. Length of the segment and localization precision.
Plot of the localization precision as a function of the segment length, plotted as a log-log plot. The figure shows the increase in localization precision with the length of the segment.
Figure 2—figure supplement 3.
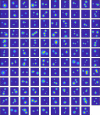
Figure 2—figure supplement 3.. Complete data set of the PCNA protein trimer used for 3D reconstruction.
All 2D maps as obtained from polarization trace fitting with a three-state model. Particles were filtered based on localization precision below 3 nm. The image size is 120 × 120 pixel at 0.15 nm/pixel.
Figure 3.
Figure 3.. 3D reconstruction of the ClpB hexamer protein.
(a) Top view of super-resolved 2D images for classes I, II, and III, as obtained from single-particle classification procedure. Scale bar is 3 nm. (b) Result of single-particle classification and averaging. The reconstructed 3D volume of each class nicely sits in the simulated accessible volume of the fluorophores (grey spheres). Red, blue and yellow spheres represent classes I, II, and III with correlation values of 0.98, 0.96, and 0.86, respectively. (c) 3D reconstruction of the complete hexamer obtained from merging the 3D volumes (red spheroid) of the three classes. Top figure shows the top view of the reconstructed 3D volume of the hexamer shape, and the bottom figure shows its 90° rotation (see online Animation 2 and 3Animation 2 and 3). Crystal structure of ClpB is shown as a cartoon in gold (PDB: 1QVR) (Lee et al., 2003; Diemand and Lupas, 2006). Reconstructed 3D volumes were calculated from 232, 100, and 135 particles for classes 1, 2, and 3, respectively.
Figure 3—figure supplement 1.
Figure 3—figure supplement 1.. ClpB labeling and photo-physics.
(a) We modeled the dye positions using the method described previously in Figure 2b. In particular, we calculated the accessible volume of the dye-linker attached to the sulfur group of a cysteine amino acid at position 428. We used dye parameters for ATTO647N maleimide as provided in Kalinin et al., 2012. We used the center of mass of the obtained cloud coordinates to calculate the expected pair-wise distances between fluorophores and obtained a distance of 9 nm between two adjacent subunits. Given the planar hexameric geometry, the other possible pair-wise distances are 15.5 nm and 18 nm. Inset shows the three possible configurations, classes I, II, and III obtained from particles labeled with three fluorophores. (b) The fraction of labeled protomers in ClpB molecules was calculated based on the binomial distribution. Here, we assume 50% labeling efficiency and therefore expect that 1/3 of proteins will carry three fluorophores. (c) Histogram of localization precisions with a median of 0.45 nm obtained from the hexamer data. (d-g) Photo-physics characterization of ATTO647N-maleimide attached ClpB protein imaged at 4 K. (d) The fluorophore stability histogram demonstrates a high survival fraction of molecules. (e) Histogram of the off-on ratio. (f) The mean number of photons per frame shows a twofold increase compared to the PCNA trimer with an average of ~510 photons. (g) Photon budget histogram plotted as a fraction of molecules versus total number of photons collected from 100,000 frames. Around 50% of the molecules emitted at least 107 photons. Error bars in d and g represent standard errors of the mean.
Figure 3—figure supplement 2.
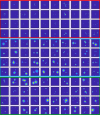
Figure 3—figure supplement 2.. Data set of the ClpB hexamer protein used for classification.
Some examples of the resolved 2D maps as obtained from polarization trace fitting with a three-state model. Particles were filtered based on a localization precision below 3 nm and classified (red = class I, blue = class II, green = class III). The image size is 200 × 200 pixel at 0.15 nm/pixel.
Figure 3—figure supplement 3.
Figure 3—figure supplement 3.. Estimation of particle misclassification based on simulation.
Examples of simulated projections from all classes were subject to template matching to evaluate the classification procedure. Results showed that we have up to 2% misclassification. The figure shows representative examples of these 2% of misclassified particles. The top row shows a particle which was put into class 3 rather than class 1. The second row shows a particle which was classified into 1 rather than 2. The third row shows a particle which was classified as 1 rather than 3. The difference between the scores of these particles is below 5%. We exclude such particles in our pipeline to avoid smearing.
Figure 3—figure supplement 4.
Figure 3—figure supplement 4.. Validation of the particle classification of the hexamer protein ClpB.
Here, we took all unclassified 2D images with correlation scores below 0.8 and calculated the 3D reconstruction as described in the method section of main text. The red volume in the image shows no valid structure and could not be fitted to the white clouds which represent the accessible volumes of the fluorophores as calculated for each protomer.
Figure 3—figure supplement 5.
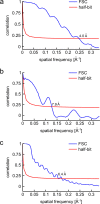
Figure 3—figure supplement 5.. FSC of the 3D volumes obtained for each class.
(a–c) For each class, an equal number of 2D images were divided randomly into two halves. Then, a 3D reconstruction was calculated for each half-data set, using a low-pass filtered model as an initial guess. The correlation between the two 3D reconstructions is calculated over shells of the Fourier transform and plotted as a function of spatial frequency (blue curves). The spatial resolution of the 3D reconstruction is then evaluated using the half-bit criterion (red solid line) as described in detail in van Heel and Schatz, 2005. (a) The FSC of class I yields a resolution of 4.0 Å. (b) The FSC of class II yields a resolution of 7.9 Å. (c) The FSC of class III yields a resolution of 6.4 Å.
Figure 4.
Figure 4.. Quantitative model selection for classification.
(a) Histogram of pair-wise distances from particles with two polarization states, showing a clear peak at ~9 nm as the most probable side length of the ClpB molecules. (b) Based on the identified most probable side length we built models of the oligomer with different symmetries, but sharing the same side length of 9 nm, and performed single-particle classification of the experimental images. The AIC criterion shows that the hexamer is the best model. Reducing the symmetry of the hexamer results in a worse fit. (c) Schematic of a model deviating from perfect symmetry. Each corner is allowed to be shifted within a circle of radius R. The classification procedure remains accurate for R ≤ 1 nm.
Figure 4—figure supplement 1.
Figure 4—figure supplement 1.. Testing different algorithms for template-free particle reconstruction.
Here we tested the code published by Heydarian et al., 2018 which is a template-free particle-fusion based on all-to-all registration approach. (a–b) First, we fed the coordinates of our 2D super-resolved experimental images obtained from the set of 467 particles used to generate the hexamer structure into the algorithm. Our experimental data samples different 3D orientations. Examples of different initial 2D projections are shown. (c) No clear reconstruction was obtained. (d-e) To explore this code further, we simulated 3D rotations of the structure ‘tud_ralf’ used in their study with 100% labeling efficiency. We applied rotations around the x axis within ±180 degrees (i.e. not only in-plane rotations as in the original code) and used the code ‘all-to-all’ to solve the structure. The panels show examples of different initial arrangements for two different orientations. (f) No clear reconstruction was obtained. (g–h) Last, we also used a simulated data set of our own hexamer structure. Here, we simulated 500 particles with 900 localization each, with a localization precision below 1 nm, a labeling efficiency of 50%, and different 3D orientations in order to mimic our experimental conditions. (i) Again, the algorithm fails to deliver a clear reconstruction.
Figure 4—figure supplement 2.
Figure 4—figure supplement 2.. Correlative polarCOLD and cryoEM on the single particle level.
By measuring the polarization signal of multiple fluorophores one can classify the particles in a low-contrast EM sample based on distances and orientation. In the exemplary case on the left (i) molecules are identified based on intermolecular or intramolecular distances, indicated by d1 and d2. The case on the right (ii) illustrates the sorting and sizing of interacting molecules using nanometer distance measurement with multi-color polarCOLD, where Apo proteins (P) and ligand (L) are labeled with different fluorophores, such that the resulting complex (PL) exhibits fluorescence at both wavelengths.
Author response image 1.
Author response image 1.. Polarization histogram of single fluorophore ATTO 647N imaged at 4K.
The histogram shows single population with a width of 5 degrees, which matches the expected shotnoise value estimated from 100 photons.
Author response image 2.
Author response image 2.. Quantitative model selection for classification.
(a) Histogram of pair-wise distances from particles with two polarization states, showing a clear peak at ~9 nm as the most probable side length of the ClpB molecules. (b) Based on the identified most probable side length we built models of the oligomer with different symmetries, but sharing the same side length of 9 nm, and performed single-particle classification of the experimental images. The AIC criterion shows that the hexamer is the best model. Reducing the symmetry of the hexamer results in a worse fit. (c) Schematic of a model deviating from perfect symmetry. Each corner is allowed to be shifted within a circle of radius R. The classification procedure remains accurate for R<=1 nm.
Author response image 3.
Author response image 3.. Experimental data obtained from partially labelled hexamer protein, as described in the main text.
Our experimental data samples 3D different orientations. (a-b) Examples of different initial 2D projections. (c) We fed the coordinates and localization precision of each of the 467 particles to the all2all algorithm developed by Heydarian et al., (Heydarian et al., 2018). The final reconstruction results fail to deliver the ground truth structural model. Instead, we obtained a scatter of points.
Author response image 4.
Author response image 4.. Simulation of the structural model “tud_ralf” from (Heydarian et al., 2018) at 100% labelling efficiency (see inset in c) under the application of 3D rotations (± 180 degrees) around the x-axis only.
(a-b) Examples of different initial arrangements for two different orientations. (c) 256 particles were fed to the all2all algorithm (Heydarian et al., 2018). The final reconstruction fails to deliver the ground truth structural model.
Author response image 5.
Author response image 5.. Simulation data of our hexamer structural model at 50% labeling efficiency.
Here we simulated 500 particles with 900 localizations each and localization precision below 1 nm, but sampling 3D different orientations. (a-b) Example of different initial particles, adopting different 3D orientations. (c) We fed the data to the all2all algorithm (Heydarian et al., 2018), and the final reconstruction, fails to deliver the ground truth structural model.
Author response image 6.
Author response image 6.. Scatter plot showing the difference between median and photon-weighted mean in the calculation of the coordinates.
Even in the absence of strong outliers (a) there is a minor difference (less than 0.3 nm on average) in the coordinates (b). Please note the different axis scales between (a) and (b).

Similar articles

Cited by

References

    1. Agronskaia AV, Valentijn JA, van Driel LF, Schneijdenberg CTWM, Humbel BM, van Bergen en Henegouwen PMP, Verkleij AJ, Koster AJ, Gerritsen HC. Integrated fluorescence and transmission electron microscopy. Journal of Structural Biology. 2008;164:183–189. doi: 10.1016/j.jsb.2008.07.003. - DOI - PubMed
    1. Alberts B. The cell as a collection of protein machines: preparing the next generation of molecular biologists. Cell. 1998;92:291–294. doi: 10.1016/s0092-8674(00)80922-8. - DOI - PubMed
    1. Backer AS, Lee MY, Moerner WE. Enhanced DNA imaging using super-resolution microscopy and simultaneous single-molecule orientation measurements. Optica. 2016;3:3–6. doi: 10.1364/OPTICA.3.000659. - DOI - PMC - PubMed
    1. Böning D, Wieser FF, Sandoghdar V. Polarization-Encoded Colocalization Microscopy at Cryogenic Temperatures. ACS Photonics. 2021;8:194–201. doi: 10.1021/acsphotonics.0c01201. - DOI
    1. Bruck I, O’Donnell M. The ring-type polymerase sliding clamp family. Genome Biology. 2001;2:REVIEWS3001. doi: 10.1186/gb-2001-2-1-reviews3001. - DOI - PMC - PubMed

MeSH terms

Substances

Grants and funding

The funders had no role in study design, data collection and interpretation, or the decision to submit the work for publication.