Meta-Analysis
. 2022 May 24:11:e73138.
doi: 10.7554/eLife.73138.

Type 2 diabetes mellitus accelerates brain aging and cognitive decline: Complementary findings from UK Biobank and meta-analyses

Affiliations
Meta-Analysis

Type 2 diabetes mellitus accelerates brain aging and cognitive decline: Complementary findings from UK Biobank and meta-analyses

Botond Antal et al. Elife. .

Abstract

Background: Type 2 diabetes mellitus (T2DM) is known to be associated with neurobiological and cognitive deficits; however, their extent, overlap with aging effects, and the effectiveness of existing treatments in the context of the brain are currently unknown.

Methods: We characterized neurocognitive effects independently associated with T2DM and age in a large cohort of human subjects from the UK Biobank with cross-sectional neuroimaging and cognitive data. We then proceeded to evaluate the extent of overlap between the effects related to T2DM and age by applying correlation measures to the separately characterized neurocognitive changes. Our findings were complemented by meta-analyses of published reports with cognitive or neuroimaging measures for T2DM and healthy controls (HCs). We also evaluated in a cohort of T2DM-diagnosed individuals using UK Biobank how disease chronicity and metformin treatment interact with the identified neurocognitive effects.

Results: The UK Biobank dataset included cognitive and neuroimaging data (N = 20,314), including 1012 T2DM and 19,302 HCs, aged between 50 and 80 years. Duration of T2DM ranged from 0 to 31 years (mean 8.5 ± 6.1 years); 498 were treated with metformin alone, while 352 were unmedicated. Our meta-analysis evaluated 34 cognitive studies (N = 22,231) and 60 neuroimaging studies: 30 of T2DM (N = 866) and 30 of aging (N = 1088). Compared to age, sex, education, and hypertension-matched HC, T2DM was associated with marked cognitive deficits, particularly in executive functioning and processing speed. Likewise, we found that the diagnosis of T2DM was significantly associated with gray matter atrophy, primarily within the ventral striatum, cerebellum, and putamen, with reorganization of brain activity (decreased in the caudate and premotor cortex and increased in the subgenual area, orbitofrontal cortex, brainstem, and posterior cingulate cortex). The structural and functional changes associated with T2DM show marked overlap with the effects correlating with age but appear earlier, with disease duration linked to more severe neurodegeneration. Metformin treatment status was not associated with improved neurocognitive outcomes.

Conclusions: The neurocognitive impact of T2DM suggests marked acceleration of normal brain aging. T2DM gray matter atrophy occurred approximately 26% ± 14% faster than seen with normal aging; disease duration was associated with increased neurodegeneration. Mechanistically, our results suggest a neurometabolic component to brain aging. Clinically, neuroimaging-based biomarkers may provide a valuable adjunctive measure of T2DM progression and treatment efficacy based on neurological effects.

Funding: The research described in this article was funded by the W. M. Keck Foundation (to LRMP), the White House Brain Research Through Advancing Innovative Technologies (BRAIN) Initiative (NSFNCS-FR 1926781 to LRMP), and the Baszucki Brain Research Fund (to LRMP). None of the funding sources played any role in the design of the experiments, data collection, analysis, interpretation of the results, the decision to publish, or any aspect relevant to the study. DJW reports serving on data monitoring committees for Novo Nordisk. None of the authors received funding or in-kind support from pharmaceutical and/or other companies to write this article.

Keywords: MRI; aging; brain; diabetes; epidemiology; functional MRI; global health; human; medicine; neuroimaging.


Conflict of interest statement

BA, LM, SS, AL, LM No competing interests declared, DW is part of a Novo Nordisk data monitoring committee service for semaglutide in SOUL and FLOW trials. The author has no other competing interests to declare, BD received royalties from Cambridge University Press and Oxford University Press, and consulting fees from Acadia, Alector, Arkuda, Biogen, Denali, Lilly, Merck, Novartis, Takeda, Wave LifeSciences (unrelated to the present work). Also participates in a Lilly Data Safety Monitoring Board (unrelated to the present work) and participates in leadership roles in Alzheimer's Association and Association for Frontotemporal Degeneration. The author has no other competing interests to declare, ER received honoraria from Harvard Catalyst. The author has no other competing interests to declare

Figures
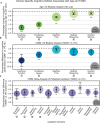
Figure 1.
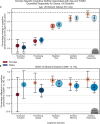
Figure 1.. Cognitive deficits are apparent with respect to both age and type 2 diabetes mellitus (T2DM) diagnosis.
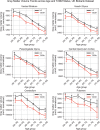
(A) Using the UK Biobank dataset, we performed a quantitative analysis of the effects related to age on cognitive performance across five cognitive domains. Associated changes were derived from estimated regression coefficients as percentages and are shown on the y-axis. Age was associated with significant deficits in all five domains, with the strongest effects observed in executive function and processing speed. (B) Using the same dataset, we also analyzed cognitive performance in T2DM, with negative values on the y-axis representing performance below that of age-, sex-, and education-matched healthy controls (HCs). As per age effects, executive function and processing speed showed the highest magnitude changes. (C) Cognitive deficits identified in UK Biobank data were confirmed by our meta-analysis, which included 11 domains from 34 studies. Average effect sizes (Cohen’s d) corresponding to T2DM are shown on the y-axis. Values below the cutoff line (y = 0) indicate cases in which subjects with T2DM performed less well than age- and education-matched HC. Numbers next to labels identify domains common across panels. Marker sizes represent sample sizes scaled (per area) as indicated in the bottom-right corner of each panel. On panel (C), sample size indicates the number of individual studies. Underlying sample size distributions can be found in Appendix 1—figures 1C and 2C. Error bars are 95% CI. *p≤0.05; **p≤0.01; ***p≤0.001, Bonferroni corrected.
Figure 1—figure supplement 1.
Figure 1—figure supplement 1.. Cognitive differences associated with sex in the UK Biobank dataset across the five cognitive domains.
Samples were healthy controls (HCs) only and were matched for age, education, and hypertension. Values on the y-axis represent % difference in performance compared to the combined average (from both females and males). A positive % represents better performance in males. Marker sizes represent sample sizes scaled (per area) as indicated in the bottom-right corner. Error bars are 95% CI. *p≤0.05; **p≤0.01; ***p≤0.001, Bonferroni corrected.
Figure 1—figure supplement 2.
Figure 1—figure supplement 2.. Cognitive differences associated with age (A) and type 2 diabetes mellitus (T2DM) (B) in the UK Biobank dataset across the five cognitive domains, analyzed separately within males and females.
Samples were matched for age, education, and hypertension. The associated effects were consistent across males vs. females, but with respect to T2DM, effects were generally stronger in males. Note that sample sizes were significantly larger for males compared to females. Marker sizes represent sample sizes scaled (per area) as indicated in the bottom-right corner of each panel. Error bars are 95% CI. *p≤0.05; **p≤0.01; ***p≤0.001, Bonferroni corrected.
Figure 1—figure supplement 3.
Figure 1—figure supplement 3.. Treatment of type 2 diabetes mellitus (T2DM) patients with metformin had no impact on cognitive deficits.
We evaluated the UK Biobank dataset to determine whether treatment with metformin would prevent the development of cognitive deficits associated with T2DM. Among T2DM-diagnosed subjects only, we compared those subjects who reported using metformin but no other medications to those who reported not taking any medications to treat T2DM. We matched subjects for age, sex, education, and T2DM disease duration, and controlled for body mass index (BMI). No statistically significant (α = 0.05) differences in cognitive performance were detected when comparing subjects on metformin to unmedicated subjects (arrow indicates the direction of expected improvement by metformin). Underlying sample size distributions can be found in Appendix 1—figure 7C. Error bars are 95% CI.
Figure 2.
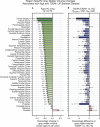
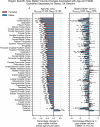
Figure 2.. Widespread gray matter atrophy can be observed with respect to both age and type 2 diabetes mellitus (T2DM) diagnosis status.
Using the UK Biobank dataset, we measured gray matter atrophy across 45 anatomical regions. Associated changes were derived from estimated regression coefficients as percentages and are shown on the x-axes. (A) We observed significantly decreased gray matter volume in both cortical and subcortical brain regions with respect to age in healthy controls (HCs). Age was associated with an average of ~0.5% brain-wide decrease in gray matter volume per year, most prominently for the ventral striatum and Heschl’s gyrus. (B) Gray matter atrophy was also seen in patients diagnosed with T2DM compared to age-matched HC, most prominently for the ventral striatum, cerebellum, and putamen. The distribution of T2DM-related effects overlapped with those associated with age, with degeneration of the ventral striatum and preservation of the thalamus and caudate. Underlying sample size distributions can be found in Appendix 1—figures 1A and 2A. Error bars are 95% CI. *p≤0.05; **p≤0.01; ***p≤0.001, Bonferroni corrected.
Figure 2—figure supplement 1.
Figure 2—figure supplement 1.. Effects of age and type 2 diabetes mellitus (T2DM) exhibited strong correlations within datasets and modalities.
We considered six sets of changes we previously characterized in association with the following: (1) age contrast, gray matter volume in UK Biobank; (2) T2DM contrast, gray matter volume in UK Biobank; (3) age contrast, brain activation in UK Biobank; (4) T2DM contrast, brain activation in UK Biobank; (5) age contrast, brain structure/activation (aggregate) from NeuroQuery; and (6) T2DM contrast, brain structure/activation (aggregate) from NeuroQuery. Corresponding effects from region-/domain-specific analyses were considered as inputs for correlation measures, which were then determined for all combinations of the six sets of effects. Age and T2DM were significantly correlated (Pearson’s r) within all modalities, suggesting common trajectories between age- and T2DM-related effects. No other significant correlations were observed, however, between datasets or modalities. Given that structural and functional effects appeared to be unrelated within UK Biobank, and that the NeuroQuery results were a combination of both structural and functional results, we did not expect significant associations between modality-specific UK Biobank results and multimodal (structural and functional) NeuroQuery results. However, it is important to note that very different ways of acquiring and analyzing brain data independently replicate the correlations between age- and T2DM-related effects, suggesting that the association is highly robust. See relevant scatterplots in Figure 2—figure supplement 2. *p≤0.05; **p≤0.01; ***p≤0.001, Bonferroni corrected.
Figure 2—figure supplement 2.
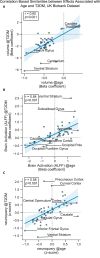
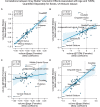
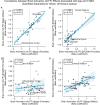
Figure 2—figure supplement 2.. Scatterplots corresponding to the statistically significant cells in Figure 2—figure supplement 1.
Statistics shown are Pearson’s correlations. Regions on the extremes are labeled. (A) Gray matter volume results, (B) brain activation (amplitude of low-frequency fluctuation [ALFF]) results, and (C) NeuroQuery-based meta-analysis results.
Figure 2—figure supplement 3.
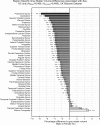
Figure 2—figure supplement 3.. Gray matter volume (normalized for head size) differences associated with sex in the UK Biobank dataset across the 45 anatomical regions.
Samples were healthy controls (HCs) only and were matched for age, education, and hypertension. Values on the x-axis represent % difference in volume compared to the combined average (from both females and males). A negative % represents larger volume in females. Error bars are 95% CI. *p≤0.05; **p≤0.01; ***p≤0.001, Bonferroni corrected.
Figure 2—figure supplement 4.
Figure 2—figure supplement 4.. Plots representing trends in total gray matter volume (normalized for head size) across age, sex, and type 2 diabetes mellitus (T2DM).
Samples were matched for age, education, and hypertension. The age-related decline appeared equivalent in the two sexes, but T2DM-associated deficits were stronger in males. With respect to disease duration (not shown), equivalent effects were observed magnitude-wise in males (24% ± 17%) and females (27% ± 32%), but these results were only significant in the male-only group (p=0.002), for which sample sizes were considerably larger (NM = 366, NF = 104).
Figure 2—figure supplement 5.
Figure 2—figure supplement 5.. Region-specific gray matter volume deficits associated with age (A) and type 2 diabetes mellitus (T2DM) (B) in the UK Biobank dataset, analyzed separately within females and males.
Samples were matched for age, education, and hypertension. The associated effects were correlated across males vs. females (see Figure 2—figure supplements 6 and 7A, B), With respect to T2DM, effects were generally stronger in males. Age and T2DM effects significantly correlated in males but not in females (see Figure 2—figure supplements 6 and 7C, D). Note that sample sizes were significantly larger for males compared to females. Error bars are 95% CI. *p≤0.05; **p≤0.01; ***p≤0.001, Bonferroni corrected.
Figure 2—figure supplement 6.
Figure 2—figure supplement 6.. We quantified correlations (Pearson’s r) among the region-specific gray matter volume deficits associated with age and type 2 diabetes mellitus (T2DM), which we quantified in the UK Biobank dataset separately for females and males.
See relevant scatterplots in Figure 2—figure supplement 7. *p≤0.05; **p≤0.01; ***p≤0.001, Bonferroni corrected.
Figure 2—figure supplement 7.
Figure 2—figure supplement 7.. Scatterplots corresponding to the most relevant cells in Figure 2—figure supplement 6.
Statistics shown are Pearson’s correlations. Regions on the extremes are labeled. All panels contain gray matter volume-related effects only. (A) Age-related effects in males vs. females, (B) type 2 diabetes mellitus (T2DM)-related effects in males vs. females, (C) age vs. T2DM effects in females only, and (D) age vs. T2DM effects in males only.
Figure 2—figure supplement 8.
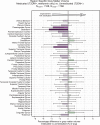
Figure 2—figure supplement 8.. Treatment of type 2 diabetes mellitus (T2DM) patients with metformin had no impact on gray matter atrophy.
We evaluated the UK Biobank dataset to determine whether treatment with metformin would prevent gray matter atrophy associated with T2DM. Among T2DM-diagnosed subjects only, we compared those subjects who reported using metformin but no other medications to those who reported not taking any medications to treat T2DM. We matched subjects for age, sex, education, and T2DM disease duration, and controlled for body mass index (BMI). Our analysis of gray matter atrophy did not detect significant (α = 0.05) improvement with metformin treatment (the direction of expected improvement by metformin is indicated by an arrow). Underlying sample size distributions can be found in Appendix 1—figure 7A. Error bars are 95% CI.
Figure 3.
Figure 3.. Age- and type 2 diabetes mellitus (T2DM)-associated reorganization patterns in brain activity are significant and overlap.
(A) For functional MRI data obtained from the UK Biobank dataset, we used the amplitude of low-frequency fluctuation (ALFF) to quantify brain activation. Effects linked to age are shown in the form of an unthresholded z-map represented by the pink-green color gradient, with pink indicating increased activation and green showing decreased. T2DM-related effects were thresholded (minimum cluster size ~100 mm3, false discovery rate [FDR] p<0.05) to result in significant clusters. The outlines of these significant clusters are overlaid on the age-related z-map to demonstrate overlapping effects. The largest significant clusters with respect to T2DM were in the subgenual area (increased) orbitofrontal cortex (increased), premotor cortex (decreased), and caudate (decreased). The highlighted regions were similarly impacted across age, indicating substantial overlap between the two contrasts. Underlying sample size distributions can be found in Appendix 1—figures 1B and 2B. (B) Using multimodal neuroimaging data, we performed a meta-analysis for the same contrasts using NeuroQuery. We extracted contrast maps for age and T2DM with NeuroQuery and overlaid the outlines of thresholded (minimum cluster size ~100 mm3, FDR p<0.05) z-maps from T2DM on unthresholded z-maps belonging to age. The overlapping effects were present in several regions, most importantly in the posterior cingulate gyrus, thalamus, caudate, and premotor cortex. These results support the hypothesis that neurodegeneration in both T2DM and aging may share common mechanistic pathways.
Figure 3—figure supplement 1.
Figure 3—figure supplement 1.. Effects of age and type 2 diabetes mellitus (T2DM) exhibited strong correlations within datasets and modalities.
We considered six sets of changes we previously characterized in association with the following: (1) age contrast, gray matter volume in UK Biobank; (2) T2DM contrast, gray matter volume in UK Biobank; (3) age contrast, brain activation in UK Biobank; (4) T2DM contrast, brain activation in UK Biobank; (5) age contrast, brain structure/activation (aggregate) from NeuroQuery; and (6) T2DM contrast, brain structure/activation (aggregate) from NeuroQuery. Corresponding effects from region-/domain-specific analyses were considered as inputs for correlation measures, which were then determined for all combinations of the six sets of effects. Age and T2DM were significantly correlated (Pearson’s r) within all modalities, suggesting common trajectories between age- and T2DM-related effects. No other significant correlations were observed, however, between datasets or modalities. Given that structural and functional effects appeared to be unrelated within UK Biobank, and that the NeuroQuery results were a combination of both structural and functional results, we did not expect significant associations between modality-specific UK Biobank results and multimodal (structural and functional) NeuroQuery results. However, it is important to note that very different ways of acquiring and analyzing brain data independently replicate the correlations between age- and T2DM-related effects, suggesting that the association is highly robust. See relevant scatterplots in Figure 3—figure supplement 2. *p≤0.05; **p≤0.01; ***p≤0.001, Bonferroni corrected.
Figure 3—figure supplement 2.
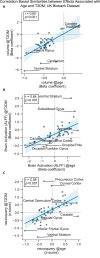
Figure 3—figure supplement 2.. Scatterplots corresponding to the statistically significant cells in Figure 3—figure supplement 1.
Statistics shown are Pearson’s correlations. Regions on the extremes are labeled. (A) Gray matter volume results, (B) brain activation (amplitude of low-frequency fluctuation [ALFF]) results, and (C) NeuroQuery-based meta-analysis results.
Figure 3—figure supplement 3.
Figure 3—figure supplement 3.. Resting-state brain activation (amplitude of low-frequency fluctuation [ALFF]) differences associated with sex in the UK Biobank dataset.
Samples were healthy controls (HCs) only and were matched for age, education, and hypertension. Only significantly different voxels are shown following false discovery rate correction (p<0.05). Positive (labeled with blue) voxels represent stronger activation in males compared to females.
Figure 3—figure supplement 4.
Figure 3—figure supplement 4.. Age and type 2 diabetes mellitus (T2DM)-associated reorganization patterns in brain activation (amplitude of low-frequency fluctuation [ALFF]) were overlaid separately for females (A) and males (B).
Samples were matched for age, education, and hypertension. Effects linked to age are shown in the form of an unthresholded z-map represented by the pink-green color gradient, with pink indicating increased activation and green showing decreased. T2DM-related effects were thresholded (minimum cluster size ~100 mm3, false discovery rate [FDR], p<0.05) to result in significant clusters. The outlines of these significant clusters are overlaid on the age-related z-map to demonstrate overlapping effects. As also seen with gray matter volume, the associated effects were correlated across males vs. females (see Figure 3—figure supplement Figure 3—figure supplements 5 and 6A, B), With respect to T2DM, effects were generally stronger in males. Age and T2DM effects significantly correlated in males but not in females (see Figure 3—figure supplement Figure 3—figure supplements 5 and 6C,D). Note that sample sizes were significantly larger for males compared to females.
Figure 3—figure supplement 5.
Figure 3—figure supplement 5.. We quantified correlations (Pearson’s r) among the region-specific changes in brain activation (amplitude of low-frequency fluctuation [ALFF]) patterns associated with age and type 2 diabetes mellitus (T2DM), which we quantified in the UK Biobank dataset separately for females and males.
See relevant scatterplots in Figure 3—figure supplement 6. *p≤0.05; **p≤0.01; ***p≤0.001, Bonferroni corrected.
Figure 3—figure supplement 6.
Figure 3—figure supplement 6.. Scatterplots corresponding to the primary cells in Figure 3—figure supplement 5.
Statistics shown are Pearson’s correlations. Regions on the extremes are labeled. All panels contain brain activation (amplitude of low-frequency fluctuation [ALFF]) effects only. (A) Age-related effects in males vs. females, (B) type 2 diabetes mellitus (T2DM)-related effects in males vs. females, (C) age vs. T2DM effects in females only, (D) age vs. T2DM effects in males only.
Figure 4.
Figure 4.. Progression of type 2 diabetes mellitus (T2DM) disease is significantly associated with gray matter atrophy, accelerating neurodegenerative effects seen in brain aging.
For a quantitative evaluation of the impact of T2DM progression on gray matter volume, we considered time since T2DM diagnosis as the main factor of interest from the UK Biobank dataset. The T2DM+ cohort was divided into two groups based on disease duration (separated at 10 years) with a healthy control (HC) cohort also included for visualization purposes. We matched age, sex, education, and hypertension across these three groups and performed linear regression within T2DM+ subjects focusing on disease duration. Evaluation of our sample suggested that time since diagnosis was a significant factor, with each year after diagnosis of T2DM associated with an additional ~0.26 ± 0.14 years of brain aging beyond that of age-matched HC. Underlying sample size distributions can be found in Appendix 1—figure 3. Error bars are standard error of the mean. *p≤0.05, **p≤0.01, ***p≤ 0.001.
Appendix 1—figure 1.
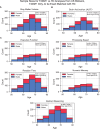
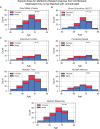
Appendix 1—figure 1.. Sample size distributions in type 2 diabetes mellitus (T2DM) vs. healthy control (HC) analyses.
The values shown represent T2DM+ only, T2DM+ were matched with an equivalent number of HCs, resulting in twice the number of samples in every analysis. The bars are stacked. (A) Gray matter volume analyses, (B) brain activation (amplitude of low-frequency fluctuation [ALFF]) analyses, and (C) cognition analyses (five domains).
Appendix 1—figure 2.
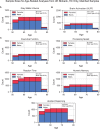
Appendix 1—figure 2.. Sample size distributions of the analyses that investigated age as the factor of interest.
Samples included healthy control (HC) only and were matched for sex, education, and hypertension across age. The matching method resulted in ‘sample chains’ across age: within each chain, samples were equivalent in terms of sex, education, and hypertension. The bars are stacked. (A) Gray matter volume analyses, (B) brain activation (amplitude of low-frequency fluctuation [ALFF]) analyses, and (C) cognition analyses (five domains).
Appendix 1—figure 3.
Appendix 1—figure 3.. Sample size distribution in the analysis that investigated type 2 diabetes mellitus (T2DM) duration as the main factor.
The values shown represent one out of the three duration groups (healthy controls [HCs], T2DM+ for 0–9 years, and T2DM+ for 10+ years). Samples across the three duration groups were matched for age, sex, education, and hypertension. Given the three groups, the total sample size was three times what is shown here. The statistical analysis included T2DM+ samples only (for which duration was defined), HCs were included for visual representation only. The bars are stacked.
Appendix 1—figure 4.
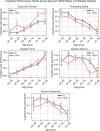
Appendix 1—figure 4.. Plots representing trends across age and type 2 diabetes mellitus (T2DM) for each of the five investigated cognitive domains.
For executive function and reaction time, lower scores represented better performance. The linear trends across age were robust and justified modeling age as a linear factor. The apparent deviation from linear trends in the youngest and oldest age groups is explained by markedly smaller sample sizes in those age groups (see underlying sample sizes in Appendix 1—figure 1C).
Appendix 1—figure 5.
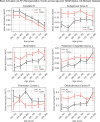
Appendix 1—figure 5.. Plots representing trends across age and type 2 diabetes mellitus (T2DM) for six regions that exhibited the strongest trends in gray matter volume changes.
The linear trends across age were robust and justified modeling age as a linear factor. The apparent deviation from linear trends in the youngest and oldest age groups is explained by markedly smaller sample sizes in those age groups (see underlying sample sizes in Appendix 1—figure 1A).
Appendix 1—figure 6.
Appendix 1—figure 6.. Lineplots representing trends across age and type 2 diabetes mellitus (T2DM) for six regions that exhibited the strongest trends in brain activation (amplitude of low-frequency fluctuation [ALFF]).
The linear trends across age were robust and justified modeling age as a linear factor. The apparent deviation from linear trends in the youngest and oldest age groups is explained by markedly sample sizes in those age groups (see underlying sample sizes in Appendix 1—figure 1B).
Appendix 1—figure 7.
Appendix 1—figure 7.. Sample size distributions in metformin medication status-related analyses.
The values shown represent metformin medicated type 2 diabetes mellitus (T2DM)+ only, these samples were matched with an equivalent number of unmedicated T2DM+ samples, resulting in twice the number of samples in every analysis. Samples were matched for age, sex, education, and hypertension. The bars are stacked. (A) Gray matter volume analyses, (B) brain activation analyses, and (C) cognition analyses (five domains).

Similar articles

Cited by

References

    1. Alfaro-Almagro F, Jenkinson M, Bangerter NK, Andersson JLR, Griffanti L, Douaud G, Sotiropoulos SN, Jbabdi S, Hernandez-Fernandez M, Vallee E, Vidaurre D, Webster M, McCarthy P, Rorden C, Daducci A, Alexander DC, Zhang H, Dragonu I, Matthews PM, Miller KL, Smith SM. Image processing and Quality Control for the first 10,000 brain imaging datasets from UK Biobank. NeuroImage. 2018;166:400–424. doi: 10.1016/j.neuroimage.2017.10.034. - DOI - PMC - PubMed
    1. Bae JP, Lage MJ, Mo D, Nelson DR, Hoogwerf BJ. Obesity and glycemic control in patients with diabetes mellitus: Analysis of physician electronic health records in the US from 2009-2011. Journal of Diabetes and Its Complications. 2016;30:212–220. doi: 10.1016/j.jdiacomp.2015.11.016. - DOI - PubMed
    1. Behl C. Oestrogen as a neuroprotective hormone. Nature Reviews. Neuroscience. 2002;3:433–442. doi: 10.1038/nrn846. - DOI - PubMed
    1. Biessels GJ, Staekenborg S, Brunner E, Brayne C, Scheltens P. Risk of dementia in diabetes mellitus: a systematic review. The Lancet. Neurology. 2006;5:64–74. doi: 10.1016/S1474-4422(05)70284-2. - DOI - PubMed
    1. Bower JK, Meadows RJ, Foster MC, Foraker RE, Shoben AB. The Association of Percent Body Fat and Lean Mass With HbA1c in US Adults. Journal of the Endocrine Society. 2017;1:600–608. doi: 10.1210/js.2017-00046. - DOI - PMC - PubMed

Publication types