Development and validation of an RNA-seq-based transcriptomic risk score for asthma
- PMID: 35606385
- PMCID: PMC9126925
- DOI: 10.1038/s41598-022-12199-0
Development and validation of an RNA-seq-based transcriptomic risk score for asthma
Abstract
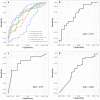
Recent progress in RNA sequencing (RNA-seq) allows us to explore whole-genome gene expression profiles and to develop predictive model for disease risk. The objective of this study was to develop and validate an RNA-seq-based transcriptomic risk score (RSRS) for disease risk prediction that can simultaneously accommodate demographic information. We analyzed RNA-seq gene expression data from 441 asthmatic and 254 non-asthmatic samples. Logistic least absolute shrinkage and selection operator (Lasso) regression analysis in the training set identified 73 differentially expressed genes (DEG) to form a weighted RSRS that discriminated asthmatics from healthy subjects with area under the curve (AUC) of 0.80 in the testing set after adjustment for age and gender. The 73-gene RSRS was validated in three independent RNA-seq datasets and achieved AUCs of 0.70, 0.77 and 0.60, respectively. To explore their biological and molecular functions in asthma phenotype, we examined the 73 genes by enrichment pathway analysis and found that these genes were significantly (p < 0.0001) enriched for DNA replication, recombination, and repair, cell-to-cell signaling and interaction, and eumelanin biosynthesis and developmental disorder. Further in-silico analyses of the 73 genes using Connectivity map shows that drugs (mepacrine, dactolisib) and genetic perturbagens (PAK1, GSR, RBM15 and TNFRSF12A) were identified and could potentially be repurposed for treating asthma. These findings show the promise for RNA-seq risk scores to stratify and predict disease risk.
© 2022. The Author(s).
Conflict of interest statement
The authors declare no competing interests.
Figures


Similar articles
-
Development and validation of asthma risk prediction models using co-expression gene modules and machine learning methods.Sci Rep. 2023 Jul 12;13(1):11279. doi: 10.1038/s41598-023-35866-2. Sci Rep. 2023. PMID: 37438356 Free PMC article.
-
Transcriptome sequencing (RNA-Seq) of human endobronchial biopsies: asthma versus controls.Eur Respir J. 2013 Sep;42(3):662-70. doi: 10.1183/09031936.00115412. Epub 2013 Jan 11. Eur Respir J. 2013. PMID: 23314903
-
Construction of a novel mRNA-signature prediction model for prognosis of bladder cancer based on a statistical analysis.BMC Cancer. 2021 Jul 27;21(1):858. doi: 10.1186/s12885-021-08611-z. BMC Cancer. 2021. PMID: 34315402 Free PMC article.
-
Peripheral blood transcriptomic clusters uncovered immune phenotypes of asthma.Respir Res. 2022 Sep 8;23(1):237. doi: 10.1186/s12931-022-02156-w. Respir Res. 2022. PMID: 36076228 Free PMC article.
-
Integrated analysis of single-cell RNA-seq dataset and bulk RNA-seq dataset constructs a prognostic model for predicting survival in human glioblastoma.Brain Behav. 2022 May;12(5):e2575. doi: 10.1002/brb3.2575. Epub 2022 Apr 16. Brain Behav. 2022. PMID: 35429411 Free PMC article.
Cited by
-
Aggregated Molecular Phenotype Scores: Enhancing Assessment and Visualization of Mass Spectrometry Imaging Data for Tissue-Based Diagnostics.Anal Chem. 2023 Aug 29;95(34):12913-12922. doi: 10.1021/acs.analchem.3c02389. Epub 2023 Aug 14. Anal Chem. 2023. PMID: 37579019 Free PMC article.
-
Exploring Factors Underlying Poorly-Controlled Asthma in Adults by Integrating Phenotypes and Genotypes Associated with Obesity and Asthma: A Case-Control Study.J Asthma Allergy. 2023 Jan 21;16:135-147. doi: 10.2147/JAA.S397067. eCollection 2023. J Asthma Allergy. 2023. PMID: 36714050 Free PMC article.
References
Publication types
MeSH terms
Grants and funding
LinkOut - more resources
Full Text Sources
Medical
Research Materials

