. 2022 May 6:13:823511.
doi: 10.3389/fimmu.2022.823511. eCollection 2022.

Neutrophil Extracellular Traps Regulate HMGB1 Translocation and Kupffer Cell M1 Polarization During Acute Liver Transplantation Rejection

Affiliations

Neutrophil Extracellular Traps Regulate HMGB1 Translocation and Kupffer Cell M1 Polarization During Acute Liver Transplantation Rejection

Yanyao Liu et al. Front Immunol. .

Abstract

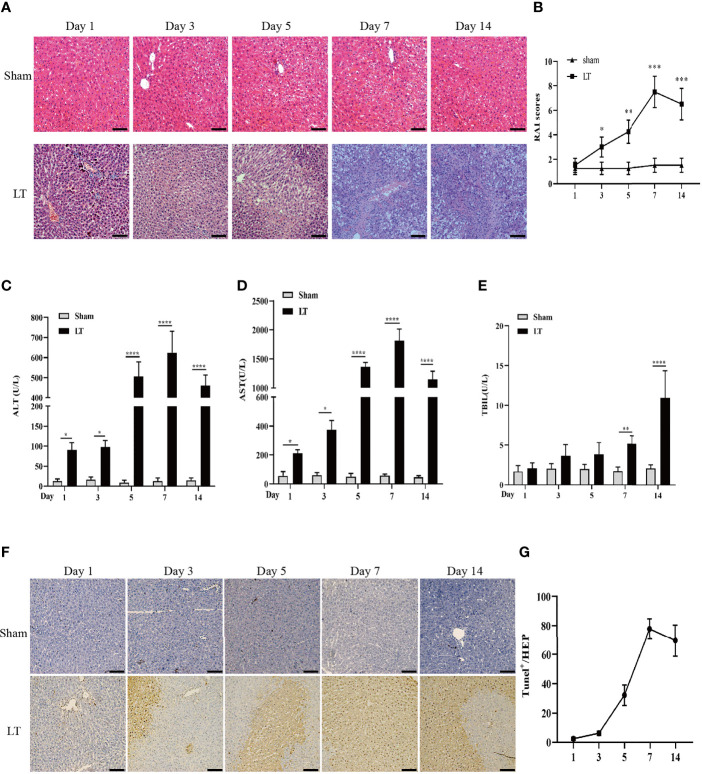
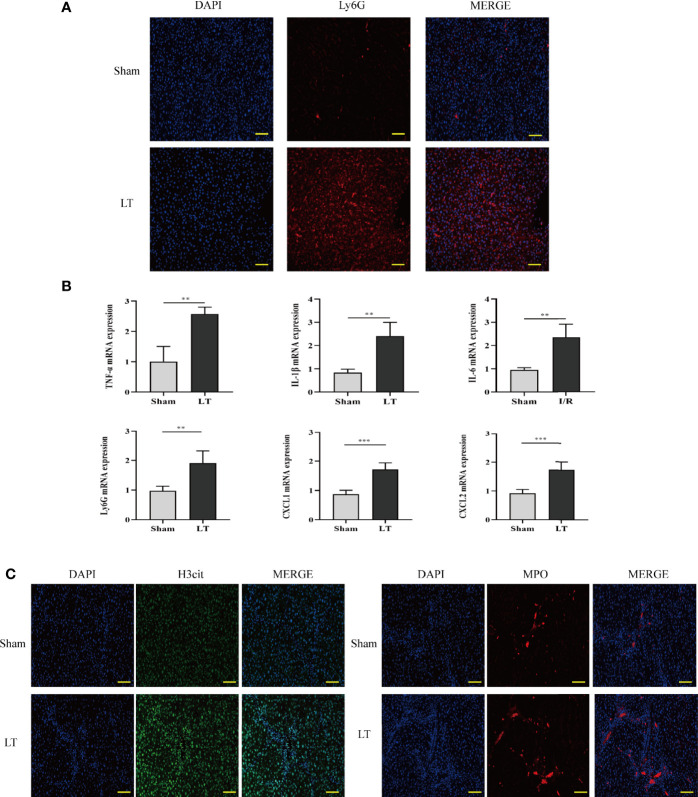
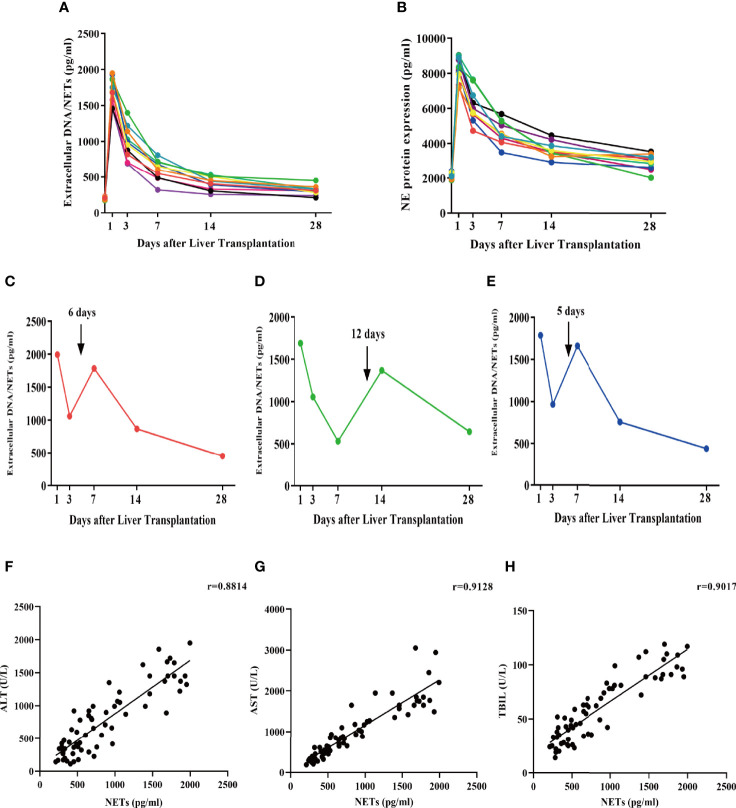
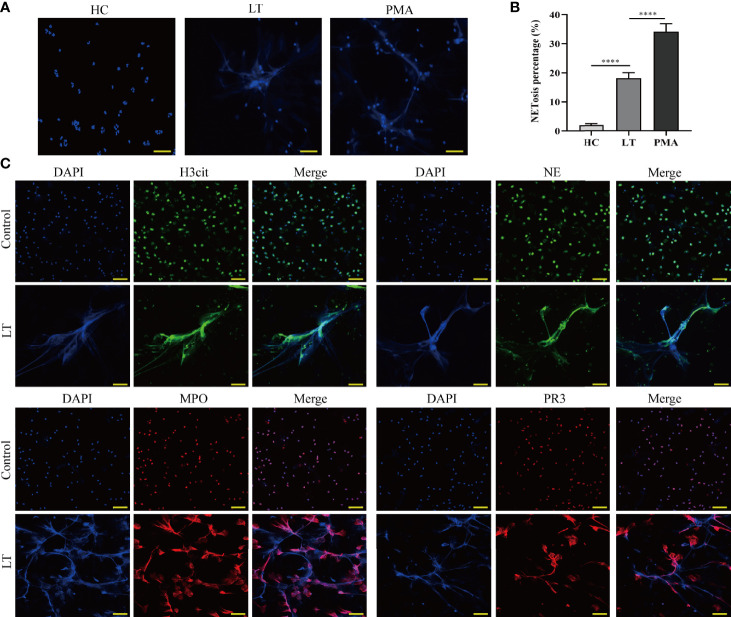
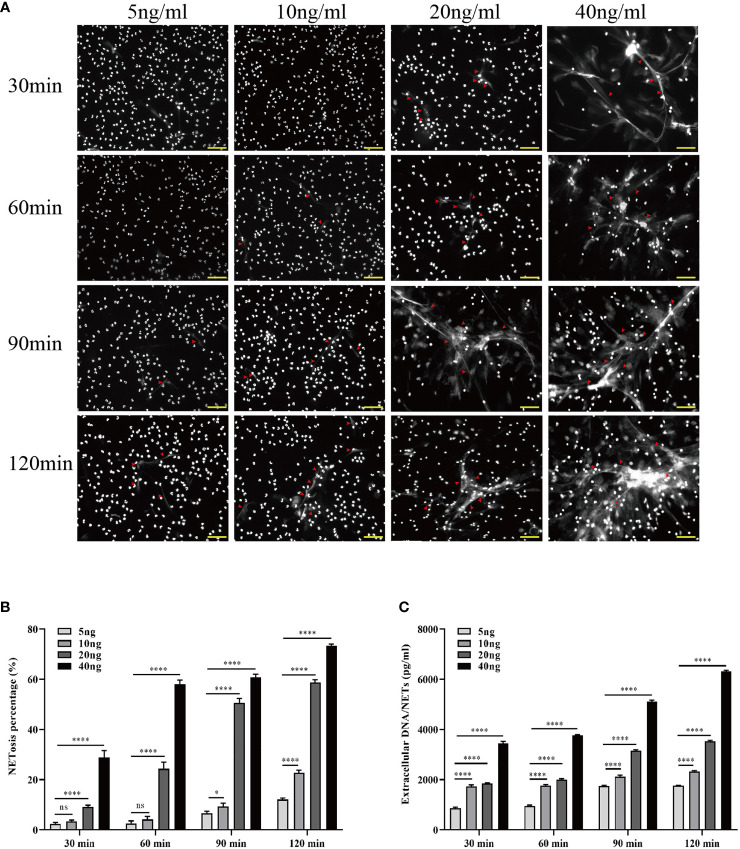
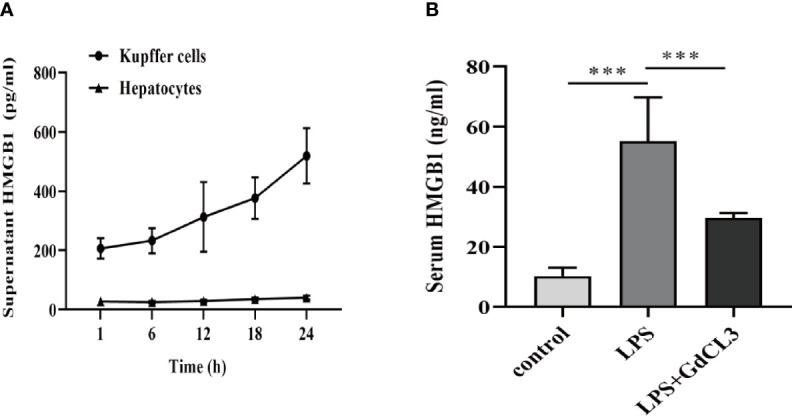
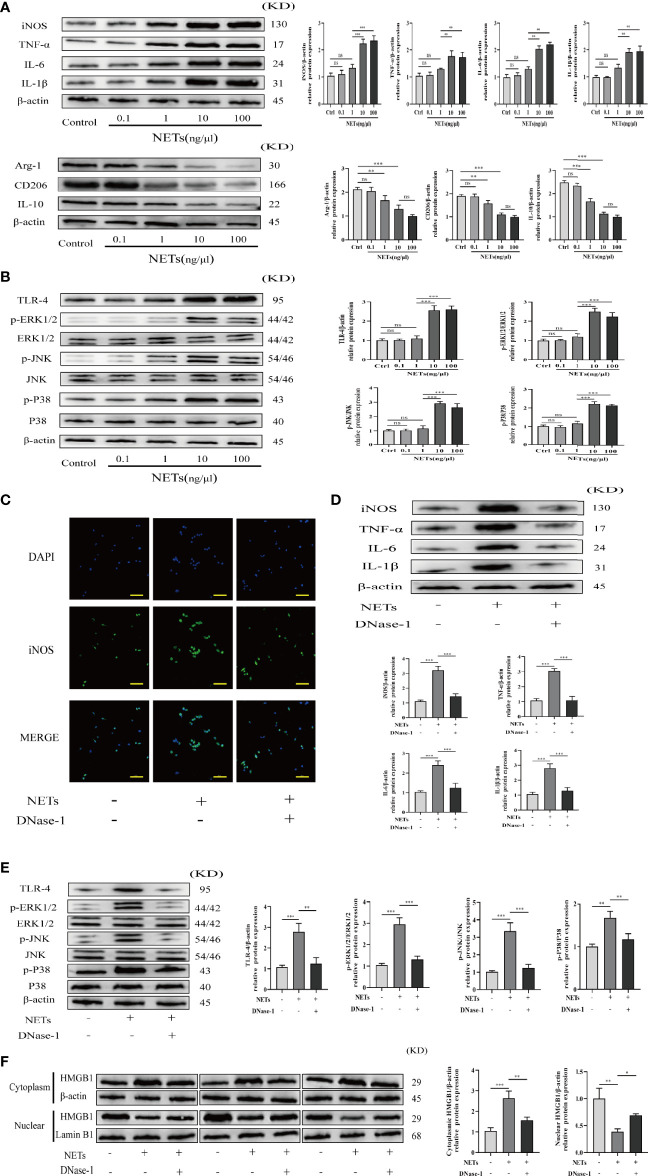
Neutrophil extracellular traps (NETs) play important roles in hepatic ischemic reperfusion injury (IRI) and acute rejection (AR)-induced immune responses to inflammation. After liver transplantation, HMGB1, an inflammatory mediator, contributes to the development of AR. Even though studies have found that HMGB1 can promote NET formation, the correlation between NETs and HMGB1 in the development of AR following liver transplantation has not been elucidated. In this study, levels of serum NETs were significantly elevated in patients after liver transplantation. Moreover, we found that circulating levels of NETs were negatively correlated with liver function. In addition, liver transplantation and elevated extracellular HMGB1 promoted NET formation. The HMGB1/TLR-4/MAPK signaling pathway, which is initiated by HMGB1, participates in NET processes. Moreover, in the liver, Kupffer cells were found to be the main cells secreting HMGB1. NETs induced Kupffer cell M1 polarization and decreased the intracellular translocation of HMGB1 by inhibiting DNase-1. Additionally, co-treatment with TAK-242 (a TLR-4 inhibitor) and rapamycin more effectively alleviated the damaging effects of AR following liver transplantation than either drug alone.

Keywords: Kupffer cell; acute rejection; high mobility group box-1 (HMGB1); liver transplantation; neutrophil extracellular traps (NETs).


Conflict of interest statement

The authors declare that the research was conducted in the absence of any commercial or financial relationships that could be construed as a potential conflict of interest.

Figures

Figure 1
Figure 1
AR responses in isograft and allograft groups. (A) Hepatic pathologic alteration following liver transplantation on days 1, 3, 5, 7, and 14 (magnification, ×200; scale bar = 100 μm). (B) Histological classification was determined by RAI based on Banff’s scheme. (C–E) Serum ALT, TBIL, and AST levels on days 1, 3, 5, 7, and 14 following liver transplantation. (F, G) Hepatic apoptosis detected by TUNEL following liver transplantation on days 1, 3, 5, 7, and 14 (magnification, ×200; scale bar = 100 μm). All differences denoted by asterisks were subjected to Student’s t-tests. The values are presented as mean ± SD (n = 6). * P < 0.05, ** P < 0.01, ***P < 0.001, **** P < 0.0001.
Figure 2
Figure 2
Neutrophil infiltration and NET deposits in the liver induce an inflammatory response in the AR of liver transplantation rats. (A) Immunofluorescence assessment of the neutrophil marker (Ly6G) for labeling neutrophil locations in livers (magnification, ×200; scale bar = 100 μm). (B) mRNA TNF-α, IL-6, Ly6G, IL-1β, CXCL1, and CXCL2 levels in liver tissues. (C) Representative immunofluorescence micrographs demonstrating the co-localization of NET components, including H3Cit, DAPI, and MPO in the livers of liver transplantation rats (magnification, ×200; scale bar = 100 μm). Data were analyzed by the Mann–Whitney test. Data are presented as mean ± SD (n = 6). ** P < 0.01, *** P < 0.001.
Figure 3
Figure 3
Serum extracellular NETs and circulating NETosis products are increased in patients undergoing liver transplantation. (A, B) Extracellular NET and NET levels (NE) were determined in the serum of patients undergoing liver transplantation without AR at days 1, 3, 7, 14, and 28. (C–E) Extracellular NETs were measured in the serum of liver transplantation patients with AR at days 1, 3, 7, 14, and 28. (F–H) Pearson correlation analysis of NETs with ALT, AST, and TBIL.
Figure 4
Figure 4
Release of NETs from peripheral blood neutrophils in liver transplantation patients. (A) Neutrophil cells were obtained from the peripheral venous blood of healthy controls (HC) and liver transplantation patients. They were incubated at 37°C for 2 h without stimulation. PMA was used as a positive control (magnification, ×200; scale bar = 100 μm). (B) Quantification of neutrophil NETosis. (C) Immunofluorescence assessment of NET formation as determined by colocalization of H3Cit, NE, MPO, PR3, and DAPI (magnification, ×200; scale bar = 100 μm). n = 6 for each group. Data were analyzed using the chi-square test. ****P < 0.0001.
Figure 5
Figure 5
Increased HMGB1 induces more NETosis in vitro. (A) Induction of NETosis in neutrophils from healthy individuals using different concentrations of HMGB1 (5, 10, 20, 40 ng/ml) at various time points (30, 60, 90, 120 min). (B) Quantification of neutrophil NETosis percentage. (C) Extracellular DNA/NETs were quantified every 30 min over a period of 120 min. n = 6. Differences were determined using one-way ANOVA. ns P > 0.05, * P < 0.05, *** P < 0.001, **** P < 0.0001.
Figure 6
Figure 6
TAK-242 suppresses the MAPK signaling pathways and alleviates NET deposition in rat liver transplantation. (A) Following transplantation, NETs were stained with DAPI in the livers of rats (magnification, ×200; scale bar = 100 μm). (B) Quantification of extracellular DNA/NETs in different groups. (C) The mRNA level of IL-1β, TNF-α, and IL-6 in liver tissues from different groups. (D) Protein expression levels of MAPK signaling pathway factors. n = 6 for each group. ANOVA was used to determine the statistical differences between groups. * P < 0.05, ** P < 0.01, *** P < 0.001, **** P < 0.0001.
Figure 7
Figure 7
Kupffer cells are the major HMGB1-secreting cells. (A) ELISA analysis of supernatant HMGB1 levels in primary rat Kupffer cells and hepatocytes following stimulation by LPS (1 μg/ml). (B) Rats were intraperitoneally administered with LPS (8 mg/kg) in the absence or presence of GdCl3 (20 mg/kg for 24 h before LPS injection) injection. Serum HMGB1 was measured by ELISA, 12 h after the injection. n = 6 for each group. One-way ANOVA was used to determine the statistical differences between groups. *** P < 0.001.
Figure 8
Figure 8
NETs promote M1 polarization of Kupffer cells and HMGB1 intracellular translocation. (A, B) Expression of M1/M2 polarization markers and TLR-4/MAPK signaling pathway factors in Kupffer cells induced by different concentrations of NETs. (C) Immunofluorescence assessment of Kupffer cell M1 polarization as determined by iNOS colocalization and DAPI (magnification, ×400; scale bar = 50 μm). (D, E) Expression of M1 polarization markers and TLR-4/MAPK signaling pathway factors in Kupffer cells stimulated by NETs in the absence or presence of DNase-1. (F) Immunoblotting was used to determine the translocation of HMGB1 from the nucleus to the cytoplasm. n = 6. One-way ANOVA was used to determine the statistical differences between groups. ns P < 0.05, * P < 0.05, ** P < 0.01, *** P < 0.001.
Figure 9
Figure 9
Effects of co-treatment of TAK-242 and rapamycin on AR following liver transplantation in rats. (A) Pathological changes in the liver and hepatic apoptosis following co-treatment with TAK-242 and rapamycin during AR (magnification, ×200; scale bar = 100 μm). (B) RAI was classified based on Banff patterns. (C, D) Serum levels of ALT and AST on days 1, 3, 5, 7, and 14 after liver transplantation. (E) Survival rate of rats. n = 6 for each group. Statistical differences among groups were assessed by one-way ANOVA. ns P > 0.05, * P < 0.05, *** P < 0.001.
Figure 10
Figure 10
The proposed model shows that NETs induce M1 polarization of Kupffer cells and HMGB1 translocation via HMGB1/TLR-4/MAPK signaling pathway during AR following liver transplantation. HMGB1 promotes NET formation by activating the HMGB1/TLR-4/MAPK signaling pathway. NETs stimulate M1 polarization of Kupffer cells and HMGB1 intracellular translocation. Subsequently, HMGB1 is released into the extracellular milieu to aggravate liver injury. HMGB1, high-mobility group box 1 protein; TLR-4, toll-like receptor 4; MAPK, mitogen-activated protein kinase; AR, acute rejection.

Similar articles

Cited by

References

    1. Perálvarez MR, Germani G, Darius T, et al. . Tacrolimus Trough Levels, Rejection and Renal Impairment in Liver Transplantation: A Systematic Review and Meta-Analysis. Am J Transpl (2012) 12:2797–814. doi: 10.1111/j.1600-6143.2012.04140.x - DOI - PubMed
    1. Levitsky J, Goldberg D, Smith AR, Mansfield SA, Gillespie BW, Merion RM, et al. . Acute Rejection Increases Risk of Graft Failure and Death in Recent Liver Transplant Recipients. Clin Gastroenterol Hepatol (2017) 15(4):584–593.e2. doi: 10.1016/j.cgh.2016.07.035 - DOI - PMC - PubMed
    1. Wiesner RH, Demetris AJ, Belle SH, et al. . Acute Hepatic Allograft Rejection: Incidence, Risk Factors, and Impact on Outcome. Hepatology (1998) 28:638–45. doi: 10.1002/hep.510280306 - DOI - PubMed
    1. Levitsky J. Operational Tolerance: Past Lessons and Future Prospects. Liver Transpl (2011) 17:222–32. doi: 10.1002/lt.22265 - DOI - PubMed
    1. Oliveira THCD, Marques PE, Proost P, Teixeira MMM. Neutrophils: A Cornerstone of Liver Ischemia and Reperfusion Injury. Lab Invest (2018) 98(1):51–62. doi: 10.1038/labinvest.2017.90 - DOI - PubMed