A Preliminary Quantitative Electron Microscopic Analysis Reveals Reduced Number of Mitochondria in the Infralimbic Cortex of Rats Exposed to Chronic Mild Stress
- PMID: 35600987
- PMCID: PMC9115382
- DOI: 10.3389/fnbeh.2022.885849
A Preliminary Quantitative Electron Microscopic Analysis Reveals Reduced Number of Mitochondria in the Infralimbic Cortex of Rats Exposed to Chronic Mild Stress
Abstract
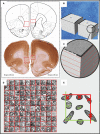
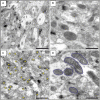
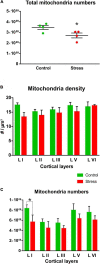
Exposure to severe, uncontrollable and long-lasting stress is a strong risk factor for the development of numerous mental and somatic disorders. Animal studies document that chronic stress can alter neuronal morphology and functioning in limbic brain structures such as the prefrontal cortex. Mitochondria are intracellular powerhouses generating chemical energy for biochemical reactions of the cell. Recent findings document that chronic stress can lead to changes in mitochondrial function and metabolism. Here, we studied putative mitochondrial damage in response to chronic stress in neurons of the medial prefrontal cortex. We performed a systematic quantitative ultrastructural analysis to examine the consequences of 9-weeks of chronic mild stress on mitochondria number and morphology in the infralimbic cortex of adult male rats. In this preliminary study, we analyzed 4,250 electron microscopic images and 67000 mitochondria were counted and examined in the brains of 4 control and 4 stressed rats. We found significantly reduced number of mitochondria in the infralimbic cortex of the stressed animals, but we could not detect any significant alteration in mitochondrial morphology. These data support the concept that prolonged stress can lead to mitochondrial loss. This in turn may result in impaired energy production. Reduced cellular energy may sensitize the neurons to additional injuries and may eventually trigger the development of psychopathologies.
Keywords: animal model for depression; chronic mild stress (CMS); electron microscope; infralimbic cortex; medial prefrontal cortex (mPFC); mitochondria; quantitative analysis; ultrastructure.
Copyright © 2022 Csabai, Sebők-Tornai, Wiborg and Czéh.
Conflict of interest statement
The authors declare that the research was conducted in the absence of any commercial or financial relationships that could be construed as a potential conflict of interest.
Figures


Similar articles
-
Reduced Synapse and Axon Numbers in the Prefrontal Cortex of Rats Subjected to a Chronic Stress Model for Depression.Front Cell Neurosci. 2018 Jan 30;12:24. doi: 10.3389/fncel.2018.00024. eCollection 2018. Front Cell Neurosci. 2018. PMID: 29440995 Free PMC article.
-
Long-Term Stress Disrupts the Structural and Functional Integrity of GABAergic Neuronal Networks in the Medial Prefrontal Cortex of Rats.Front Cell Neurosci. 2018 Jun 20;12:148. doi: 10.3389/fncel.2018.00148. eCollection 2018. Front Cell Neurosci. 2018. PMID: 29973870 Free PMC article.
-
Chronic stress alters neural activity in medial prefrontal cortex during retrieval of extinction.Neuroscience. 2011 Feb 3;174:115-31. doi: 10.1016/j.neuroscience.2010.10.070. Epub 2010 Oct 31. Neuroscience. 2011. PMID: 21044660 Free PMC article.
-
Stress-induced alterations in prefrontal dendritic spines: Implications for post-traumatic stress disorder.Neurosci Lett. 2015 Aug 5;601:41-5. doi: 10.1016/j.neulet.2014.12.035. Epub 2014 Dec 18. Neurosci Lett. 2015. PMID: 25529195 Review.
-
Remodeling of axo-spinous synapses in the pathophysiology and treatment of depression.Neuroscience. 2013 Oct 22;251:33-50. doi: 10.1016/j.neuroscience.2012.09.057. Epub 2012 Oct 2. Neuroscience. 2013. PMID: 23036622 Free PMC article. Review.
Cited by
-
Mitochondrial dysfunction in animal models of PTSD: Relationships between behavioral models, neural regions, and cellular maladaptation.Front Physiol. 2023 Feb 15;14:1105839. doi: 10.3389/fphys.2023.1105839. eCollection 2023. Front Physiol. 2023. PMID: 36923289 Free PMC article. Review.
-
A New Concept of Associations between Gut Microbiota, Immunity and Central Nervous System for the Innovative Treatment of Neurodegenerative Disorders.Metabolites. 2022 Nov 1;12(11):1052. doi: 10.3390/metabo12111052. Metabolites. 2022. PMID: 36355135 Free PMC article.
References
LinkOut - more resources
Full Text Sources

