

Ferrostatin-1-loaded liposome for treatment of corneal alkali burn via targeting ferroptosis
- PMID: 35600640
- PMCID: PMC9115688
- DOI: 10.1002/btm2.10276
Ferrostatin-1-loaded liposome for treatment of corneal alkali burn via targeting ferroptosis
Abstract
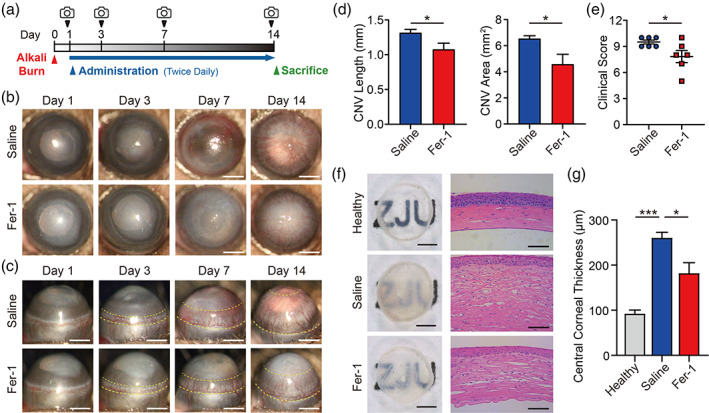
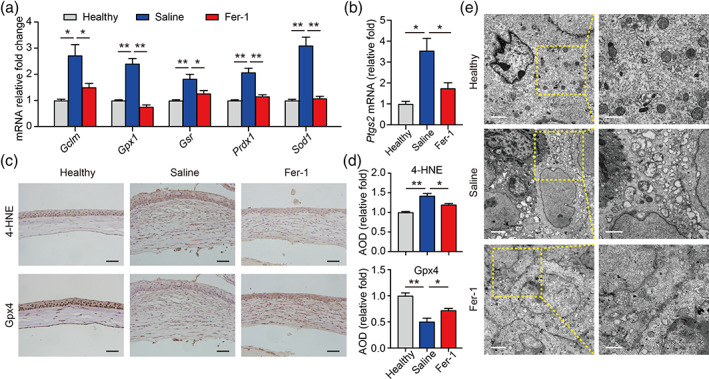
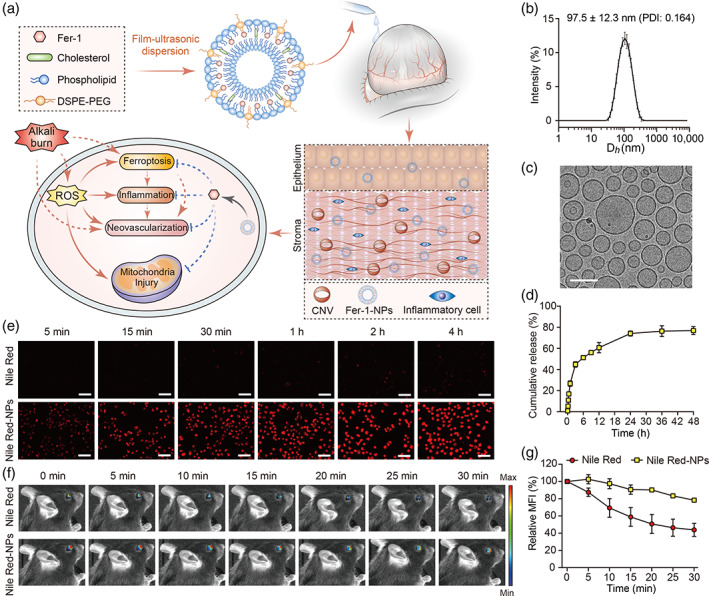
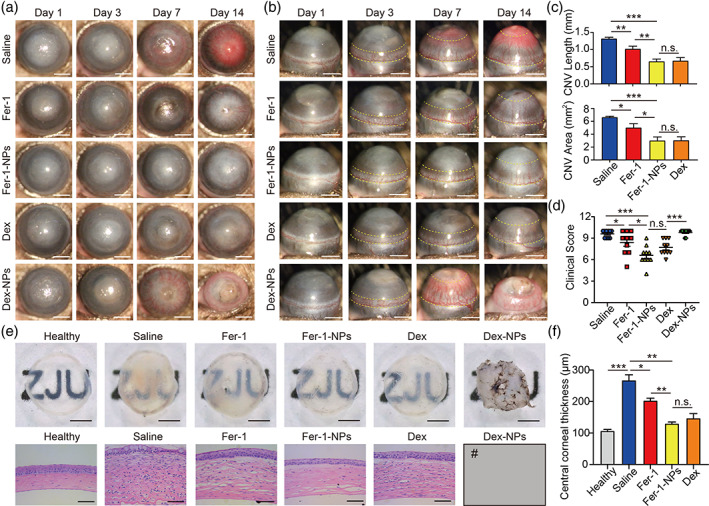
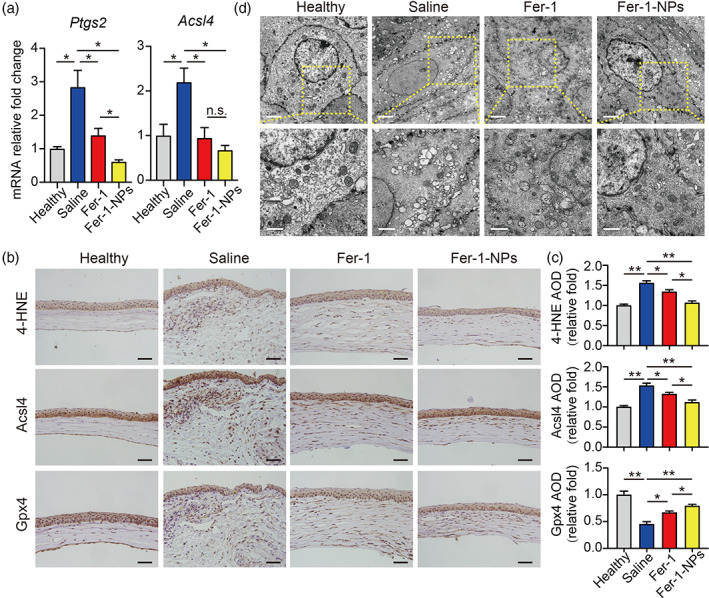
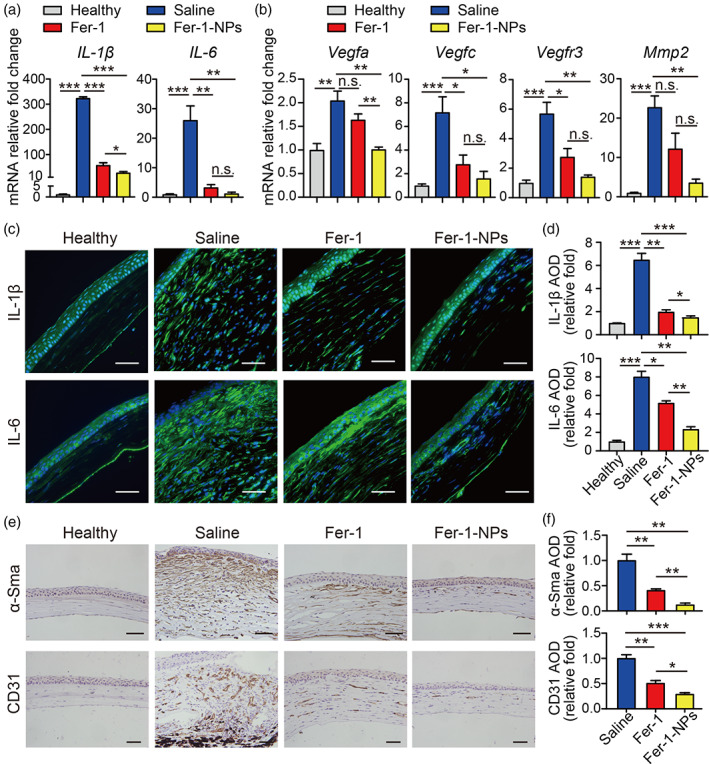
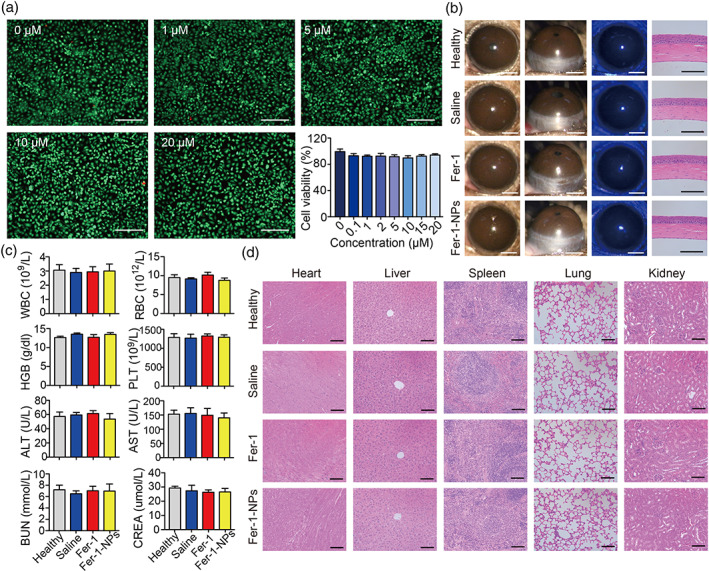
Alkali burn is a potentially blinding corneal injury. During the progression of alkali burn-induced injury, overwhelmed oxidative stress in the cornea triggers cell damage, including oxidative changes in cellular macromolecules and lipid peroxidation in membranes, leading to impaired corneal transparency, decreased vision, or even blindness. In this study, we identified that ferroptosis, a type of lipid peroxidation-dependent cell death, mediated alkali burn-induced corneal injury. Ferroptosis-targeting therapy protected the cornea from cell damage and neovascularization. However, the specific ferroptosis inhibitor ferrostatin-1 (Fer-1) is hydrophobic and cannot be directly applied in the clinic. Therefore, we developed Fer-1-loaded liposomes (Fer-1-NPs) to improve the bioavailability of Fer-1. Our study demonstrated that Fer-1-NPs exerted remarkable curative effects regarding corneal opacity and neovascularization in vivo. The efficacy was comparable to that of dexamethasone, but without appreciable side effects. The significant suppression of ferroptosis (induced by lipid peroxidation and mitochondria disruption), inflammation, and neovascularization might be the mechanisms underlying the therapeutic effect of Fer-1-NPs. Moreover, the Fer-1-NPs treatment showed no signs of cytotoxicity, hematologic toxicity, or visceral organ damage, which further confirmed the biocompatibility. Overall, Fer-1-NPs provide a new prospect for safe and effective therapy for corneal alkali burn.
Keywords: corneal alkali burn; corneal neovascularization; ferroptosis; ferrostatin‐1; liposome.
© 2021 The Authors. Bioengineering & Translational Medicine published by Wiley Periodicals LLC on behalf of American Institute of Chemical Engineers.
Conflict of interest statement
The authors have no conflicts of interest to declare.
Figures
Similar articles
-
Liposome-trimethyl chitosan nanoparticles codeliver insulin and siVEGF to treat corneal alkali burns by inhibiting ferroptosis.Bioeng Transl Med. 2023 Feb 9;8(2):e10499. doi: 10.1002/btm2.10499. eCollection 2023 Mar. Bioeng Transl Med. 2023. PMID: 36925675 Free PMC article.
-
AIP1 suppresses neovascularization by inhibiting the NOX4-induced NLRP3/NLRP6 imbalance in a murine corneal alkali burn model.Cell Commun Signal. 2022 May 6;20(1):59. doi: 10.1186/s12964-022-00877-5. Cell Commun Signal. 2022. PMID: 35524333 Free PMC article.
-
LSD1 inhibition by tranylcypromine hydrochloride reduces alkali burn-induced corneal neovascularization and ferroptosis by suppressing HIF-1α pathway.Front Pharmacol. 2024 Jul 26;15:1411513. doi: 10.3389/fphar.2024.1411513. eCollection 2024. Front Pharmacol. 2024. PMID: 39130627 Free PMC article.
-
Emerging Strategies in Treating Corneal Alkali Burns: A Narrative Review.Cureus. 2023 Oct 25;15(10):e47662. doi: 10.7759/cureus.47662. eCollection 2023 Oct. Cureus. 2023. PMID: 38021904 Free PMC article. Review.
-
Methylation in cornea and corneal diseases: a systematic review.Cell Death Discov. 2024 Apr 8;10(1):169. doi: 10.1038/s41420-024-01935-2. Cell Death Discov. 2024. PMID: 38589350 Free PMC article. Review.
Cited by
-
Phytic acid-loaded polyvinyl alcohol hydrogel promotes wound healing of injured corneal epithelium through inhibiting ferroptosis.Redox Biol. 2024 Oct;76:103354. doi: 10.1016/j.redox.2024.103354. Epub 2024 Sep 11. Redox Biol. 2024. PMID: 39298836 Free PMC article.
-
Phenylarsine oxide induced corneal injury involves oxidative stress mediated unfolded protein response and ferroptotic cell death: Amelioration by NAC.Free Radic Biol Med. 2023 Nov 20;209(Pt 2):265-281. doi: 10.1016/j.freeradbiomed.2023.10.409. Epub 2023 Oct 30. Free Radic Biol Med. 2023. PMID: 38088264 Free PMC article.
-
Ferroptosis as a Potential Therapeutic Target for Reducing Inflammation and Corneal Scarring in Bacterial Keratitis.Invest Ophthalmol Vis Sci. 2024 Feb 1;65(2):29. doi: 10.1167/iovs.65.2.29. Invest Ophthalmol Vis Sci. 2024. PMID: 38381413 Free PMC article.
-
Urolithin A alleviates cell senescence by inhibiting ferroptosis and enhances corneal epithelial wound healing.Front Med (Lausanne). 2024 Sep 16;11:1441196. doi: 10.3389/fmed.2024.1441196. eCollection 2024. Front Med (Lausanne). 2024. PMID: 39351004 Free PMC article.
-
Effects of Inflammatory Cell Death Caused by Catheter Ablation on Atrial Fibrillation.J Inflamm Res. 2023 Aug 17;16:3491-3508. doi: 10.2147/JIR.S422002. eCollection 2023. J Inflamm Res. 2023. PMID: 37608882 Free PMC article. Review.
References
-
- Sharma N, Kaur M, Agarwal T, Sangwan VS, Vajpayee RB. Treatment of acute ocular chemical burns. Surv Ophthalmol. 2018;63(2):214‐235. - PubMed
-
- Bachmann B, Taylor RS, Cursiefen C. Corneal neovascularization as a risk factor for graft failure and rejection after keratoplasty: an evidence‐based meta‐analysis. Ophthalmology. 2010;117(7):1300‐1305 e1307. - PubMed
-
- Dave RS, Goostrey TC, Ziolkowska M, Czerny‐Holownia S, Hoare T, Sheardown H. Ocular drug delivery to the anterior segment using nanocarriers: a mucoadhesive/mucopenetrative perspective. J Control Release. 2021;336:71‐88. - PubMed
-
- Singh M, Bharadwaj S, Lee KE, Kang SG. Therapeutic nanoemulsions in ophthalmic drug administration: concept in formulations and characterization techniques for ocular drug delivery. J Control Release. 2020;328:895‐916. - PubMed
LinkOut - more resources
Full Text Sources
