. 2022 May 20;8(20):eabm2091.
doi: 10.1126/sciadv.abm2091. Epub 2022 May 20.

Touch signaling and thigmomorphogenesis are regulated by complementary CAMTA3- and JA-dependent pathways

Affiliations

Touch signaling and thigmomorphogenesis are regulated by complementary CAMTA3- and JA-dependent pathways

Essam Darwish et al. Sci Adv. .

Abstract

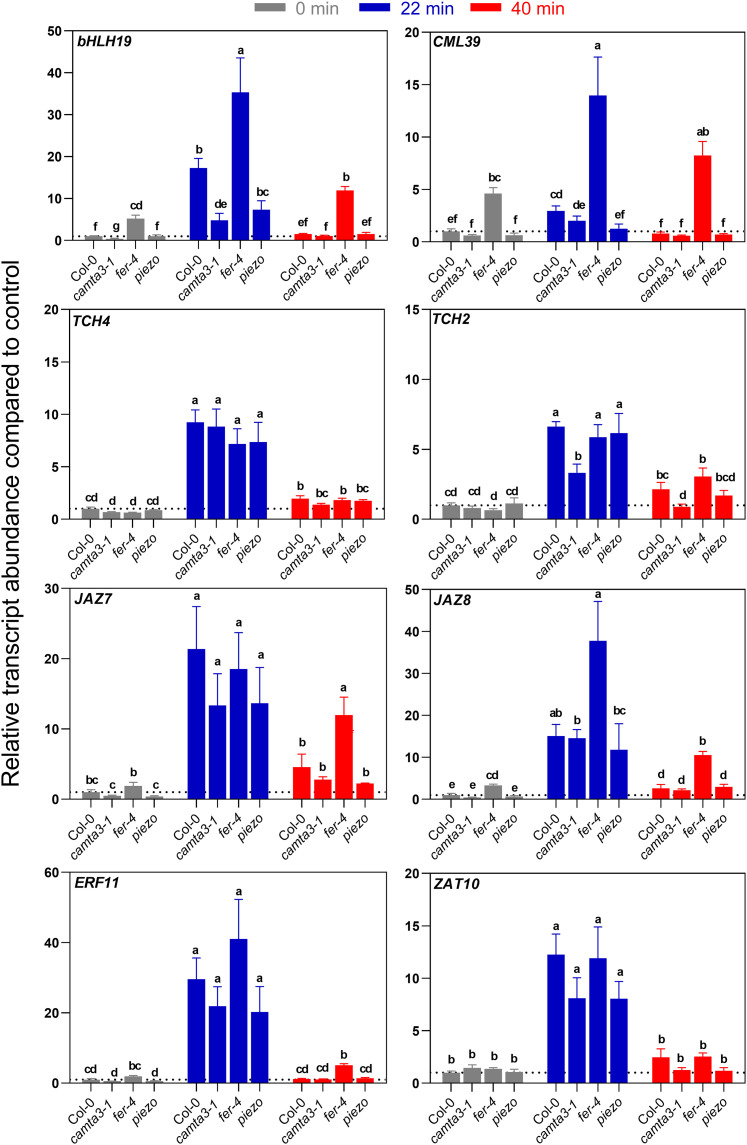
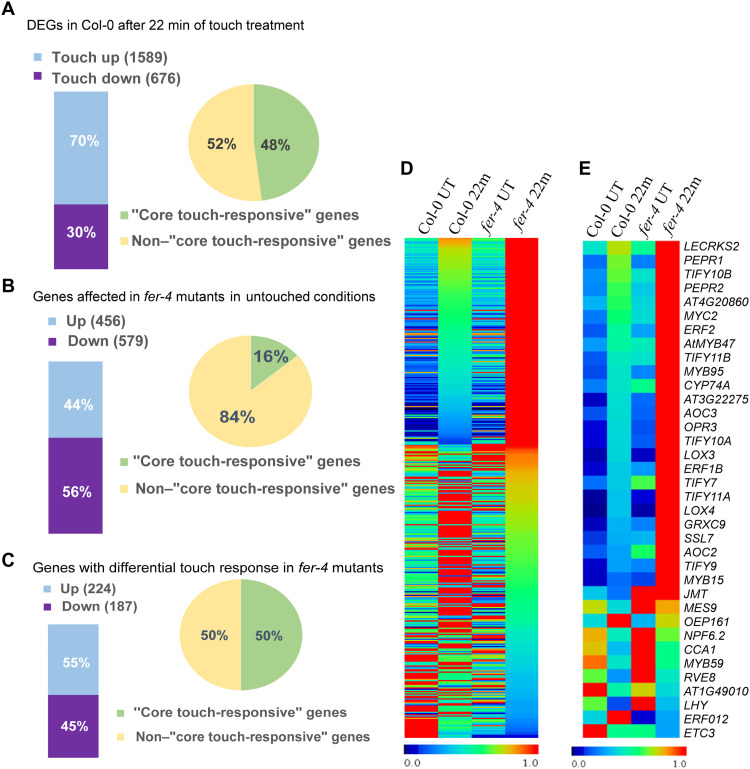
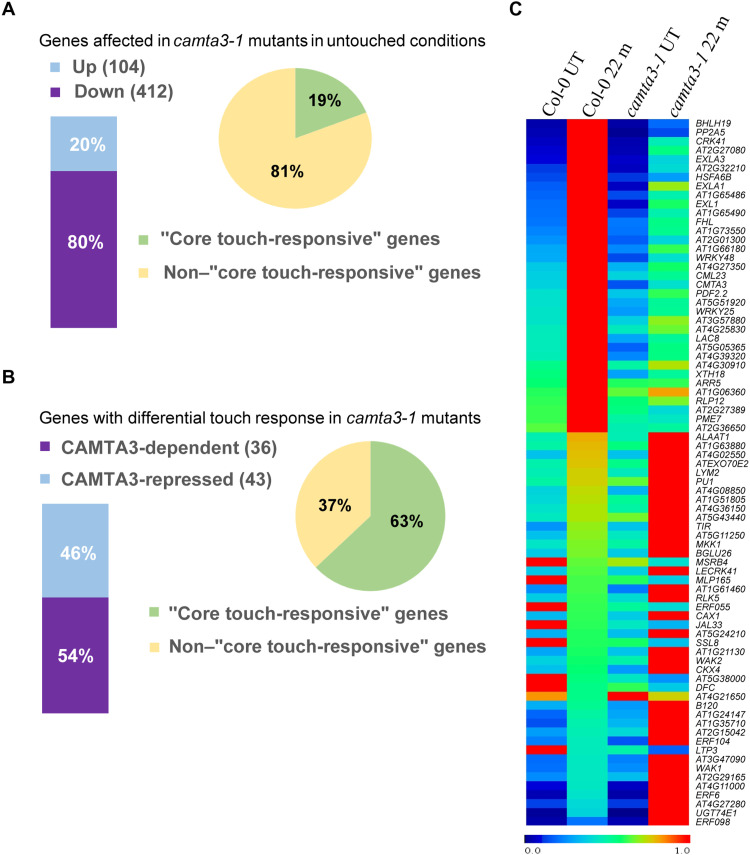
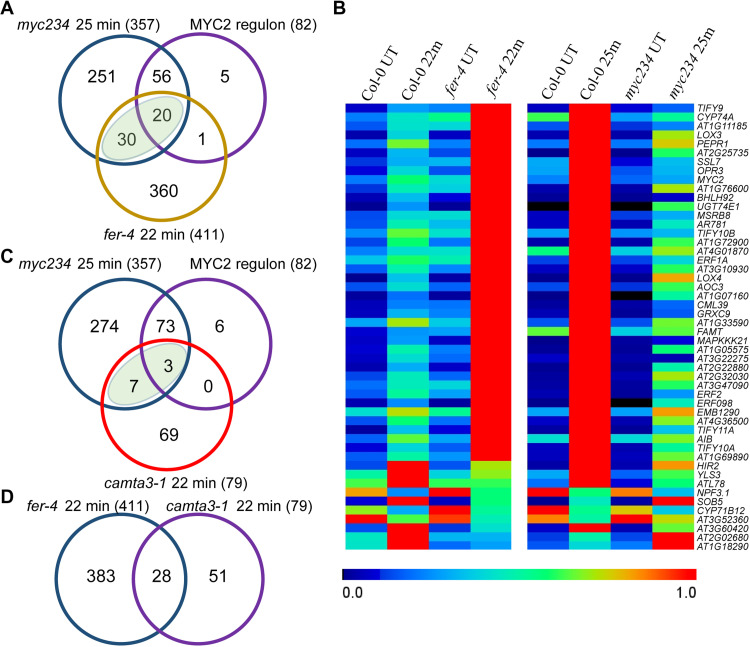
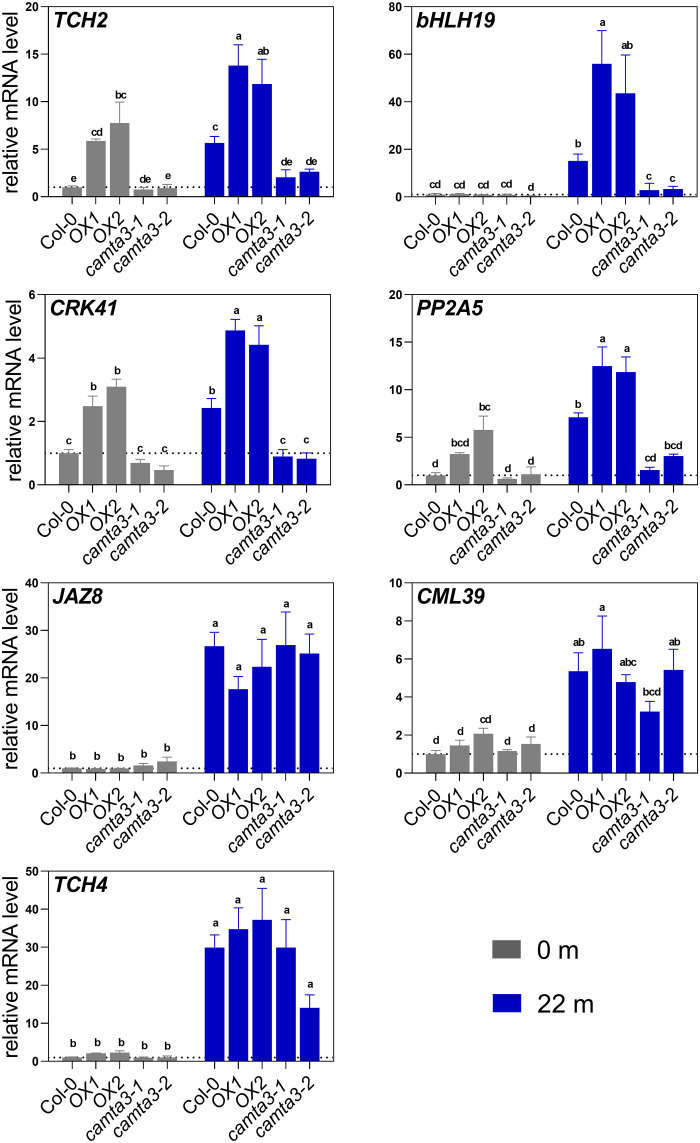
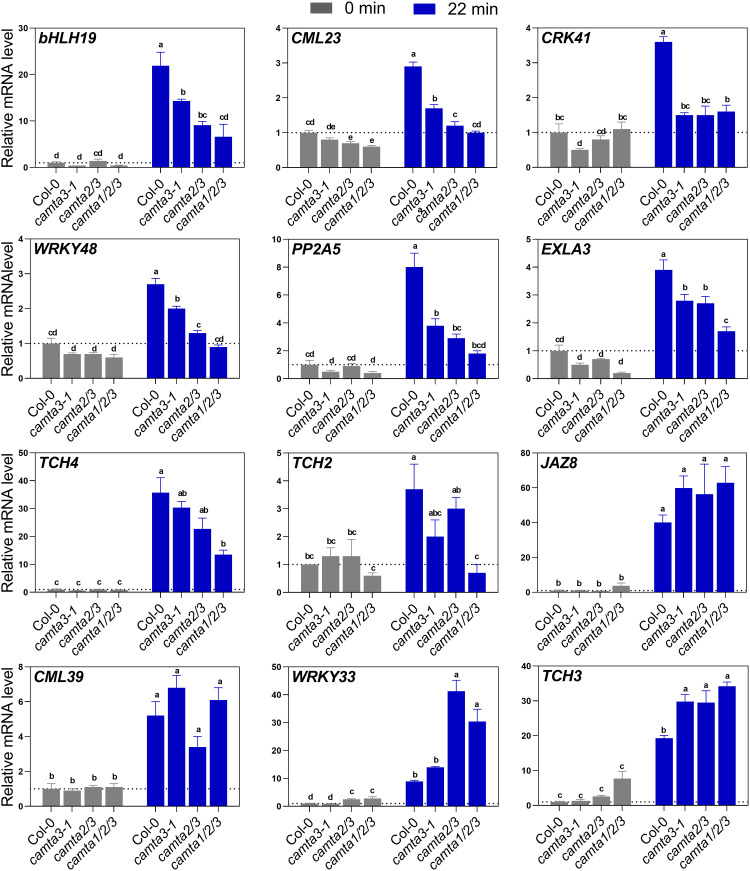
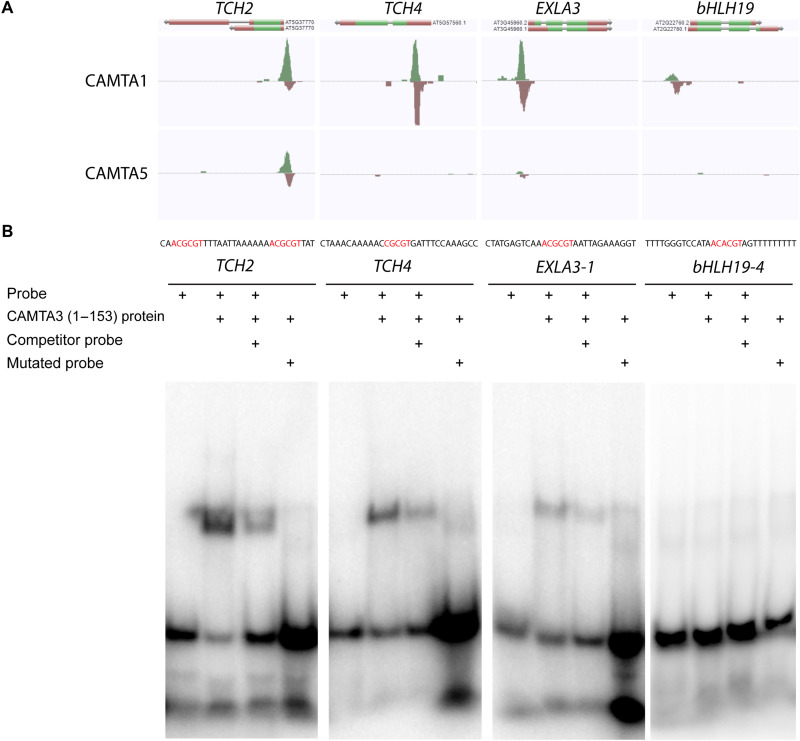
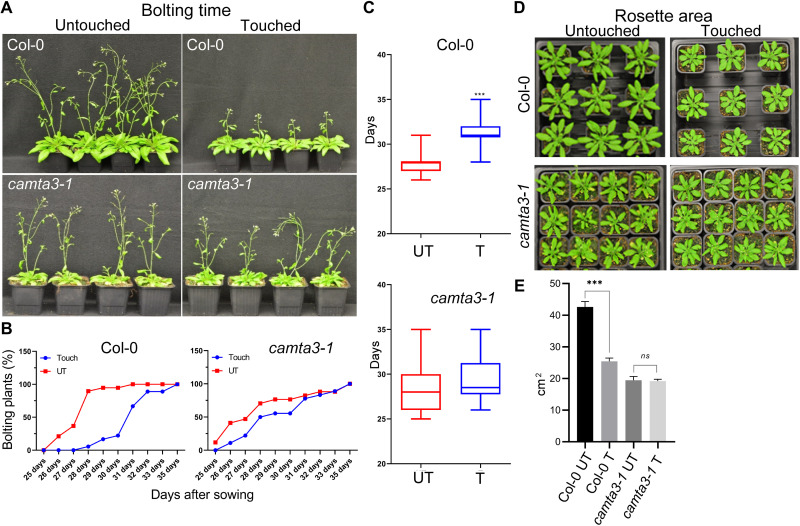
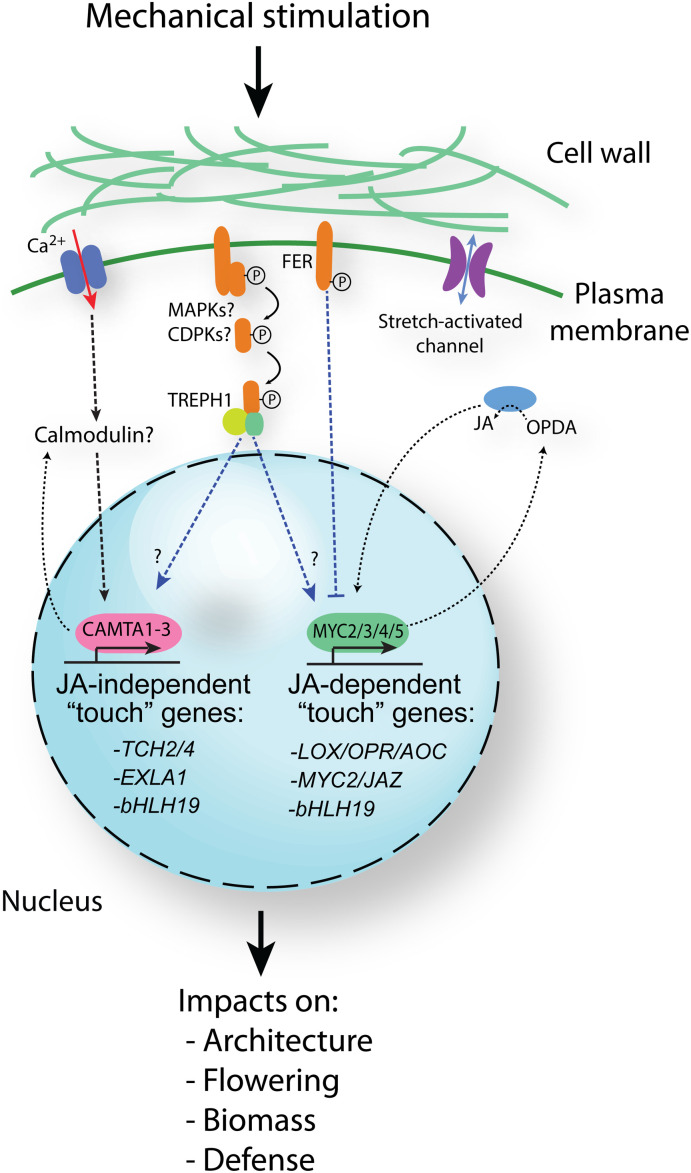
Plants respond to mechanical stimuli to direct their growth and counteract environmental threats. Mechanical stimulation triggers rapid gene expression changes and affects plant appearance (thigmomorphogenesis) and flowering. Previous studies reported the importance of jasmonic acid (JA) in touch signaling. Here, we used reverse genetics to further characterize the molecular mechanisms underlying touch signaling. We show that Piezo mechanosensitive ion channels have no major role in touch-induced gene expression and thigmomorphogenesis. In contrast, the receptor-like kinase Feronia acts as a strong negative regulator of the JA-dependent branch of touch signaling. Last, we show that calmodulin-binding transcriptional activators CAMTA1/2/3 are key regulators of JA-independent touch signaling. CAMTA1/2/3 cooperate to directly bind the promoters and activate gene expression of JA-independent touch marker genes like TCH2 and TCH4. In agreement, camta3 mutants show a near complete loss of thigmomorphogenesis and touch-induced delay of flowering. In conclusion, we have now identified key regulators of two independent touch-signaling pathways.


Figures

Fig. 1.
Fig. 1.. qPCR analysis of selected touch-responsive genes in seedlings of Col-0, camta3-1, fer-4, and piezo mutants 0, 22, and 40 min after gentle brushing.
The y axis represents fold inductions relative to 0-min Col-0 value (set to 1). Error bars designate SEM (n = 5). Statistical significance was determined by two-way analysis of variance (ANOVA) followed by post hoc Tukey tests (letters show significant difference between all samples at P < 0.05).
Fig. 2.
Fig. 2.. The fer-4–dependent touch-transcriptome.
(A) DEGs in Col-0 after 22 min of touch treatment. Of 2265 genes differentially expressed in Col-0 after 22 min of touch treatment, 70% of these genes were up-regulated and 48% are core touch-responsive genes (B) Genes affected in fer-4 mutants under untouched conditions. Of 1035 DEGs in fer-4 mutant versus Col-0 (untouched conditions), 56% showed less accumulation and 16% were core touch-responsive genes. (C) Genes with differential touch response in fer-4 mutants. Of 2265 genes differentially expressed in Col-0 after 22 min of touch treatment, Expression of 411 genes showed significant difference in fer-4 22 min versus Col-0 22 min. A total of 50% of those genes were core touch-responsive genes and 55% showed more induction in fer-4 mutants. (D) Heatmap of all 411 fer-4–dependent touch-responsive transcripts. (E) Heatmap of selected fer-4–dependent transcripts related to JA signaling and biosynthesis. Gene expression values were normalized per gene, with 1 indicating the highest expression level. Normalization between 0 and 1 was performed within each dataset (Col-0 versus fer-4). UT, untouched.
Fig. 3.
Fig. 3.. The camta3-1–dependent touch transcriptome.
(A) Genes affected in camta3-1 mutants under untouched conditions. Of 516 DEGs in camta3 under untouched conditions, 80% showed less accumulation and 19% was core touch-responsive genes. (B) Genes with differential touch response in camta3-1 mutants. Expression of 79 genes showed significant difference in camta3-1 mutants, 63% of these genes were core touch-responsive genes and 54% showed less induction in camta3-1 mutants. (C) Heatmap of all 79 camta3-1–dependent touch-responsive transcripts. Gene expression values were normalized per gene, with 1 indicating the highest expression level. Normalization between 0 and 1 was performed within each dataset (Col-0 versus camta3-1).
Fig. 4.
Fig. 4.. Comparison of touch transcriptomes of myc2 myc3 myc4 with fer-4 and camta3-1.
(A) Venn diagrams showing overlaps between genes with differential touch response in fer-4 (411) and myc234 (357) mutants, and 82 genes defined as part of the MYC2-regulon. (B) Heatmap representing the transcript accumulation of the common 50 genes in fer-4 and myc234 mutants. Gene expression values were normalized per gene, with 1 indicating the highest expression level. Normalization between 0 and 1 was performed within each dataset (Col-0 versus fer-4 and Col-0 versus myc2 myc3 myc4). (C) Venn diagrams showing overlaps between genes with differential touch response in camta3-1 (79) and myc234 (357) mutants, and 82 genes defined as part of the MYC2-regulon. (D) Venn diagrams showing overlaps between genes with differential touch response in fer-4 (411) and camta3-1 (79) mutants.
Fig. 5.
Fig. 5.. qPCR analysis of selected touch-responsive genes in CAMTA3 overexpression (OX) and T-DNA mutants at 0 and 22 min after gentle brushing.
The y axis represents fold inductions relative to untouched (0 min) Col-0 value (set to 1). Error bars designate SEM (n = 3 to 4). Statistical significance was determined by two-way ANOVA followed by post hoc Tukey tests (letters show significant difference between all samples at P < 0.05).
Fig. 6.
Fig. 6.. qPCR analysis of selected touch-responsive genes in seedlings of Col-0, camta3-1, camta2/3, and camta1/2/3 at 0 and 22 min after gentle brushing.
The y axis represents fold inductions relative to untouched (0 min) Col-0 value (set to 1). Error bars designate SEM (n = 3 to 4). Statistical significance was determined by two-way ANOVA followed by post hoc Tukey tests (letters show significant difference between all samples at P < 0.05).
Fig. 7.
Fig. 7.. CAMTA transcription factors bind directly to touch-induced promoters.
(A) DAP-seq analysis showing direct binding of CAMTA1 and/or CAMTA5 to the promoter regions of selected target genes. Peak heights are relative to number of reads mapped to a position. (B) EMSAs of CAMTA3 (1–153) to probes designed against specific regions of the indicated promoters. The sequences show 30 bp of the 40-bp probes; regions in red indicate CGCGT-related CAMTA3 binding sites, which were mutated in the mutated probes. Unlabeled excess competitor probe was added to outcompete CAMTA3 (1–153) binding to the radiolabeled probe.
Fig. 8.
Fig. 8.. Camta3 mutants show a loss of thigmomorphogenesis.
(A) Bolting time of camta3-1 mutant and the wild type in response to 18 days twice-daily touch treatment. (B) Line graphs show the percentage of bolting plants over the growth period (days after sowing). (C) Box and whisker plots show the comparison of average bolting day between the control group and the touched group. (D) Rosette size in camta3-1 mutants and the wild type after 18 days of twice-daily touch treatment. (E) Bar graph showing the significant reduction of Col-0 rosette area after touch treatment; no significant reduction in rosette size of camta3-1 mutants after touch treatment was observed. Means ± SE are shown. Statistical analysis was performed by a Student’s t test. The *** and n.s. represent P < 0.001 and P > 0.05, respectively.
Fig. 9.
Fig. 9.. A model of touch-induced gene expression pathways.
Mechanical stimulation results in physical deformation of the cell wall and plasma membrane. Several plasma membrane–associated proteins are important in regulation of downstream signaling and gene expression. Mechanically activated Ca2+ channels allow influx of Ca2+ ions from the apoplast to the intracellular space. Ca2+ may be captured by calmodulins, which, in turn, may modulate the activity of downstream regulators such as the transcription factors CAMTA1-3. Next, CAMTA1-3 activate the expression of JA-independent touch-responsive genes, e.g., cell wall modifiers (EXLA1/3 and TCH4) and other calmodulins (TCH2/3 and CML23), potentially acting as a positive feedback loop. Simultaneously, mechanical stimulation also results in activation of a JA-dependent signaling pathway mediated by MYC2/3/4/5 transcription factors, activating downstream genes involved in defense and JA biosynthesis [such as 13-lipoxygenases (LOX), 12-oxophytodienoic acid (OPDA) reductases, and allene oxide cyclases], also acting as a positive feedback loop. Kinases such as calcium-dependent protein kinases (CDPKs) and mitogen-activated protein kinases (MAPKs) are likely involved in mediating signaling from, e.g., the plasma membrane to downstream regulators such as TREPH1 and transcription factors. Feronia (FER) receptor–like kinase negatively regulates excessive JA-dependent touch signaling, likely by inhibitory phosphorylation of MYC2/3/4/5. FER may also regulate part of the touch response independently of JA/MYC2 pathways. Some overlap between the JA-dependent and JA-independent signaling pathways also occurs, as, for instance, bHLH19 requires both pathways to be fully touch-induced. Collectively, all these changes can translate into various thigmomorphogenic and defense-related responses.

Similar articles

Cited by

References

    1. Braam J., In touch: Plant responses to mechanical stimuli. New Phytol. 165, 373–389 (2005). - PubMed
    1. Zhou L. H., Liu S. B., Wang P. F., Lu T. J., Xu F., Genin G. M., Pickard B. G., The Arabidopsis trichome is an active mechanosensory switch. Plant Cell Environ. 40, 611–621 (2017). - PubMed
    1. Jaffe M. J., Thigmomorphogenesis: The response of plant growth and development to mechanical stimulation: With special reference to Bryonia dioica. Planta 114, 143–157 (1973). - PubMed
    1. Si T., Wang X., Huang M., Cai J., Zhou Q., Dai T., Jiang D., Double benefits of mechanical wounding in enhancing chilling tolerance and lodging resistance in wheat plants. Plant Biol. (Stuttg.) 21, 813–824 (2019). - PubMed
    1. Tateno M., Increase in lodging safety factor of thigmomorphogenically dwarfed shoots of mulberry tree. Physiol. Plant. 81, 239–243 (1991).