. 2022 May 19;5(1):480.
doi: 10.1038/s42003-022-03387-9.

Human M1 macrophages express unique innate immune response genes after mycobacterial infection to defend against tuberculosis

Affiliations

Human M1 macrophages express unique innate immune response genes after mycobacterial infection to defend against tuberculosis

Arshad Khan et al. Commun Biol. .

Abstract

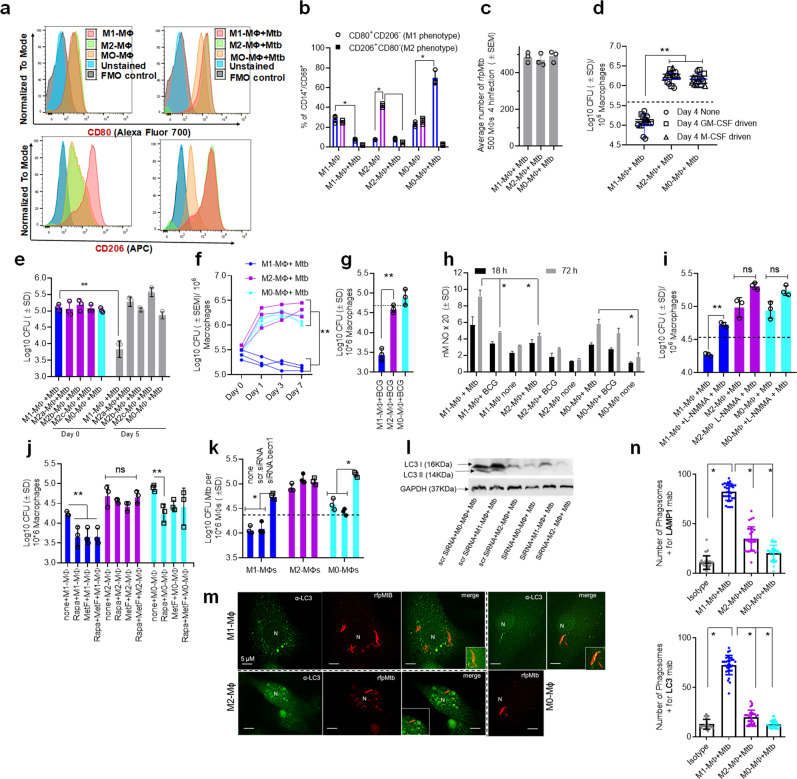
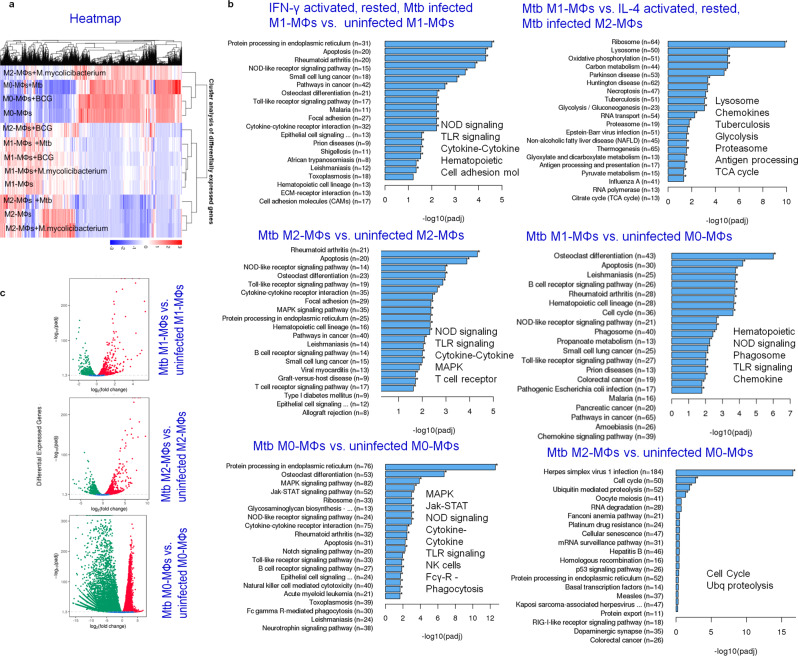
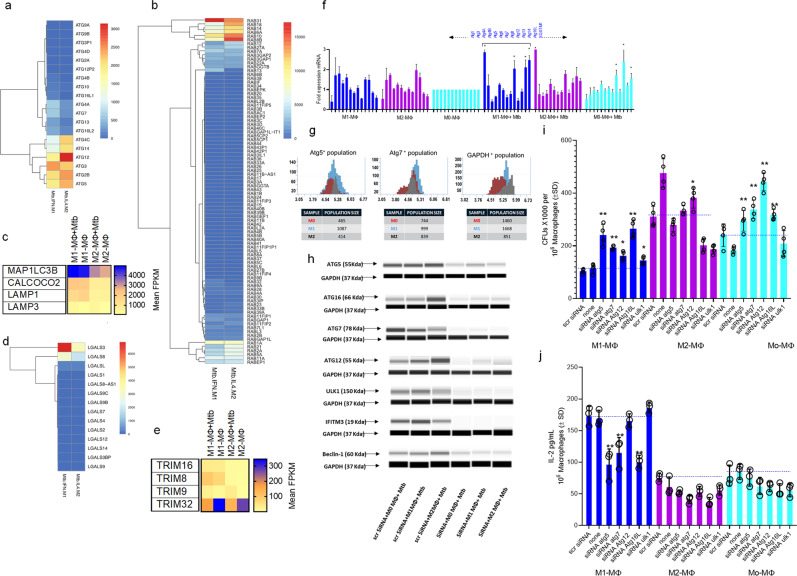
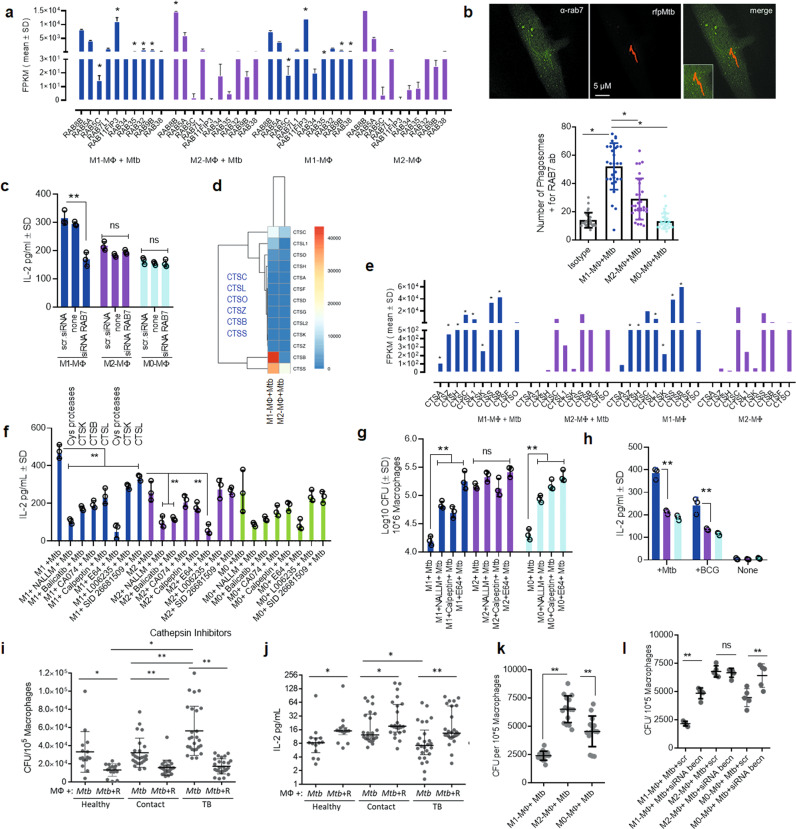
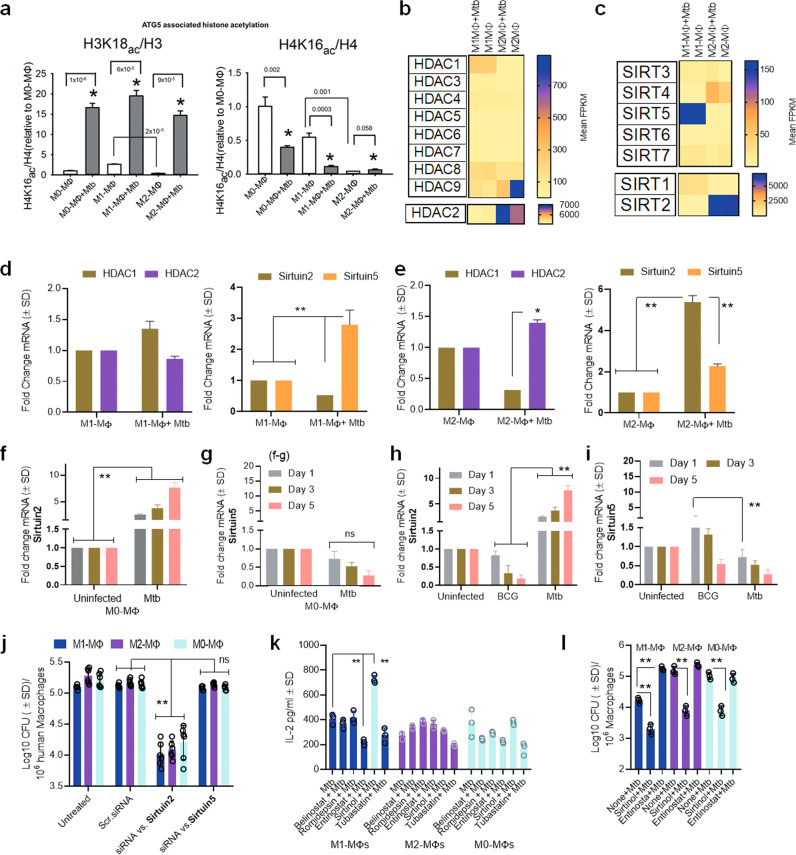
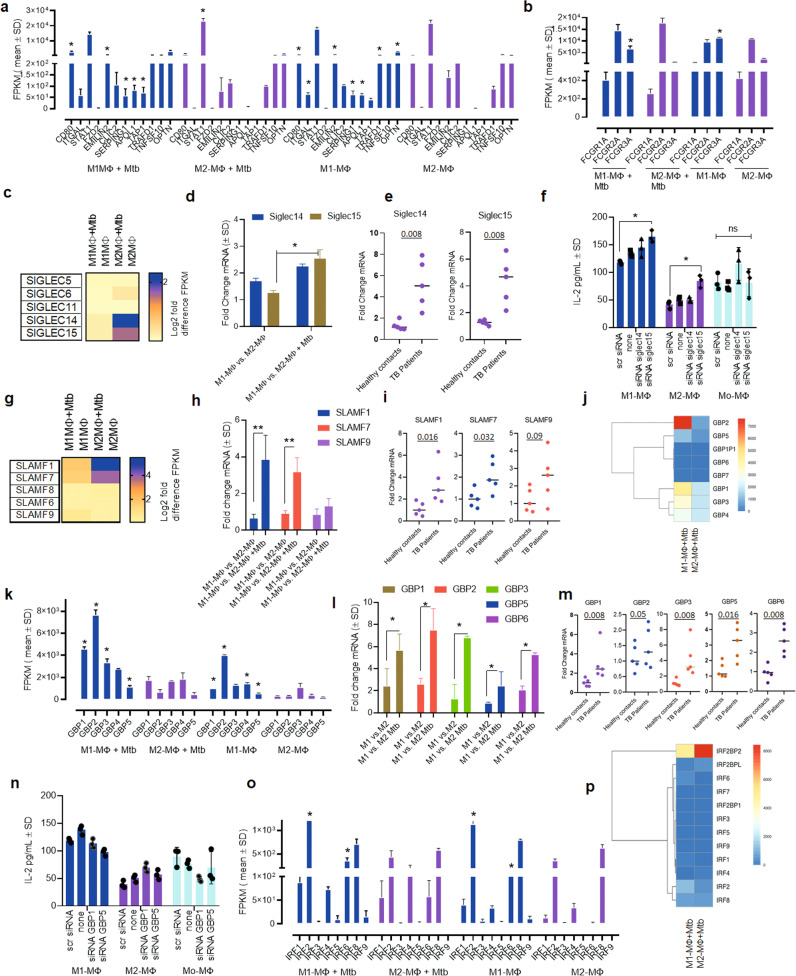
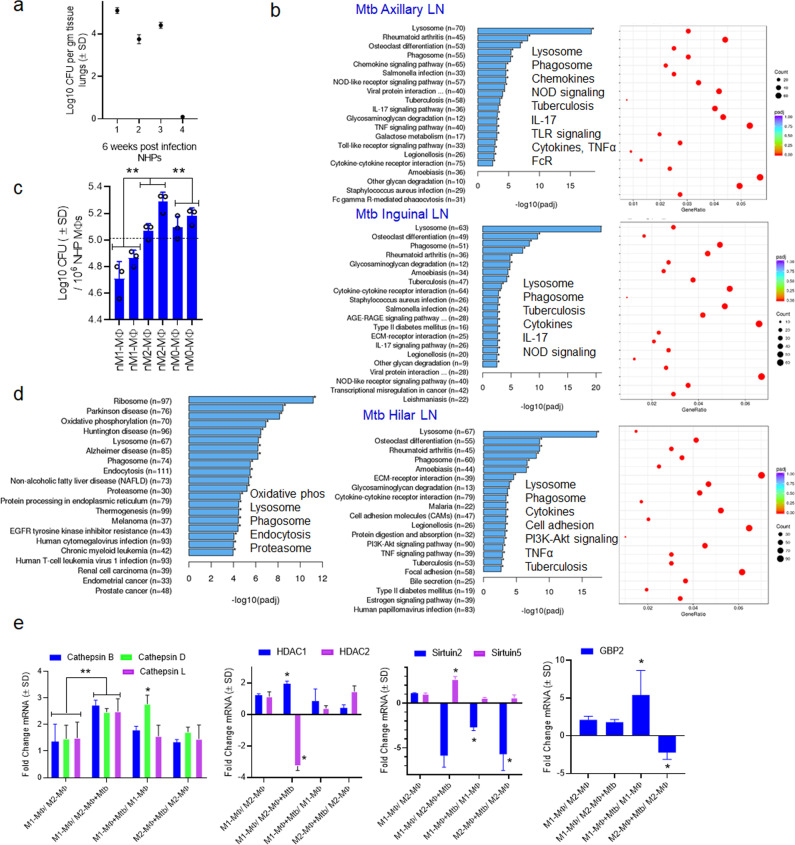
Mycobacterium tuberculosis (Mtb) is responsible for approximately 1.5 million deaths each year. Though 10% of patients develop tuberculosis (TB) after infection, 90% of these infections are latent. Further, mice are nearly uniformly susceptible to Mtb but their M1-polarized macrophages (M1-MΦs) can inhibit Mtb in vitro, suggesting that M1-MΦs may be able to regulate anti-TB immunity. We sought to determine whether human MΦ heterogeneity contributes to TB immunity. Here we show that IFN-γ-programmed M1-MΦs degrade Mtb through increased expression of innate immunity regulatory genes (Inregs). In contrast, IL-4-programmed M2-polarized MΦs (M2-MΦs) are permissive for Mtb proliferation and exhibit reduced Inregs expression. M1-MΦs and M2-MΦs express pro- and anti-inflammatory cytokine-chemokines, respectively, and M1-MΦs show nitric oxide and autophagy-dependent degradation of Mtb, leading to increased antigen presentation to T cells through an ATG-RAB7-cathepsin pathway. Despite Mtb infection, M1-MΦs show increased histone acetylation at the ATG5 promoter and pro-autophagy phenotypes, while increased histone deacetylases lead to decreased autophagy in M2-MΦs. Finally, Mtb-infected neonatal macaques express human Inregs in their lymph nodes and macrophages, suggesting that M1 and M2 phenotypes can mediate immunity to TB in both humans and macaques. We conclude that human MФ subsets show unique patterns of gene expression that enable differential control of TB after infection. These genes could serve as targets for diagnosis and immunotherapy of TB.


Conflict of interest statement

The authors declare no conflict of interest and certify that all studies were conducted under approved institutional Health Science Center and Institutional review board protocols.

Figures

Fig. 1
Fig. 1. Human umbilical cord and peripheral blood-derived macrophages show heterogeneity in mycobacterial killing associated with oxidants and autophagy.
Human cord blood (CBM) or healthy donor PBMC-derived MФs were cultured in the presence of either recombinant human IFN-γ (M1; 10 ng/mL) or human IL-4 (M2; 10 ng/mL) for 5 days and rested for 2 days. Untreated cells were M0-MФs. a, b Surface expression of receptors by CBM-derived naïve and Mycobacterium tuberculosis (Mtb; H37Rv)-infected M1- (CD80+/CD206) and M2-MФs (CD80/CD206+) on day 3 using flow cytometry and quantitation (*p < 0.01 t test); gating strategy shown Supplemental Fig. 1. c CBM-derived differentiated MФs were infected with Mtb for 4 h followed by microscopic counts of rfp-labeled MtbH37Rv to determine uptake verified using CFU counts. d PBMC-derived MФs from five healthy donors were differentiated using the indicated cytokines followed by infection with Mtb and CFU assay on day 4. Each point represents one donor (**p < 0.05; Kruskal–Wallis test). e PBMC-derived MФs were differentiated using GM-CSF (M1), IL-4 (M2a), IL-1β M2b), IL-10 (M2c) or left intreated (M0) followed by Mtb infection and CFU assay on day 4 (**p < 0.007). f CBM-derived, cytokine differentiated MФs were infected with Mtb followed by CFU assay over time (**p < 0.006; data from 3 experiments shown). g CBM-derived, differentiated MФs were infected with M. bovis BCG followed by CFU assay on day 4 (**p < 0.005). h CBM-derived and differentiated uninfected MФs or those infected with Mtb or BCG were incubated and at indicated time points, cultures were tested for nitrite using diaminofluorescein diacetate and fluorometry (*,**p < 0.005, t test). QPCR for mRNA of iNOS and protein are shown in Supplemental Fig. 3a and reactive oxygen species levels in Supplementary Fig. 3b. i MФs infected with Mtb as in panel h were incubated in NMMA (0.5 mM; N-monomethyl l-arginine) followed by CFU assay on day 3 (**p < 0.009). j CBM-derived, differentiated MФs infected with Mtb were incubated with 10 µM Rapamycin, 100 µM Metformin or their combination followed by CFU assay on day 3 (**p < 0.009). k CBM-derived, M1-, M2- and M0-MΦs were treated in the presence or absence of siRNA vs. beclin1 (ATG6) or its scrambled control followed by infection with Mtb and CFU counts on day 3 (*p < 0.007). Blot validation of Knockout using siRNA vs. beclin1 (ATG6) is shown in Fig. 3h. l MΦ lysates of panel k collected at 18 h were analyzed using western blots for the lipidation of microtubule-associated light chain 3 (LC3). Lipidation is indicated by LC3-II. m CBM-derived MΦs were infected with rfpMtbH37Rv and stained for an LC3 autophagy marker or LAMP1 lysosome marker using specific antibodies, Alex-Fluor485 conjugates, and imaged using confocal microscopy. Panels illustrate LC3 colocalization; LAMP1 stains using gfpMtbH37Rv is shown in Supplementary Fig. 3c. n Quantification of phagosomes colocalizing with LC3 are shown using an N90 Nikon fluorescence microscope (IF) and Metaview software (*p < 0.004, t test). For panels (bcefghibkn), p-values were calculated using a one-way ANOVA with Tukey’s post-hoc test; one of 2–3 similar experiments shown. CFU or IL-2 assays had triplicate wells plated per group or donor. Panels (d, g, ik) horizontal dotted lines indicate day 0 CFU (4 h post-infection CFU). All Mtb CFU experiments used MOI of 1.
Fig. 2
Fig. 2. Mycobacterium tuberculosis (Mtb) induces differential expression of innate immunity regulating genes (Inregs) in human M1- and M2-MФs.
CBM-derived uninfected M0-, M1- and M2-MΦs or those infected separately with Mtb H37Rv, BCG or Mycolicibacterium smegmatis were analyzed using RNAseq (Novogene Inc., USA) at 18 h (MOI of 1; n = 2 samples per group; analysis done twice). a Heat maps highlight Mtb-induced differential gene expression. BCG and M. smegmatis profiles are included but not highlighted. b Kyoto Encyclopedia of Genes and Genomes profiles of Mtb-infected M1-, M2- and M0-MΦs vs. uninfected MΦs show differential enrichment of Inregs and pathways in the context of TB control (*p-values < 0.00001; Clusterprofiler workflow). Only gene clusters showing a significant p-value (<0.00001) are highlighted. c Volcano plots indicate the Mtb-induced differential gene expression. Additional gene expression profiles and Clusterprofiler pathway analysis are shown in Supplementary Figs. 4–7. RNAseq and pathway analysis by Novogene is illustrated in Supplementary Fig. 13. All Mtb CFU experiments used MOI of 1.
Fig. 3
Fig. 3. Mtb-infected human M1-, M2-, and M0-MΦs show differential expression of autophagy-regulating ATGs, RAB GTPases, Galectins (LGALS) and Tripartite-containing motif protein (TRIM) encoding accessory genes.
ae CBM-derived M1-, M2-, and M0-MΦs were subjected to RNAseq before and after Mtb infection as in Fig. 2 at 18 h post Mtb infection. Data are shown for M1- vs. M2-MΦs and transcripts are shown as FPKMs (fragments per kilobase per million reads) for gene clusters (n = 2). f Quantitative PCR analysis for autophagy-regulating genes (ATGs) at 18 h (Mtb-infected vs. naive; *p < 0.01, t test, n = 2; one of 2 similar experiments). g Single cells of uninfected M1-, M2-, and M0-MΦs were dispensed into the wells of the MILO single-cell protein profiler. ATG5 and ATG7 proteins with a GAPDH control were detected using specific antibodies and in situ western blot; quantitation of the number of MΦs expressing proteins are shown. h Mtb-infected or naïve M1-, M2-, and M0-MΦs were analyzed for ATG proteins before and after siRNA knockdown including beclin1 (ATG6) (Origene, USA) (one of 2 similar experiments shown). Densitometry is shown in Supplementary Fig. 8. i Indicated ATGs were knocked down using specific duplexes of siRNA (Origene, USA), followed by infection with Mtb and CFU counts on day 3 maintaining >90% viability of MΦs. Baseline CFUs of scrambled siRNA controls are shown by a dotted line (one of 3 experiments shown). j siRNA or scrambled siRNA treated replicates of MΦs from panel i were overlaid with an Ag85B-derived epitope-specific F9A6-CD4 T cell line for antigen presentation. IL-2 was measured in supernatants using sandwich enzyme-linked immunoassay at 18 h (one of 2 independent experiments shown). Baseline antigen presentation by scrambled siRNA controls is shown by a dotted line. Panels (i, j): **p < 0.007; *p < 0.009 one-way ANOVA with Tukey’s test. All Mtb CFU experiments used MOI of 1.
Fig. 4
Fig. 4. Mtb infection induces differential expression of RAB GTPases and cathepsin proteases in human macrophages affecting autophagy-dependent ex vivo antigen presentation to CD4 T cells.
a Differential expression of RAB GTPases and transcripts are shown as FPKMs (fragments per kilobase per million reads) for duplicate samples; *p < 0.01; t test. b MΦs were infected with rfpMtb, followed by staining with an isotype or specific antibodies to RAB7 or LAMP1 proteins and counterstained using fluorescein isothiocyanate anti-IgG conjugates. Confocal microscopy analysis of phagosomes colocalizing with RAB7 is illustrated (full panels shown in Supplementary Fig. 3c); bar graph indicates quantitation of RAB7 colocalization (*p < 0.009; t test; one of 2 similar experiments shown). c MΦs indicated were treated with siRNA for RAB7 or its scrambled control followed by Mtb infection and overlay with F9A6-CD4 T cell line for antigen presentation and IL-2 assay (**p < 0.009; t test; one of 2 similar experiments shown). d, e Differential gene expression of cathepsins (CTS) expressed as FPKMs shown for duplicate samples (*p < 0.01; t test). f MΦs indicated were treated with non-cytotoxic doses of either CTS specific inhibitors or pan-specific inhibitors followed by Mtb infection and antigen presentation using F9A6-CD4 T cells (**p < 0.009, t test; one of 2 similar experiments shown). g MΦs treated with CTS inhibitors were infected with Mtb followed by CFU assay on day 5, maintaining >90% viability of MΦs (**p < 0.009, one-way ANOVA with Tukey’s post-hoc test; one of 2 similar experiments shown). h Replicates of MΦs used in panel (g) were infected using Mtb or BCG and supernatants collected at 18 h were tested for IL-2 and antigen presentation (**p < 0.009; t test). i PBMC-derived macrophages from healthy donors, household contacts, and TB patients (TB) were treated or not treated with Rapamycin (10 µM) followed by infection with Mtb and CFU counts on day 3 in vitro. j Washed Mtb-infected MΦs (as in panel i) were overlaid with F9A6-CD4 T cells for antigen presentation with or without Rapamycin and IL-2 assay. Horizontal bars indicate median (interquartile range) for IL-2 (non-normal distribution) or mean (SD) for CFUs (*p < 0.05; **p < 0.001. Wilcoxon paired ranked signed test, and Kruskal-Wallis test). k Healthy adult donor MΦs from the TB endemic area differentiated into M1-, M2-, or M0-MΦs were infected with Mtb followed by CFU counts on day 3 (**p < 0.01; Kruskal–Wallis test). l Five donor MΦs from each group of panel k were treated with siRNA vs. beclin1 or its scrambled control, followed by infection with Mtb and CFU counts on day 3 (**p < 0.009, Kruskal-Wallis test; triplicate wells per donor; one of 2 similar experiments shown). All Mtb CFU experiments used MOI of 1.
Fig. 5
Fig. 5. Mtb-infected human M1- and M2-MФs show differential epigenetic programming affecting autophagy through histone acetylation of ATG5.
a H3K18 acetylation and H4K16 acetylation on the promoter of ATG5 in M0, M1-, and M2-MΦs and their Mtb-infected counterparts (one of 2 similar experiments shown; p using one-way ANOVA). b, c RNAseq gene expression of histone deacetylases (HDACs) and Sirtuins in naïve or Mtb-infected M1-, and M2-MΦs at 18 h. Transcripts are shown as FPKMs (fragments per kilobase per million reads) for duplicate samples. d QPCR analysis of mRNA for HDAC and Sirtuins indicated in M1-MΦs at 18 h (**p < 0.01 t test; n = 2). e QPCR analysis of mRNA for HDAC and Sirtuins in M2-MΦs at 18 h (*, **p < 0.01 t test; n = 2). Densitometry of proteins using western blot shown in Supplementary Fig. 15. f, g Mtb-infected M0-MΦs were incubated for days indicated and mRNA of Srtuin2 and Sirtuin5 quantitated using qPCR (**p < 0.01 t test; n = 2). h, i M0-MΦs were infected with either BCG vaccine or Mtb followed by QPCR analysis of mRNA of Sirtuin2 and Sirtuin5 on indicated days (**p < 0.01 t test; n = 2). j MΦs were treated with siRNA vs. Sirtuins or their scrambled control followed by Mtb CFU assays on day 3 (**p < 0.006, one-way ANOVA with Tukey’s posttest; one of 2 similar experiments shown). k Mtb-infected M1- and M2-MΦs were incubated with HDAC inhibitors (Belinostat; Romidepsin; Entinostat; Tubastatin; 20 µM each) and the Sirtuin-2 inhibitor sirtinol (130 µM), followed by antigen presentation using HLA-DR1-specific F9A6-CD4 T cells (**p < 0.007, t test; one of 2 similar experiments shown). l MΦs were incubated with Sirtuin2 specific inhibitor sirtinol (130 µM), or the HDAC inhibitor Entinostat (20 µM), followed by Mtb infection and CFU counts on day 5 maintaining >90% viability of MΦs (**p < 0.009, one-way ANOVA with Tukey’s posttest). For all panels one of 2 similar experiments shown). All Mtb or BCG CFU experiments used MOI of 1.
Fig. 6
Fig. 6. Mtb infection induces Inregs in human M1- and M2-MФs associated with anti-mycobacterial immunity.
a, b Mtb-infected and naive M1-, and M2-MΦs show RNAseq-derived differential gene expression for biomarkers at 18 h. Transcripts are shown as FPKMs (fragments per kilobase per million reads. (FPKMs shown; n = 2; *p < 0.01 t test). cf Mtb-infected M1- and M2-MΦs differentially express transcripts (FPKMs) for Sialic Acid Binding Immunoglobin like Lectins (Siglecs). c RNAseq-derived differential gene expression; Log2-fold gene expression. d QPCR of mRNA for Siglec-14/15 in Mtb-infected M1- vs. M2-MΦs at 18 h (duplicate sample per assay; 2 similar experiments; *p < 0.01, t test). e QPCR of mRNA in the PBMCs of children with TB (n = 5) and their household contacts at 18 h (n = 5). f siRNA knockdown of Siglec-14/15 in Mtb-infected M1-, M2, and M0-MΦs followed by antigen presentation to F9A6-CD4 T cells. (triplicate wells per assay; 2 similar experiments; *p < 0.009, t test). gi Differential gene expression for Signaling Lymphocyte Activation Molecule family (SLAMF). g RNAseq- derived differential gene expression; Log2-fold gene expression. h QPCR of mRNA in M1- and M2-MΦs at 18 h (duplicate sample per assay; 2 similar experiments; *p < 0.01, t test). i QPCR in the PBMCs of children with TB and their household contacts. jm Differential gene expression for Guanylate-binding proteins (GBPs) in M1- and M2-MΦs. j, k RNAseq- derived differential gene expression (l) QPCR of mRNA in Mtb-infected or naïve M1 and M2-MΦs at 18 h (duplicate sample per assay; 2 similar experiments; *p < 0.01, t test). m QPCR of mRNA in the PBMCs of children with TB and their household contacts (*p < 0.01, t test). n siRNA knockdown of indicated GBPs in M1-, M2, and M0-MΦs followed by antigen presentation to F9A6-CD4 T cells. (triplicate wells per assay; 2 similar experiments; *p < 0.009, t test). op RNAseq-derived differential gene expression for Interferon Regulatory Factors (IRFs) in Mtb-infected or naïve M1- and M2-MΦs at 18 h. For panels (a, b, k, o) FPKMs of Mtb-infected vs. naïve were compared (*< 0.01 t test; n = 2). All Mtb infections used MOI of 1. Both RNAseq and QPCR analysis done at 18 h post Mtb infection.
Fig. 7
Fig. 7. Inreg clusters expressed by Mtb-infected human M1- and M2-MФs are found in the lymph nodes and macrophage transcriptome of Mtb-infected neonatal rhesus macaques.
a Six-week-old rhesus macaques were aerosol-infected with Mtb Erdman strain (25 CFU per animal; n = 4) followed by sacrifice at 6 weeks and CFU counts of lungs. b lymph nodes (n = 2) collected at necropsy from macaques that had comparable Mtb counts in lungs (panel a) were analyzed using RNAseq. Kyoto Encyclopedia of Genes and Genomes profiles of one NHP illustrate the differential gene expression for Inreg clusters; Clusterprofiler pathway analysis of Inregs is illustrated in Supplementary Fig. 12. c M1-, M2-, and M0-MΦs were prepared from the bone marrow of naïve macaques (prefix n) and infected with Mtb followed by CFU counts on day 4 (**p < 0.01 one-way ANOVA with Tukey’s post-hoc test; 2 experiments shown). d Kyoto Encyclopedia of Genes and Genomes profiles of Mtb-infected M1-MΦs vs. Mtb-infected M2-MΦs show enrichment of genes regulating antigen processing 18 h post-infection. e Naïve or Mtb-infected M1-, and M2-MΦs were subjected to QPCR at 18 h post-infection using primers for mRNA of indicated genes which were differentially expressed in their human counterparts (*p < 0.01, t test). All ex vivo Mtb CFU experiments used MOI of 1.

Similar articles

Cited by

References

    1. Zumla A, et al. Host-directed therapies for infectious diseases: current status, recent progress, and future prospects. Lancet Infect. Dis. 2016;16:e47–e63. doi: 10.1016/S1473-3099(16)00078-5. - DOI - PMC - PubMed
    1. Koeken, V., Verrall, A. J., Netea, M. G., Hill, P. C. & van Crevel, R. Trained innate immunity and resistance to Mycobacterium tuberculosis infection. Clin. Microbiol. Infect.25, 1468–1472 (2019). - PubMed
    1. Russell DG. Mycobacterium tuberculosis: here today, and here tomorrow. Nat. Rev. Mol. Cell Biol. 2001;2:569–577. doi: 10.1038/35085034. - DOI - PubMed
    1. Volkman HE, et al. Tuberculous granuloma induction via interaction of a bacterial secreted protein with host epithelium. Science. 2010;327:466–469. doi: 10.1126/science.1179663. - DOI - PMC - PubMed
    1. Cohen SB, et al. Alveolar macrophages provide an early mycobacterium tuberculosis niche and initiate dissemination. Cell Host Microbe. 2018;24:439–446.e434. doi: 10.1016/j.chom.2018.08.001. - DOI - PMC - PubMed

Publication types