. 2022 May 19:11:e75670.
doi: 10.7554/eLife.75670.

T cells discriminate between groups C1 and C2 HLA-C

Affiliations

T cells discriminate between groups C1 and C2 HLA-C

Malcolm J W Sim et al. Elife. .

Abstract

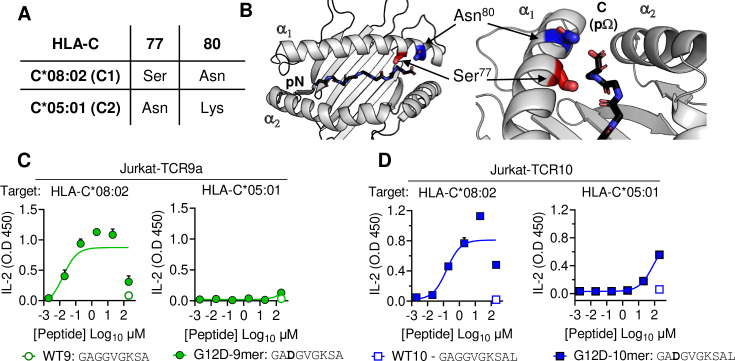
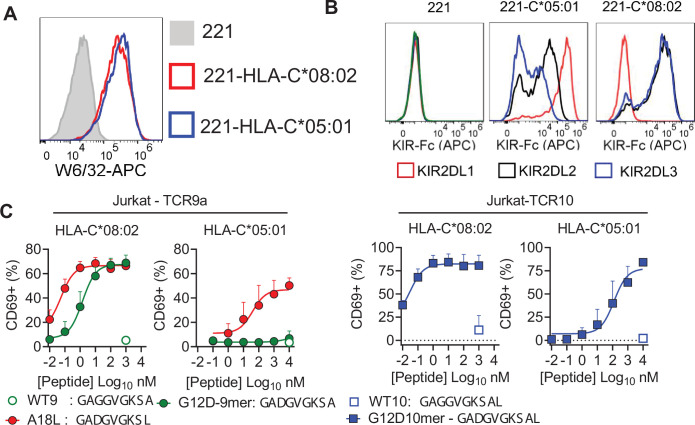
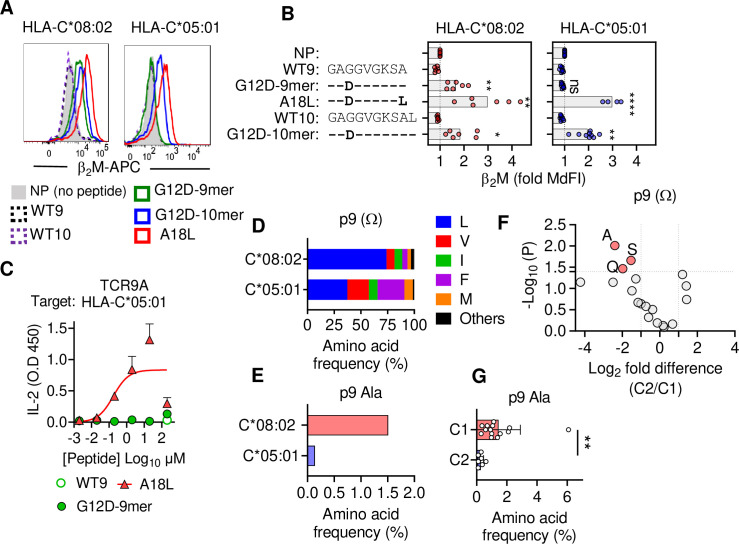
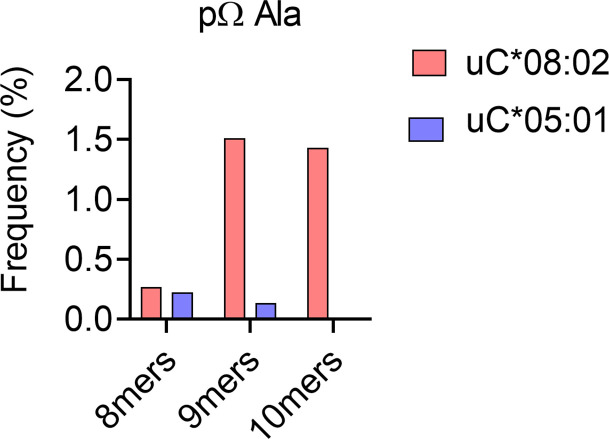
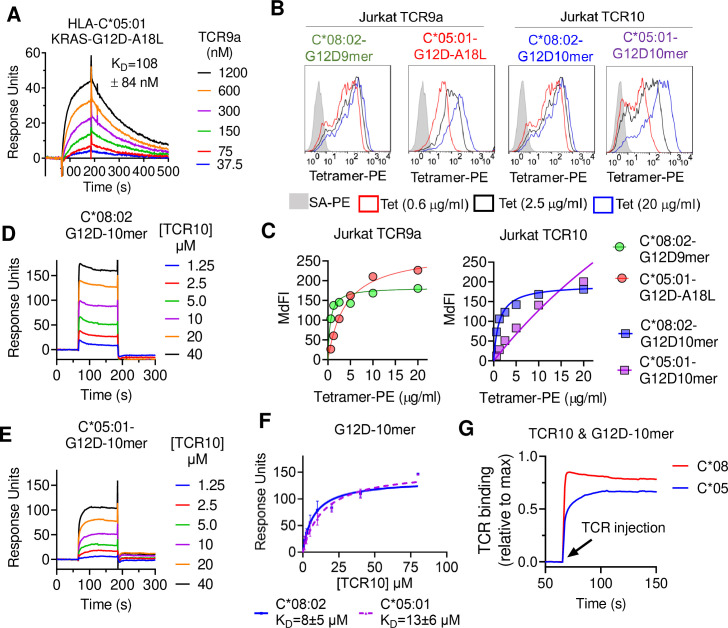
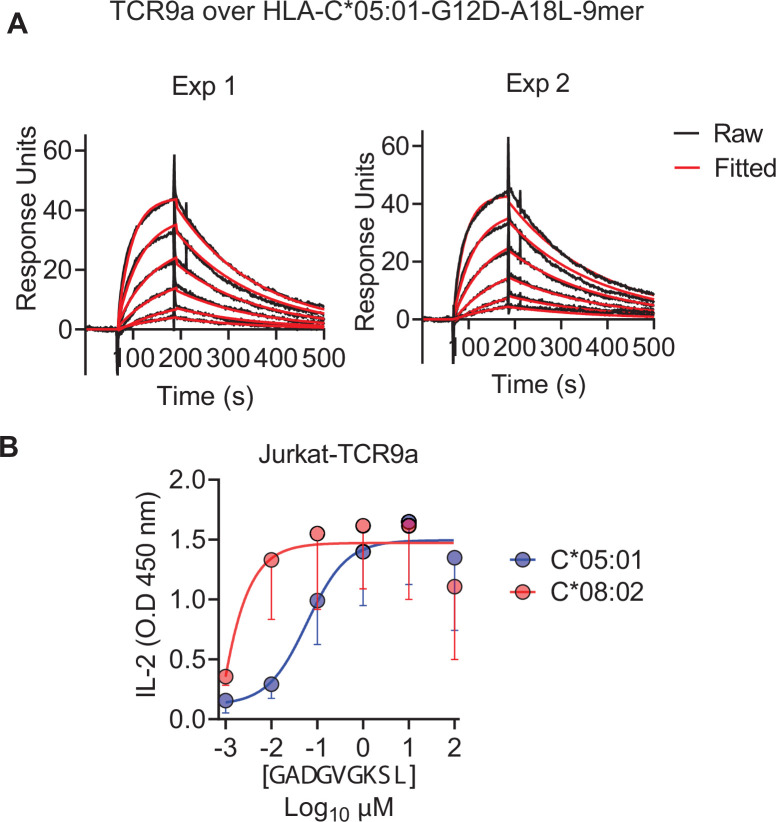
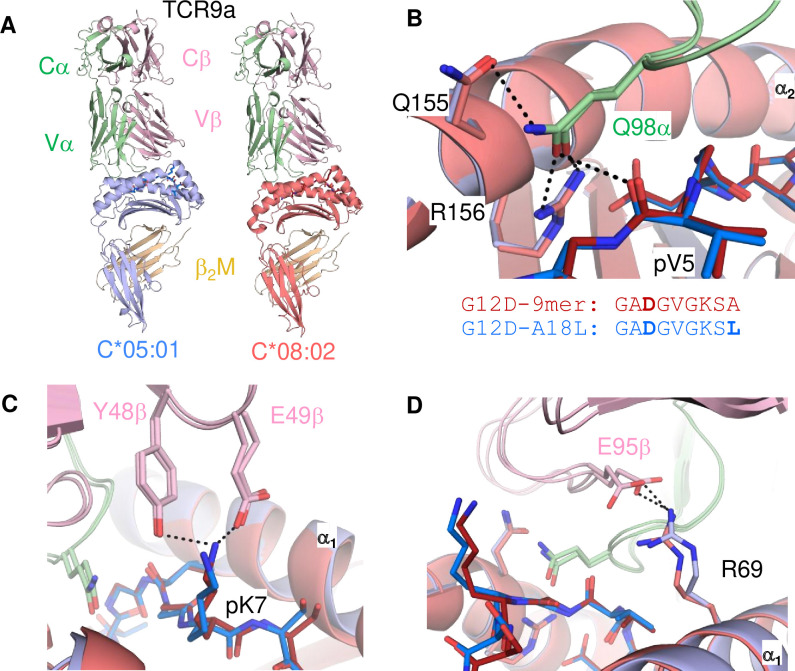
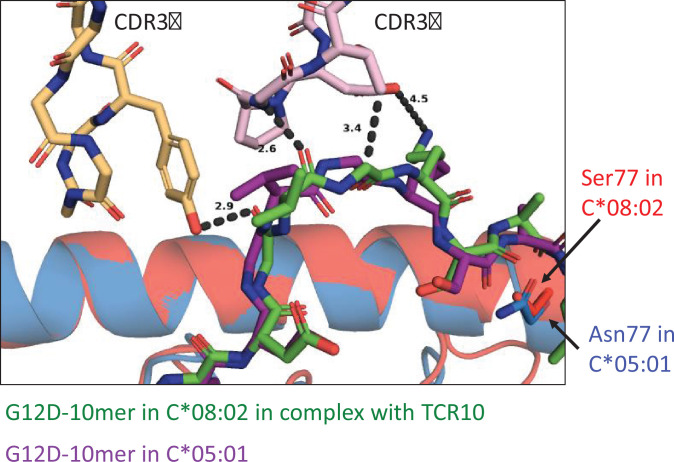
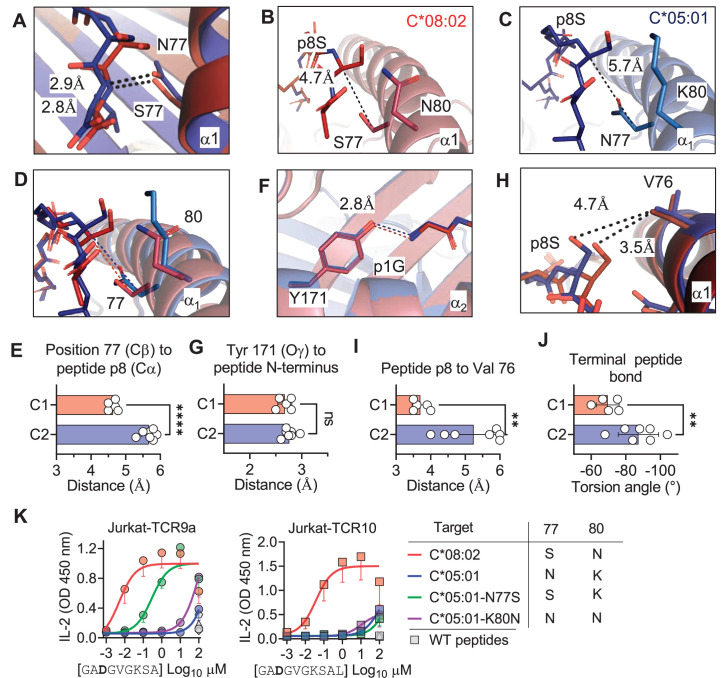
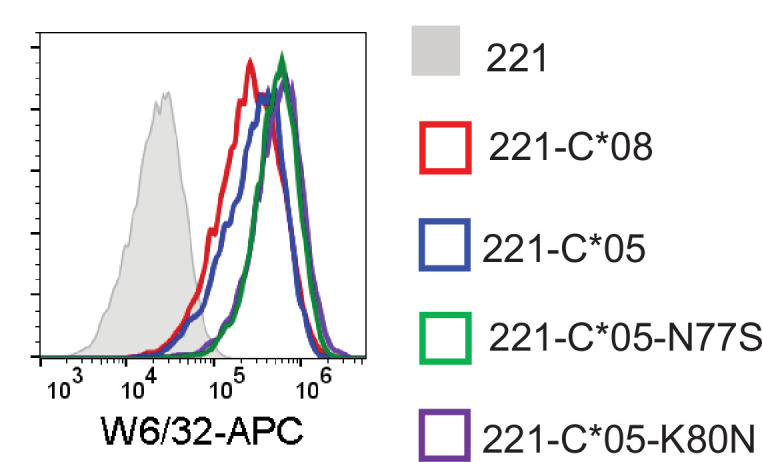
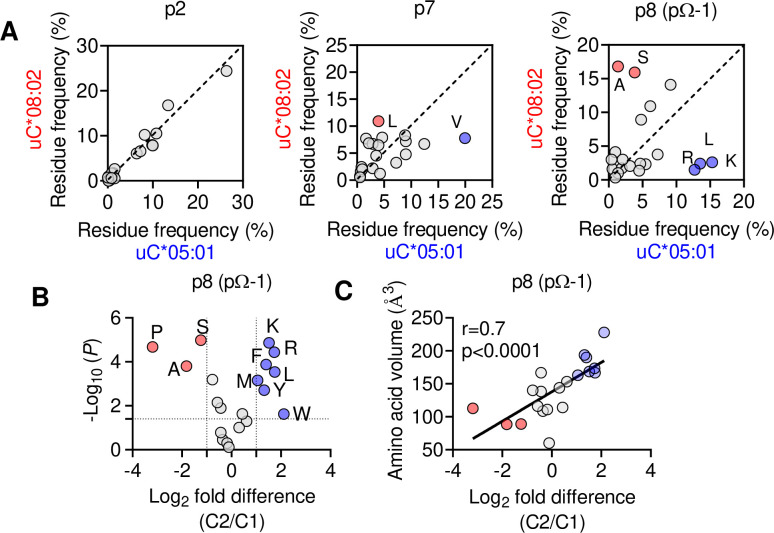
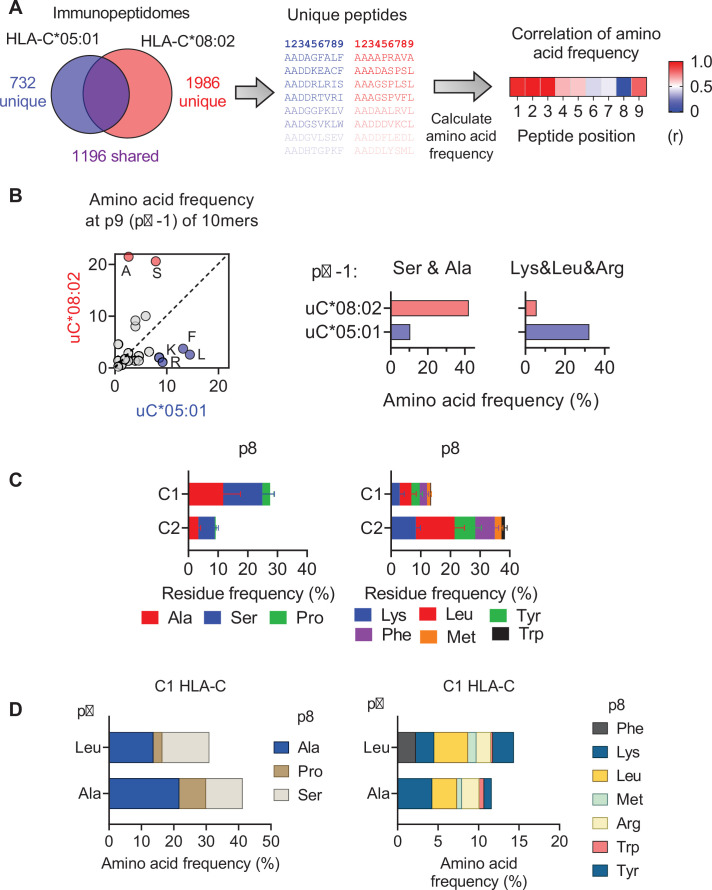
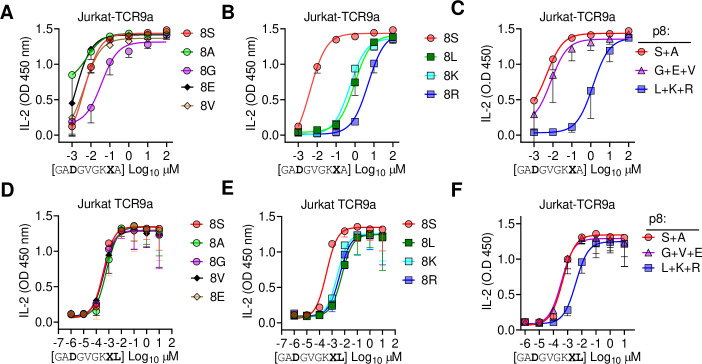
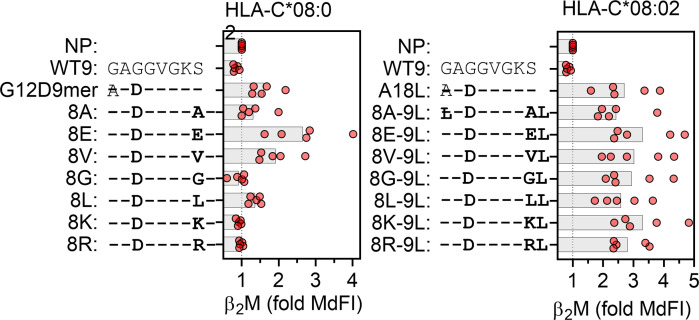
Dimorphic amino acids at positions 77 and 80 delineate HLA-C allotypes into two groups, C1 and C2, which associate with disease through interactions with C1 and C2-specific natural killer cell receptors. How the C1/C2 dimorphism affects T cell recognition is unknown. Using HLA-C allotypes that differ only by the C1/C2-defining residues, we found that KRAS-G12D neoantigen-specific T cell receptors (TCRs) discriminated between C1 and C2 presenting the same KRAS-G12D peptides. Structural and functional experiments, and immunopeptidomics analysis revealed that Ser77 in C1 and Asn77 in C2 influence amino acid preference near the peptide C-terminus (pΩ), including the pΩ-1 position, in which C1 favors small and C2 prefers large residues. This resulted in weaker TCR affinity for KRAS-G12D-bound C2-HLA-C despite conserved TCR contacts. Thus, the C1/C2 dimorphism on its own impacts peptide presentation and HLA-C-restricted T cell responses, with implications in disease, including adoptive T cell therapy targeting KRAS-G12D-induced cancers.

Keywords: C1/C2; HLA-C; KRAS-G12D; TCR; human; immunology; inflammation; molecular biophysics; neoantigen; structural biology.


Conflict of interest statement

MS, ZS, JL, PB, EL, PS No competing interests declared

Figures

Figure 1.
Figure 1.. HLA-C C1/C2 dimorphism impacts T cell recognition of KRAS-G12D neoantigen.
(A) Sequence of C1/C2 dimorphism in HLA-C*08:02 and HLA-C*05:01 at positions 77 and 80. All other residues are identical. (B) Location of C1/C2 dimorphism on the structure of HLA-C*08:02, close to peptide C-terminus (PDB:6ULI). (C, D) Stimulation of TCR9a+ Jurkat cells (C) and TCR10+ Jurkat cells (D) by 221C*08:02 (left) or 221C*05:01 (right) preloaded with KRAS WT or G12D peptides at indicated concentrations. Means and standard errors of IL-2 concentration in culture supernatant measured by ELISA are shown from two independent biological replicates. Source data available in Figure 1—source data 1.
Figure 1—figure supplement 1.
Figure 1—figure supplement 1.. Impact of C1/C2 dimorphism in T cell recognition of HLA-C.
(A) Expression of HLA-C*08:02 and HLA-C*05:01 on 721.221 (221) cells. (B) Recombinant KIR-Ig fusion protein (KIR-Fc) binding to 221, 221C*05:01, and 221C*08:02. KIR-Fc was conjugated to protein-A APC and used at 3.6 μg/ml. (C) Stimulation of Jurkat-TCR9a (left) and Jurkat-TCR10 (right) with indicated peptides loaded on TAP-deficient cells expressing HLA-C*08:02 and HLA-C*05:01. Jurkat T cell activation was measured by CD69 expression by flow cytometry. Means and standard errors from at least three independent experiments are shown.
Figure 2.
Figure 2.. C1 but not C2 HLA-C allotypes present peptides with C-terminal (pΩ) Ala.
(A) Stabilization of HLA-C on TAP-deficient 221 cells expressing HLA-C*08:02 or HLA-C*05:01. (B) Data from (A) shown as fold median fluorescent intensity (MdFI) relative to no peptide (NP) from a minimum of four independent experiments. (C) Stimulation of TCR9a+ Jurkat cells by 221C*05:01 cells preloaded with KRAS peptides at indicated concentrations. Means and standard errors of IL-2 concentration in culture supernatant measured by ELISA from two biological replicates are shown. (D) Frequency of indicated residues at the C-terminus (pΩ) in peptides eluted from HLA-C*08:02 or HLA-C*05:01. (E) Frequency of pΩ Ala in peptides eluted from HLA-C*08:02 or HLA-C*05:01. (F) Volcano plot displaying pΩ amino acid frequency from 21 HLA-C allotypes. The C2/C1 ratio is shown for the average frequency of each amino acid. (G) The frequency of pΩ Ala from 21 HLA-C allotypes by C1/C2 status. Statistical significance was assessed by unpaired t-test with Welsh’s correction, *p<0.05, **p<0.001, ****p<0.0001. Source data available in Figure 2—source data 1. Peptide sequences and p9 frequency analysis are available in Figure 2—source data 2.
Figure 2—figure supplement 1.
Figure 2—figure supplement 1.. Impact of peptide length on frequency of C-terminal (pΩ) Ala in peptides eluted from C*08:02 and C*05:01.
Frequency of peptides with C-terminal Ala in 8mers, 9mers, and 10mers eluted from HLA-C*08:02 and HLA-C*05:01.
Figure 3.
Figure 3.. T cell receptor (TCR) binding is weaker to C2 HLA-C.
(A) Binding of TCR9a to captured HLA-C*05:01-KRAS-G12D-A18L determined by surface plasmon resonance (SPR). Dissociation constant was determined by kinetic curve fitting of 12 curves from two independent experiments. (B, C) Binding of HLA-C*08:02 or HLA-C*05:01 tetramers to Jurkat T-cells expressing TCR9a or TCR10 at indicated tetramer concentrations. HLA-C was refolded with indicated peptides. (C) Summary of (B) from two independent experiments displayed as average (mean) and standard error of median fluorescence intensity (MdFI). (D, E) Binding of TCR10 to captured HLA-C*08:02-G12D-10mer and HLA-C*05:01-G12D-10mer by SPR. One experiment of four is shown. (F) Mean, standard deviation, and nonlinear curve fitting of TCR10 binding to G12D-10mer bound to C*08:02 and C*05:01. Dissociation constants were derived from four independent binding experiments with twofold serial dilutions of TCR10 starting at 10 μM (two experiments), 40 μM (one experiment), and 80 μM (one experiment). (G) Association binding of TCR10 with G12D-10mer presented by C*08:02 or C*05:01. SA, streptavidin; Tet, tetramer. Source data available in Figure 3—source data 1.
Figure 3—figure supplement 1.
Figure 3—figure supplement 1.. C*08 is a better ligand for TCR9a than C*05.
(A) Binding of TCR9a to C*05-A18L-9mer by surface plasmon resonance (SPR). Binding was measured with six serial twofold dilutions with a highest concentration of 1200 nM. The plots display raw and fitted data from two independent experiments. (B) Activation of Jurkat-TCR9a cells by 221C*08:02 and 221C*05:01 loaded with A18L-9mer. Means and standard errors of IL-2 concentration in culture supernatant from three independent experiments are shown.
Figure 4.
Figure 4.. Minimal impact of C1/C2 dimorphism on TCR:HLA-C complex structure.
(A) Side view of TCR9a in complex with HLA-C*05:01-G12D-A18L (left) and HLA-C*08:02-G12D-9mer (right; PDB:6ULR). (B–D) Interactions of TCR9a with HLA-C*05:01-A18L (blue) and HLA-C*08:02-G12D-9mer (red). TCR9a α chain, green; β chain, pink; β2-microglobulin (β2M), gold.
Figure 4—figure supplement 1.
Figure 4—figure supplement 1.. Modeling TCR10 binding to C*05:01-G12D-10mer.
Crystal structure of TCR10 in complex with C*08:02-G12D-10mer (PDB:6UON) was used to dock C*05:01-G12D-10mer (PDB:6JTO). Docking was carried out in PyMOL.
Figure 5.
Figure 5.. C1/C2 dimorphism determines the distance between peptide p8 and HLA-C.
(A) Hydrogen bond between HLA-C position 77 and amide in terminal peptide bond in C*08:02-G12D-9mer and C*05:01-A18L-9mer structures. (B–D) Distance between HLA-C position 77 Cβ and Cα of peptide p8 Ser of HLA-C*08:02-G12D-9mer (B), HLA-C*05:01-G12D-A18L (C), and both overlaid (D). (E) Distances between HLA-C position 77 Cβ and Cα of peptide pΩ-1 in 12 HLA-C crystal structures. (F) Distance between Tyr 171 Oγ and peptide N-terminus of C*08:02 and C*05:01. (G) Distance between Tyr 171 Oγ and peptide N-terminus in 12 HLA-C crystal structures. (H) Distance between peptide p8 side chain and HLA-C position 77 Val side chain in structures of C*08:02 and C*05:01. (I) Distance between peptide pΩ-1 side chain and HLA-C position 76 Val side chain in 12 HLA-C structures. (J) Torsion angle of terminal peptide bond in 12 HLA-C structures. (K) Stimulation of Jurkat-TCR9a+ and Jurkat-TCR10+ by 221 cells expressing HLA-C*08:02, HLA-C*05:01, HLA-C*05:01-N77S, or HLA-C*05:01-K80N preloaded with G12D-9mer (left) or G12D-10mer (right). Means and standard errors of IL-2 concentration in culture supernatant measured by ELISA from three biological replicates are shown. Significance in (E), (G), (I), and (J) was measured using an unpaired t-test with Welch’s correction, **p<0.01, ****p<0.0001. Source data available in Figure 5—source data 1.
Figure 5—figure supplement 1.
Figure 5—figure supplement 1.. Expression HLA-C in 721.221 cells with position 77 and 80 substitutions.
Figure 6.
Figure 6.. The C1/C2 dimorphism selects for side-chain size at pΩ-1.
(A) Correlation of amino acid frequency at p2, p7, and p8 (pΩ-1) of 9mer peptides unique to HLA-C*08:02 (uC*08:02) and unique to HLA-C*05:01 (uC*05:01). (B) Volcano plot displaying relative p8 amino acid frequency from 9mer peptides eluted from 14 HLA-C allotypes based on C1/C2 status. Amino acids with twofold enrichment and statistically significant differences (p<0.05) determined by Student’s t-test are shown. A total of 26,543 peptide sequences were included. (C) Correlation (Pearson) of amino acid volume with amino acid enrichment at p8 of peptides eluted from HLA-C defined by C2/C1 status. Source data available in Figure 6—source data 1. Peptide sequences and p8 frequency analysis are available in Figure 2—source data 2.
Figure 6—figure supplement 1.
Figure 6—figure supplement 1.. Impact of C1/C2 dimorphism on HLA-C immunopeptidomes.
(A) Workflow for comparing amino acid frequency of 9mer peptides eluted from HLA-C*05:01 and HLA-C*08:02. Amino acid frequencies were compared by Pearson correlation. (B, left) Correlation of amino acid frequencies at p9 (pΩ-1) of 10mers eluted from HLA-C*05:01 and HLA-C*08:02. Frequencies of Ser and Ala and Lys, Leu and Arg at pΩ-1 from peptides eluted from HLA-C*08:02 and HLA-C*05:01 (right). (C) Average frequencies of indicated amino acids at p8 (pΩ-1) of 9mers eluted from 14 C1 and 7 C2 HLA-C allotypes. (D) Amino acid frequencies at p8 (pΩ-1) of 9mers eluted from C1 allotypes with Ala or Leu at the C-terminus (pΩ).
Figure 7.
Figure 7.. Large residues at p8 diminish T cell recognition of C1 HLA-C.
(A–F) Stimulation of Jurkat-TCR9a+ cells by 221C*08:02 cells preloaded with pΩ-1 substitutions of G12D-9mer (A, B) and A18L-9mer (D, E) at indicated concentrations. Each peptide was tested individually in two independent experiments and displayed by p8 sequence as indicated. (C, F) Data from (A, B) and (D, E) are summarized in (C) and (F), respectively, by pooling data by indicated p8 substitutions. Means and standard errors of IL-2 concentration in culture supernatant measured by ELISA are shown. Source data available in Figure 7—source data 1.
Figure 7—figure supplement 1.
Figure 7—figure supplement 1.. Impact of p8 size on stabilization of HLA-C*08:02.
Stabilization of HLA-C on HLA-C*08:02-expressing TAP-deficient cells by G12D-9mer (left) and A18L-9mer (right) with indicated p8 (pΩ-1) substitutions. Data are from five independent experiments and normalized to cells with no peptide (NP).

Similar articles

Cited by

References

    1. Adams EJ, Parham P. Species-specific evolution of MHC class I genes in the higher primates. Immunological Reviews. 2001;183:41–64. doi: 10.1034/j.1600-065x.2001.1830104.x. - DOI - PubMed
    1. Adams PD, Grosse-Kunstleve RW, Hung LW, Ioerger TR, McCoy AJ, Moriarty NW, Read RJ, Sacchettini JC, Sauter NK, Terwilliger TC. PHENIX: building new software for automated crystallographic structure determination. Acta Crystallographica. Section D, Biological Crystallography. 2002;58:1948–1954. doi: 10.1107/s0907444902016657. - DOI - PubMed
    1. Addo MM, Altfeld M, Rosenberg ES, Eldridge RL, Philips MN, Habeeb K, Khatri A, Brander C, Robbins GK, Mazzara GP, Goulder PJ, Walker BD, HIV Controller Study Collaboration The HIV-1 regulatory proteins Tat and Rev are frequently targeted by cytotoxic T lymphocytes derived from HIV-1-infected individuals. PNAS. 2001;98:1781–1786. doi: 10.1073/pnas.98.4.1781. - DOI - PMC - PubMed
    1. Apps R, Qi Y, Carlson JM, Chen H, Gao X, Thomas R, Yuki Y, Del Prete GQ, Goulder P, Brumme ZL, Brumme CJ, John M, Mallal S, Nelson G, Bosch R, Heckerman D, Stein JL, Soderberg KA, Moody MA, Denny TN, Zeng X, Fang J, Moffett A, Lifson JD, Goedert JJ, Buchbinder S, Kirk GD, Fellay J, McLaren P, Deeks SG, Pereyra F, Walker B, Michael NL, Weintrob A, Wolinsky S, Liao W, Carrington M. Influence of HLA-C expression level on HIV control. Science (New York, N.Y.) 2013;340:87–91. doi: 10.1126/science.1232685. - DOI - PMC - PubMed
    1. Apps R, Meng Z, Del Prete GQ, Lifson JD, Zhou M, Carrington M. Relative expression levels of the HLA class-I proteins in normal and HIV-infected cells. Journal of Immunology (Baltimore, Md) 2015;194:3594–3600. doi: 10.4049/jimmunol.1403234. - DOI - PMC - PubMed

Publication types

MeSH terms

Substances