Construction of gastric cancer patient-derived organoids and their utilization in a comparative study of clinically used paclitaxel nanoformulations
- PMID: 35585597
- PMCID: PMC9118843
- DOI: 10.1186/s12951-022-01431-8
Construction of gastric cancer patient-derived organoids and their utilization in a comparative study of clinically used paclitaxel nanoformulations
Abstract
Background: Gastric cancer (GC) is a highly heterogeneous disease with many different histological and molecular subtypes. Due to their reduced systemic adverse effects, nanoformulation agents have attracted increasing attention for use in the treatment of GC patients in the clinic. To improve therapeutic outcomes, it is vitally necessary to provide individual medication references and guidance for use of these nanoformulations, and patient-derived organoids (PDOs) are promising models through which to achieve this goal.
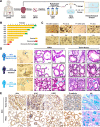
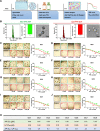
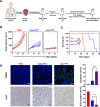
Results: Using an improved enzymatic digestion process, we succeeded in constructing GC PDOs from surgically resected tumor tissues and endoscopic biopsies from GC patients; these PDOs closely recapitulated the histopathological and genomic features of the corresponding primary tumors. Next, we chose two representative paclitaxel (PTX) nanoformulations for comparative study and found that liposomal PTX outperformed albumin-bound PTX in killing GC PDOs at both the transcriptome and cellular levels. Our results further showed that the different distributions of liposomal PTX and albumin-bound PTX in PDOs played an essential role in the distinct mechanisms through which they kill PDOs. Finally, we constructed patient-derived xenografts model in which we verified the above distinct therapeutic outcomes via an intratumoral administration route.
Conclusions: This study demonstrates that GC PDOs are reliable tools for predicting nanoformulation efficacy.
Keywords: Albumin-bound paclitaxel; Gastric cancer; Liposomal paclitaxel; Nanoformulation; Patient-derived organoids.
© 2022. The Author(s).
Conflict of interest statement
The authors declare that they have no competing interests.
Figures


Similar articles
-
Development of Patient-Derived Gastric Cancer Organoids from Endoscopic Biopsies and Surgical Tissues.Ann Surg Oncol. 2018 Sep;25(9):2767-2775. doi: 10.1245/s10434-018-6662-8. Epub 2018 Jul 12. Ann Surg Oncol. 2018. PMID: 30003451
-
Gastric cancer patient-derived organoids model for the therapeutic drug screening.Biochim Biophys Acta Gen Subj. 2024 Apr;1868(4):130566. doi: 10.1016/j.bbagen.2024.130566. Epub 2024 Jan 19. Biochim Biophys Acta Gen Subj. 2024. PMID: 38244703
-
Patient-derived organoid culture of gastric cancer for disease modeling and drug sensitivity testing.Biomed Pharmacother. 2023 Jul;163:114751. doi: 10.1016/j.biopha.2023.114751. Epub 2023 Apr 26. Biomed Pharmacother. 2023. PMID: 37105073
-
Patient derived organoids in prostate cancer: improving therapeutic efficacy in precision medicine.Mol Cancer. 2021 Sep 29;20(1):125. doi: 10.1186/s12943-021-01426-3. Mol Cancer. 2021. PMID: 34587953 Free PMC article. Review.
-
Nanoparticle albumin-bound paclitaxel: a big nano for the treatment of gastric cancer.Cancer Chemother Pharmacol. 2019 Oct;84(4):669-677. doi: 10.1007/s00280-019-03887-2. Epub 2019 Jun 11. Cancer Chemother Pharmacol. 2019. PMID: 31187168 Review.
Cited by
-
Success rate of current human-derived gastric cancer organoids establishment and influencing factors: A systematic review and meta-analysis.World J Gastrointest Oncol. 2024 Apr 15;16(4):1626-1646. doi: 10.4251/wjgo.v16.i4.1626. World J Gastrointest Oncol. 2024. PMID: 38660634 Free PMC article.
-
Molecular subtype construction and prognosis model for stomach adenocarcinoma characterized by metabolism-related genes.Heliyon. 2024 Mar 19;10(7):e28413. doi: 10.1016/j.heliyon.2024.e28413. eCollection 2024 Apr 15. Heliyon. 2024. PMID: 38596054 Free PMC article.
-
Xenograft and organoid models in developing precision medicine for gastric cancer (Review).Int J Oncol. 2024 Apr;64(4):41. doi: 10.3892/ijo.2024.5629. Epub 2024 Feb 23. Int J Oncol. 2024. PMID: 38390969 Free PMC article. Review.
-
Applications of human organoids in the personalized treatment for digestive diseases.Signal Transduct Target Ther. 2022 Sep 27;7(1):336. doi: 10.1038/s41392-022-01194-6. Signal Transduct Target Ther. 2022. PMID: 36167824 Free PMC article. Review.
References
MeSH terms
Substances
Grants and funding
LinkOut - more resources
Full Text Sources
Other Literature Sources
Medical
Miscellaneous

