. 2022 May 18;13(1):2725.
doi: 10.1038/s41467-022-30008-0.

Visual barcodes for clonal-multiplexing of live microscopy-based assays

Affiliations

Visual barcodes for clonal-multiplexing of live microscopy-based assays

Tom Kaufman et al. Nat Commun. .

Abstract

While multiplexing samples using DNA barcoding revolutionized the pace of biomedical discovery, multiplexing of live imaging-based applications has been limited by the number of fluorescent proteins that can be deconvoluted using common microscopy equipment. To address this limitation, we develop visual barcodes that discriminate the clonal identity of single cells by different fluorescent proteins that are targeted to specific subcellular locations. We demonstrate that deconvolution of these barcodes is highly accurate and robust to many cellular perturbations. We then use visual barcodes to generate 'Signalome' cell-lines by mixing 12 clones of different live reporters into a single population, allowing simultaneous monitoring of the activity in 12 branches of signaling, at clonal resolution, over time. Using the 'Signalome' we identify two distinct clusters of signaling pathways that balance growth and proliferation, emphasizing the importance of growth homeostasis as a central organizing principle in cancer signaling. The ability to multiplex samples in live imaging applications, both in vitro and in vivo may allow better high-content characterization of complex biological systems.


Conflict of interest statement

R.S. received a grant from Merck EMD Serono, is a paid adviser to Curesponse, and Baccine and is serving on the SAB of Micronoma. The remaining authors declare no competing interests.

Figures
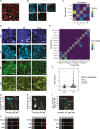
Fig. 1
Fig. 1. Developing visual barcodes for multiplexing live imaging applications.
A Representative image of the A375 cell line with an iRFP-H2A nuclear marker. B Representative images of five CFP localizations in the A375 cell line: Whole Cell (WC), Nuclear Export Signal (NES), Nuclei, Peroxisome (Peroxi), and Endoplasmic Reticulum (ER). C Heatmap of false detection rate (FDR) for barcode calling for the five CFP localizations in the A375 cell line. D Representative images of all 12 visual barcodes used in A375 cell line. E Average miss rate of barcode calling for all 12 visual barcodes of the A375 cell line, treated with DMSO controls (n = 39). Numbers in the diagonal represent the sensitivity for each barcode. F Violin plots showing miss rate for all 12 visual barcodes of the A375 cell line, treated with DMSO controls (n = 39) or with drugs (n = 75). GI Scatter plot showing the separation of nine A375 clones with visual barcodes by the ImageStream system according to their fluorescent color and localization. The separation by localization is only demonstrated for GFP-positive clones (I). J Representative images from ImageStream of all nine clones. Two cells from each clone are presented. Scale bar in (A and B) is 50 µm, in (D) 100 µm and in (J) 7 µm. Source data are provided with this paper.
Fig. 2
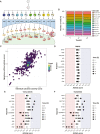
Fig. 2. Generating the A375 “Signalome” reporter cell line.
A Illustration of the 12 clones that were used to generate the A375 Signalome cell line. A375 cells were first infected with iRFP-H2A to mark the cell nucleus. Then, 12 clones were generated with 12 visual barcodes. Lastly, a different live reporter was added to each of the clones. Transcription activating reporters are represented by gold while translocation reporters are represented in red. Binding partners in the nucleus are represented in purple. B Relative number of cells from each clone in a DMSO control wells over time. C Scatter plot showing the correlation between the reporter activity scores, for all 12 clones when grown separately or as part of the Signalome cell line, in response to 75 drugs. DF Reporter activity plots of the A375 signalome cell line in response to DMSO, vemurafenib (1 µM) or trametinib (0.125 µM) over time. Blue and red backgrounds represent activation or inhibition scores above 0.2 or below −0.2, respectively. The average cell count per reporter in (DF) is: 656, 545, and 530 cells, respectively. Source data are provided with this paper.
Fig. 3
Fig. 3. Large-scale correlations in signaling suggest a generalized response that is compound independent.
A Unsupervised hierarchical clustering of A375 signalome cells treated by 122 active drugs according to their activity scores. Due to technical error, Geminin reporter was not measured for all drugs and was thus discarded. Results from all 12 reporters can be seen in Supplementary Fig. 4I for the subset of drugs that for which Geminin data are available. B Scatter plot showing the correlation between the activities of the p38 and p53 reporters after 48 h of treatment with 122 active drugs. C Heatmap showing the pairwise Pearson correlations between the different A375 Signalome clones, after 48 h of treatment with 122 active drugs. D A model proposing how drugs with different mechanisms may converge into two major signaling states. While each of the drugs has different targets, many of the targets affect the same sensing mechanism that later governs the p53- vs p38-signaling states. Source data are provided with this paper.
Fig. 4
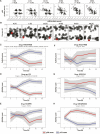
Fig. 4. Drug treatments increase the correlations between the activity of pathways.
A Scatter plots of the activity scores of p38 and p53 reporters in the A375 signalome cell line before and at multiple time points after treatment with 122 active drugs. Each dot represents a different drug. Pearson’s r is depicted for each of the time points. B Pearson correlation coefficients were calculated for each pair of pathways in the A375 signalome cell line before and at different time points after treatment with 122 active drugs. Each datapoint represents a correlation value for one given pair of pathways over all 122 active drugs. The correlation between the activity score of p38 and p53 pathways is marked by a red circle. CH Locally weighted smoothing (Lowess) regression of all reporters in each of the two signaling states is shown for six representative drug treatments, each associated with different drug targets. While three of the drugs drive the p53-signaling state (CE), the other three drugs drive the p38 signaling state (FH). The bold (red and blue) lines and the gray sleeves represent mean values and + /− SEM respectively. Source data are provided with this paper.
Fig. 5
Fig. 5. PCA suggests that the p38 and p53-signaling states exist pretreatment and increase in weight over time.
A PCA of the activity scores of 11 signaling pathways after 48 h of treatment with 122 drugs. The color of each drug is indicating its cluster in Fig. 3A. B, C Bar plots representing the PC1 loading of each pathway after 48 h of drug treatment (B) or pretreatment (C). D Variance of pathway activity, when projected on the principal components calculated from measurements on cells that were not exposed to drug treatment. Source data are provided with this paper.
Fig. 6
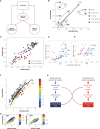
Fig. 6. Cell growth and proliferation are tightly regulated and correlate with p38- and p53-signaling states.
A A model demonstrating how sensing of cell size can affect both cell growth and proliferation to keep homeostasis of cell size. B Scatter plot showing the initial and long-term effects of rapamycin or SNS-032 on the average cellular growth rate and division rate of Rpe1 cells. Data points indicate the average growth and division rates measured: (1) during the first 24 h of drug treatment and (2) during 24–60 h of drug treatment. C Average growth rate vs. division rate in five cell lines (Rpe1, HeLa, U2OS, SAOS2, 16HBE) treated with either growth inhibitors (red) or cdk1/2 inhibitors (blue). Measurements in each cell line were normalized by the values measured for untreated control samples (gray) of the same cell line. The growth inhibitors used were: Cycloheximide, Torin-2, and Rapamycin, at varying doses (de- tailed in “Methods”). The cdk1/2 inhibitors used were: SNS-032, PHA848125, Cdk2 Inhibitor III, and Dinaciclib, at varying doses (detailed in “Methods”). D, E The average cell size for a given drug correlated with its PC1 value calculated on the reporters’ activity for data from Kaufman et al. (D) and Liu at al. (E). F Average growth rate vs. division rate for A375 cells in Signalome screen. Each circle represents one screened condition (drug treatment). The circle’s color indicates the value of PC1 in that condition. Contour lines show the average value of PC1 as a function of growth rate and division rate. G The average level of p38 (top) and p53 (bottom) activity as a function of growth rate and cell cycle length. H A model proposing how drugs which affect cell division activate the p53-signaling state while drugs that affect cell growth activate the p38-signaling state. Each state in return actives a compensation mechanism resulting in a new equilibrium. Source data are provided with this paper.

Similar articles

Cited by

References

    1. Vogelstein B, et al. Cancer genome landscapes. Science. 2013;339:1546–1558. doi: 10.1126/science.1235122. - DOI - PMC - PubMed
    1. Sanchez-Vega F, et al. Oncogenic signaling pathways in the cancer genome atlas. Cell. 2018;173:321–337.e10. doi: 10.1016/j.cell.2018.03.035. - DOI - PMC - PubMed
    1. Zhou W, et al. Assessment of hypoxia inducible factor levels in cancer cell lines upon hypoxic induction using a novel reporter construct. PLoS ONE. 2011;6:e27460. doi: 10.1371/journal.pone.0027460. - DOI - PMC - PubMed
    1. Regot S, Hughey JJ, Bajar BT, Carrasco S, Covert MW. High-sensitivity measurements of multiple kinase activities in live single cells. Cell. 2014;157:1724–1734. doi: 10.1016/j.cell.2014.04.039. - DOI - PMC - PubMed
    1. DeBerardinis RJ, Sayed N, Ditsworth D, Thompson CB. Brick by brick: metabolism and tumor cell growth. Curr. Opin. Genet. Dev. 2008;18:54–61. doi: 10.1016/j.gde.2008.02.003. - DOI - PMC - PubMed

Publication types