PrrT/A, a Pseudomonas aeruginosa Bacterial Encoded Toxin-Antitoxin System Involved in Prophage Regulation and Biofilm Formation
- PMID: 35575497
- PMCID: PMC9241795
- DOI: 10.1128/spectrum.01182-22
PrrT/A, a Pseudomonas aeruginosa Bacterial Encoded Toxin-Antitoxin System Involved in Prophage Regulation and Biofilm Formation
Abstract
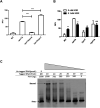
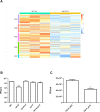
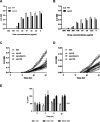
Toxin-antitoxin (TA) systems are genetic modules that consist of a stable protein-toxin and an unstable antitoxin that neutralizes the toxic effect. In type II TA systems, the antitoxin is a protein that inhibits the toxin by direct binding. Type II TA systems, whose roles and functions are under intensive study, are highly distributed among bacterial chromosomes. Here, we identified and characterized a novel type II TA system PrrT/A encoded in the chromosome of the clinical isolate 39016 of the opportunistic pathogen Pseudomonas aeruginosa. We have shown that the PrrT/A system exhibits classical type II TA characteristics and novel regulatory properties. Following deletion of the prrA antitoxin, we discovered that the system is involved in a range of processes including (i) biofilm and motility, (ii) reduced prophage induction and bacteriophage production, and (iii) increased fitness for aminoglycosides. Taken together, these results highlight the importance of this toxin-antitoxin system to key physiological traits in P. aeruginosa. IMPORTANCE The functions attributed to bacterial TA systems are controversial and remain largely unknown. Our study suggests new insights into the potential functions of bacterial TA systems. We reveal that a chromosome-encoded TA system can regulate biofilm and motility, antibiotic resistance, prophage gene expression, and phage production. The latter presents a thus far unreported function of bacterial TA systems. In addition, with the emergence of antimicrobial-resistant bacteria, especially with the rising of P. aeruginosa resistant strains, the investigation of TA systems is critical as it may account for potential new targets against the resistant strains.
Keywords: Pseudomonas aeruginosa; bacteriophages; biofilm; biofilms; prophages; toxin-antitoxin.
Conflict of interest statement
The authors declare no conflict of interest.
Figures


Similar articles
-
Type II Toxin-Antitoxin Systems in Pseudomonas aeruginosa.Toxins (Basel). 2023 Feb 17;15(2):164. doi: 10.3390/toxins15020164. Toxins (Basel). 2023. PMID: 36828478 Free PMC article. Review.
-
Characterization of PfiT/PfiA toxin-antitoxin system of Pseudomonas aeruginosa that affects cell elongation and prophage induction.Environ Microbiol. 2020 Dec;22(12):5048-5057. doi: 10.1111/1462-2920.15102. Epub 2020 Jun 24. Environ Microbiol. 2020. PMID: 32458560
-
Effect of mazEF, higBA and relBE toxin-antitoxin systems on antibiotic resistance in Pseudomonas aeruginosa and Staphylococcus isolates.Malawi Med J. 2018 Jun;30(2):67-72. doi: 10.4314/mmj.v30i2.3. Malawi Med J. 2018. PMID: 30627331 Free PMC article.
-
Effect of ZnO nanoparticles on biofilm formation and gene expression of the toxin-antitoxin system in clinical isolates of Pseudomonas aeruginosa.Ann Clin Microbiol Antimicrob. 2023 Oct 5;22(1):89. doi: 10.1186/s12941-023-00639-2. Ann Clin Microbiol Antimicrob. 2023. PMID: 37798613 Free PMC article.
-
Functional characterization of toxin-antitoxin system in Mycobacterium tuberculosis.Indian J Tuberc. 2023 Apr;70(2):149-157. doi: 10.1016/j.ijtb.2022.05.010. Epub 2022 May 27. Indian J Tuberc. 2023. PMID: 37100570 Review.
Cited by
-
Toxin:antitoxin ratio sensing autoregulation of the Vibrio cholerae parDE2 module.Sci Adv. 2024 Jan 5;10(1):eadj2403. doi: 10.1126/sciadv.adj2403. Epub 2024 Jan 5. Sci Adv. 2024. PMID: 38181072 Free PMC article.
-
eDNA-stimulated cell dispersion from Caulobacter crescentus biofilms upon oxygen limitation is dependent on a toxin-antitoxin system.Elife. 2023 Jan 19;12:e80808. doi: 10.7554/eLife.80808. Elife. 2023. PMID: 36475544 Free PMC article.
-
Highly sensitive extraction-free saliva-based molecular assay for rapid diagnosis of SARS-CoV-2.J Clin Microbiol. 2024 Jun 12;62(6):e0060024. doi: 10.1128/jcm.00600-24. Epub 2024 May 24. J Clin Microbiol. 2024. PMID: 38785448 Free PMC article.
-
Type II Toxin-Antitoxin Systems in Pseudomonas aeruginosa.Toxins (Basel). 2023 Feb 17;15(2):164. doi: 10.3390/toxins15020164. Toxins (Basel). 2023. PMID: 36828478 Free PMC article. Review.
-
Differential expression of the yfj operon in a Bacillus subtilis biofilm.Appl Environ Microbiol. 2024 Nov 20;90(11):e0136224. doi: 10.1128/aem.01362-24. Epub 2024 Oct 22. Appl Environ Microbiol. 2024. PMID: 39436054
References
-
- Christensen SK, Maenhaut-Michel G, Mine N, Gottesman S, Gerdes K, Van Melderen L. 2004. Overproduction of the Lon protease triggers inhibition of translation in Escherichia coli: involvement of the yefM-yoeB toxin-antitoxin system. Mol Microbiol 51:1705–1717. doi:10.1046/j.1365-2958.2003.03941.x. - DOI - PubMed
Publication types
MeSH terms
Substances
LinkOut - more resources
Full Text Sources
Molecular Biology Databases

