

Enteroendocrine Cell Formation Is an Early Event in Pancreatic Tumorigenesis
- PMID: 35574446
- PMCID: PMC9091171
- DOI: 10.3389/fphys.2022.865452
Enteroendocrine Cell Formation Is an Early Event in Pancreatic Tumorigenesis
Abstract
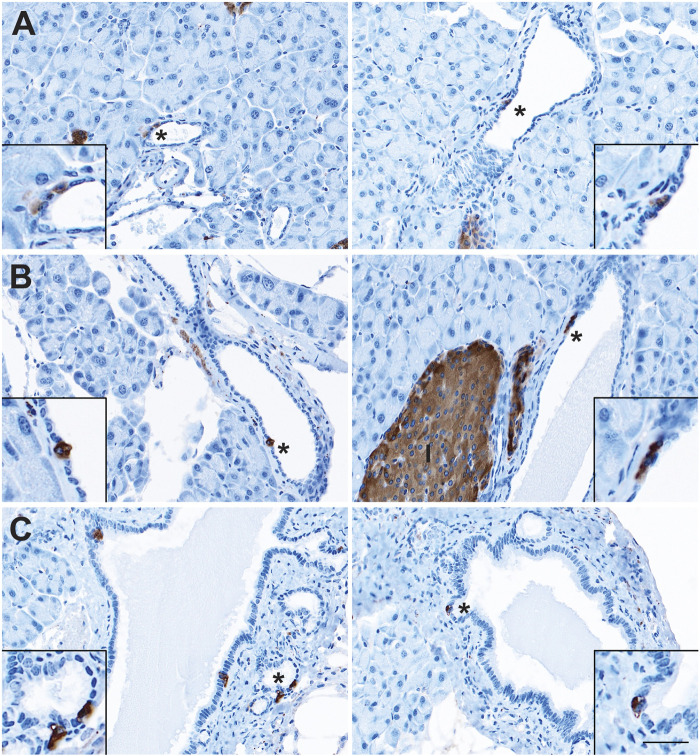
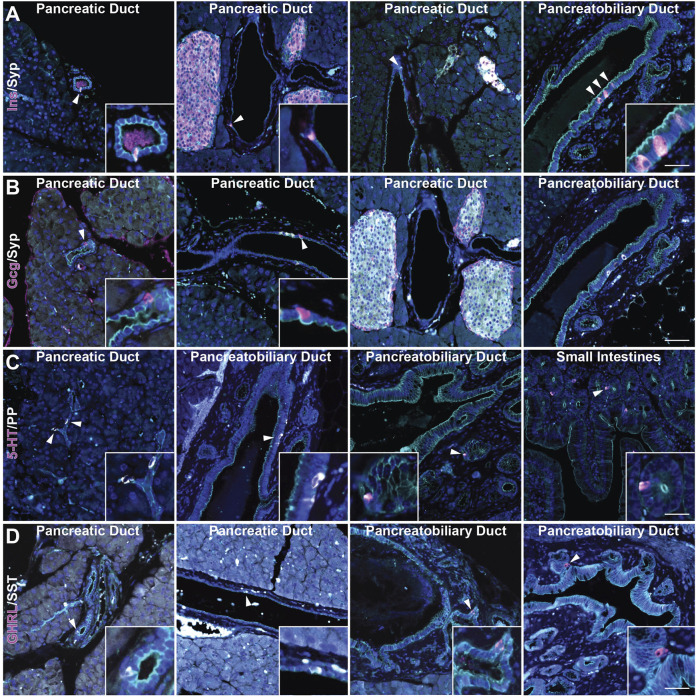
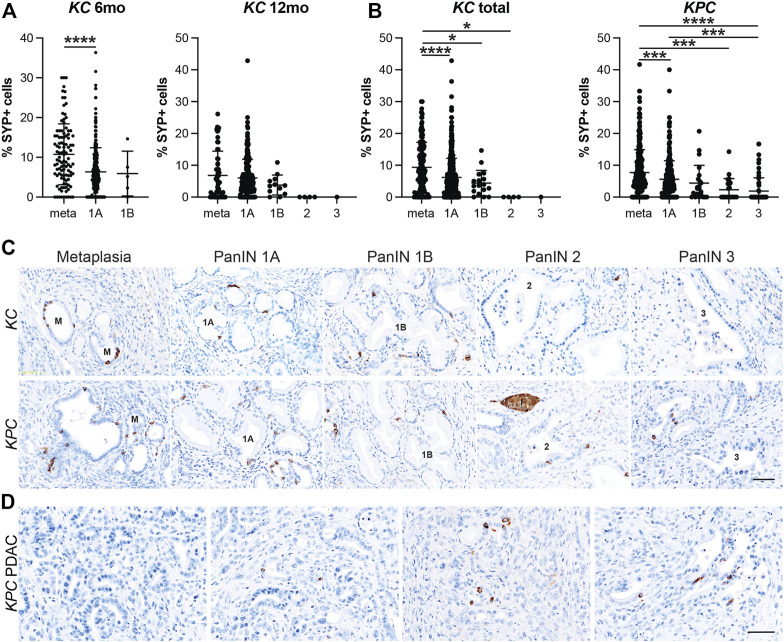
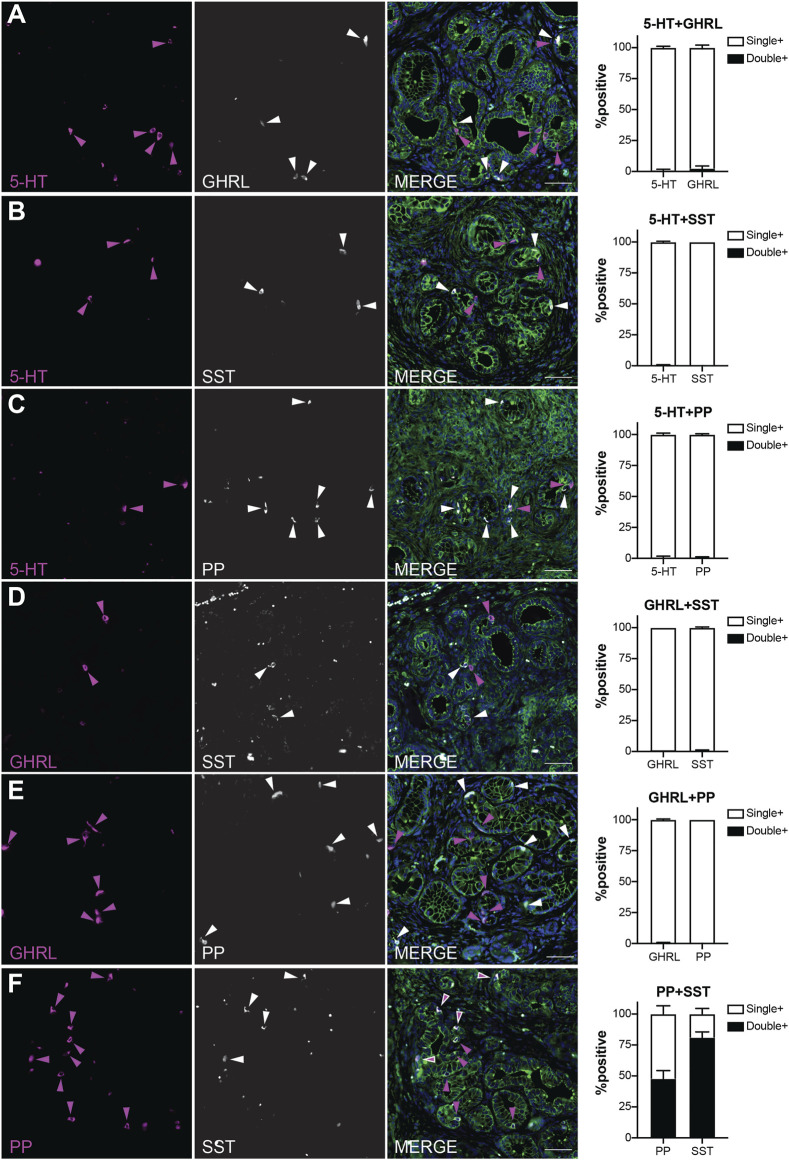
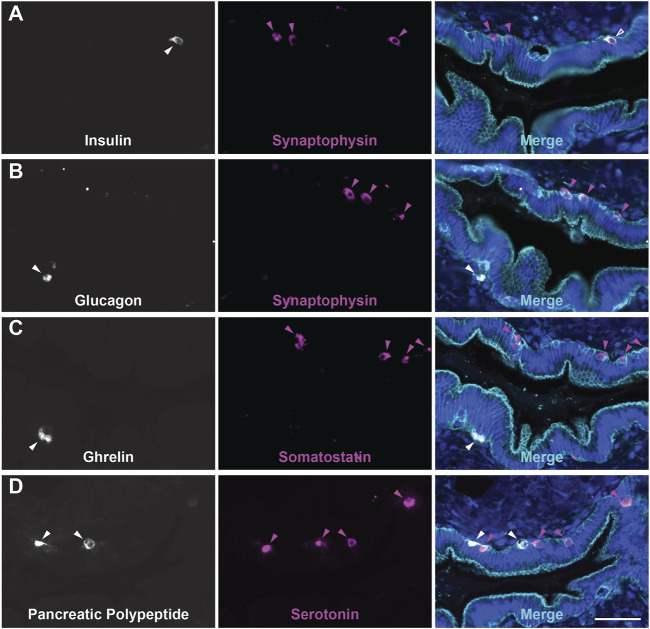
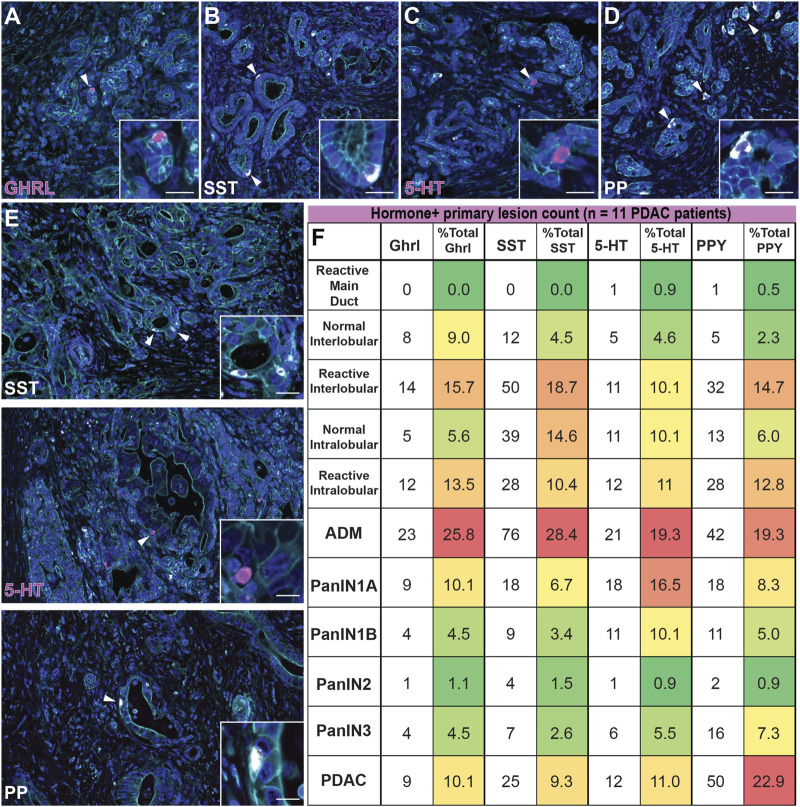
Pancreatic ductal adenocarcinoma (PDAC) is a devastating disease with a 5-year survival rate of only 11%, due, in part, to late diagnosis, making the need to understand early events in tumorigenesis critical. Acinar-to-ductal metaplasia (ADM), when not resolved, is a PDAC precursor. Recently, we showed that ADM is constituted by a heterogenous population of cells, including hormone-producing enteroendocrine cells (EECs: gamma, delta, epsilon, and enterochromaffin cells). In this study, we employed histopathological techniques to identify and quantify the abundance of EEC subtypes throughout pancreatic tumorigenesis in mouse models and human disease. We found that EECs are most abundant in ADM and significantly decrease with lesion progression. Co-immunofluorescence identifies distinct lineages and bihormonal populations. Evaluation of EEC abundance in mice lacking Pou2f3 demonstrates that the tuft cell master regulator transcription factor is not required for EEC formation. We compared these data to human neoplasia and PDAC and observed similar trends. Lastly, we confirm that EECs are a normal cellular compartment within the murine and human pancreatic ductal trees. Altogether, these data identify EECs as a cellular compartment of the normal pancreas, which expands early in tumorigenesis and is largely lost with disease progression.
Keywords: enteroendocrine cells; ghrelin; pancreas; pancreatic polypeptide (PP); serotonin; somatostatin.
Copyright © 2022 Caplan, Vavinskaya, Gelikman, Jyotsana, Trinh, Olive, Tan and DelGiorno.
Conflict of interest statement
The authors declare that the research was conducted in the absence of any commercial or financial relationships that could be construed as a potential conflict of interest.
Figures


Similar articles
-
Single-Cell Transcriptomics Reveals a Conserved Metaplasia Program in Pancreatic Injury.Gastroenterology. 2022 Feb;162(2):604-620.e20. doi: 10.1053/j.gastro.2021.10.027. Epub 2021 Oct 23. Gastroenterology. 2022. PMID: 34695382 Free PMC article.
-
GRP78 haploinsufficiency suppresses acinar-to-ductal metaplasia, signaling, and mutant Kras-driven pancreatic tumorigenesis in mice.Proc Natl Acad Sci U S A. 2017 May 16;114(20):E4020-E4029. doi: 10.1073/pnas.1616060114. Epub 2017 May 1. Proc Natl Acad Sci U S A. 2017. PMID: 28461470 Free PMC article.
-
ANGPTL4 accelerates KRASG12D-Induced acinar to ductal metaplasia and pancreatic carcinogenesis.Cancer Lett. 2021 Oct 28;519:185-198. doi: 10.1016/j.canlet.2021.07.036. Epub 2021 Jul 24. Cancer Lett. 2021. PMID: 34311032
-
Ductal metaplasia in pancreas.Biochim Biophys Acta Rev Cancer. 2022 Mar;1877(2):188698. doi: 10.1016/j.bbcan.2022.188698. Epub 2022 Feb 15. Biochim Biophys Acta Rev Cancer. 2022. PMID: 35176433 Review.
-
Clinical significance of pancreatic ductal metaplasia.J Pathol. 2022 Jun;257(2):125-139. doi: 10.1002/path.5883. Epub 2022 Mar 16. J Pathol. 2022. PMID: 35170758 Review.
Cited by
-
It is better to light a candle than to curse the darkness: single-cell transcriptomics sheds new light on pancreas biology and disease.Gut. 2023 Jun;72(6):1211-1219. doi: 10.1136/gutjnl-2022-329313. Epub 2023 Mar 30. Gut. 2023. PMID: 36997301 Free PMC article. Review.
-
Tuft cells transdifferentiate to neural-like progenitor cells in the progression of pancreatic cancer.bioRxiv [Preprint]. 2024 Apr 23:2024.02.12.579982. doi: 10.1101/2024.02.12.579982. bioRxiv. 2024. Update in: Dev Cell. 2024 Dec 19:S1534-5807(24)00725-1. doi: 10.1016/j.devcel.2024.12.003. PMID: 38405804 Free PMC article. Updated. Preprint.
References
-
- Andersson-Rolf A., Clevers H., Dayton T. L. (2000). “Diffuse Hormonal Systems,” in Endotext. Editors Feingold K. R., Anawalt B., Boyce A., Chrousos G., de Herder W. W., Dhatariya K., et al. (South Dartmouth (MA)).
Grants and funding
LinkOut - more resources
Full Text Sources
Molecular Biology Databases
Miscellaneous