

Determination of accurate 19F chemical shift tensors with R-symmetry recoupling at high MAS frequencies (60-100 kHz)
- PMID: 35568013
- PMCID: PMC10280466
- DOI: 10.1016/j.jmr.2022.107227
Determination of accurate 19F chemical shift tensors with R-symmetry recoupling at high MAS frequencies (60-100 kHz)
Abstract
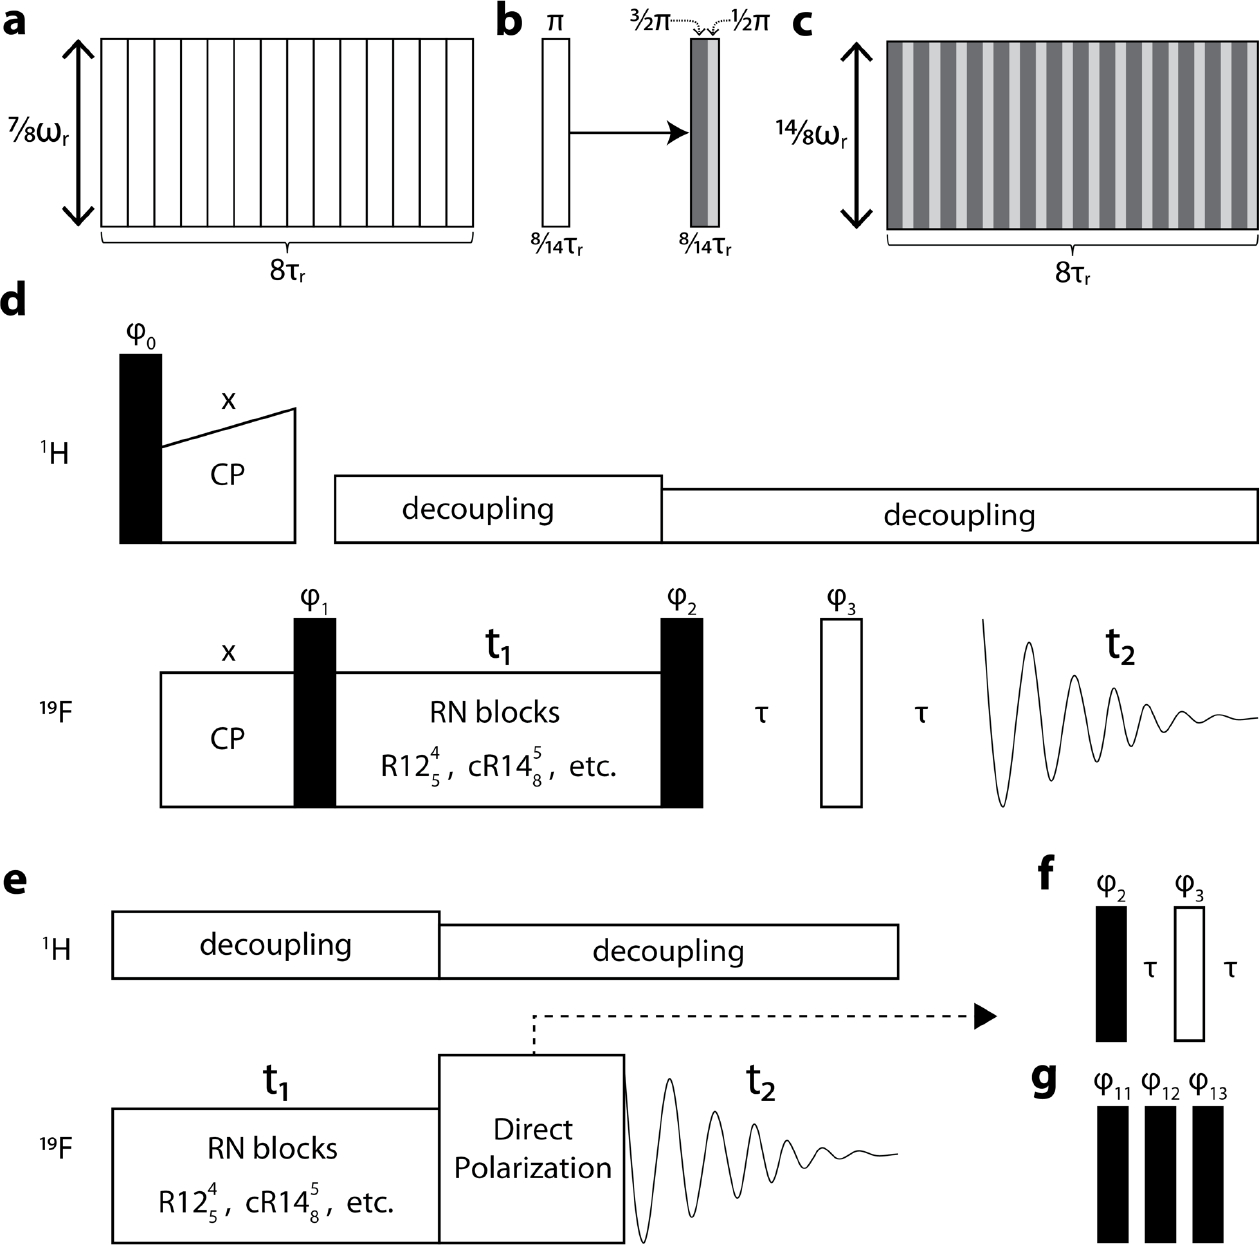
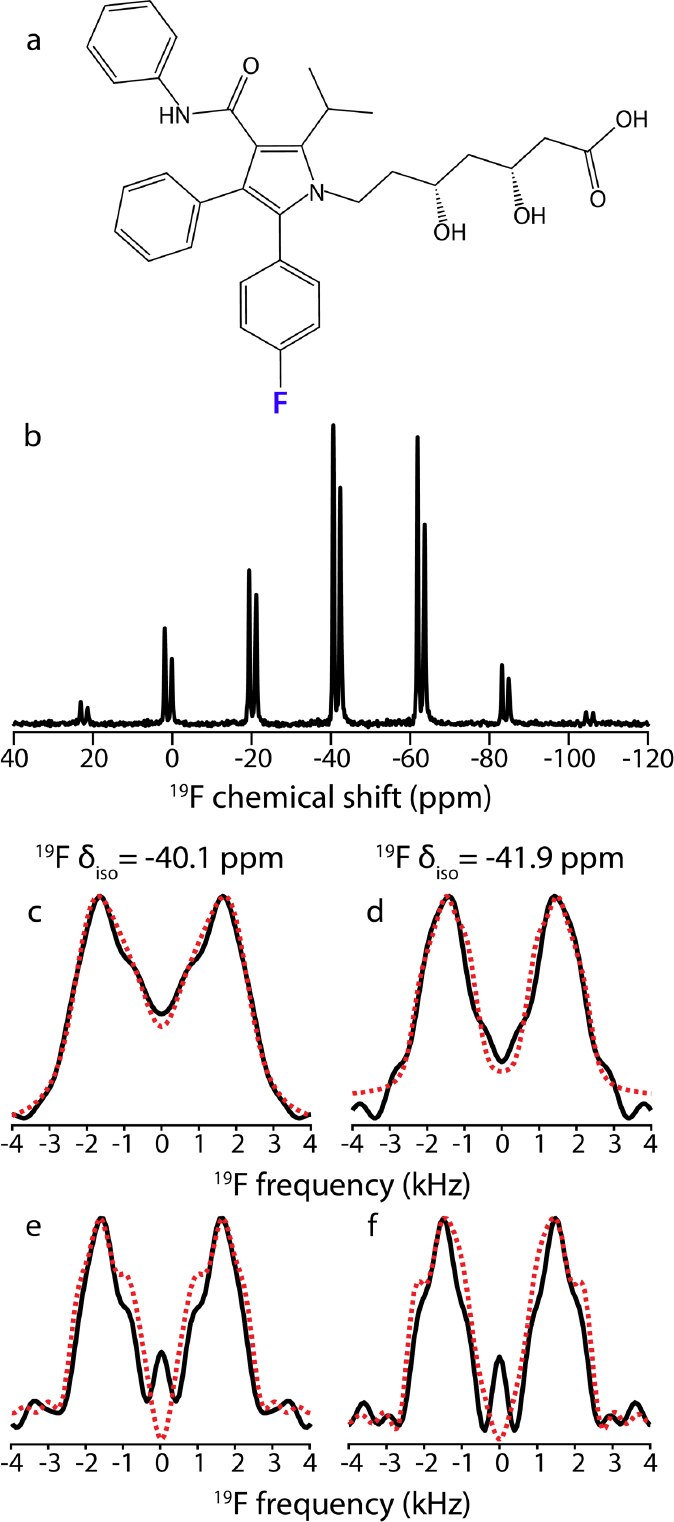
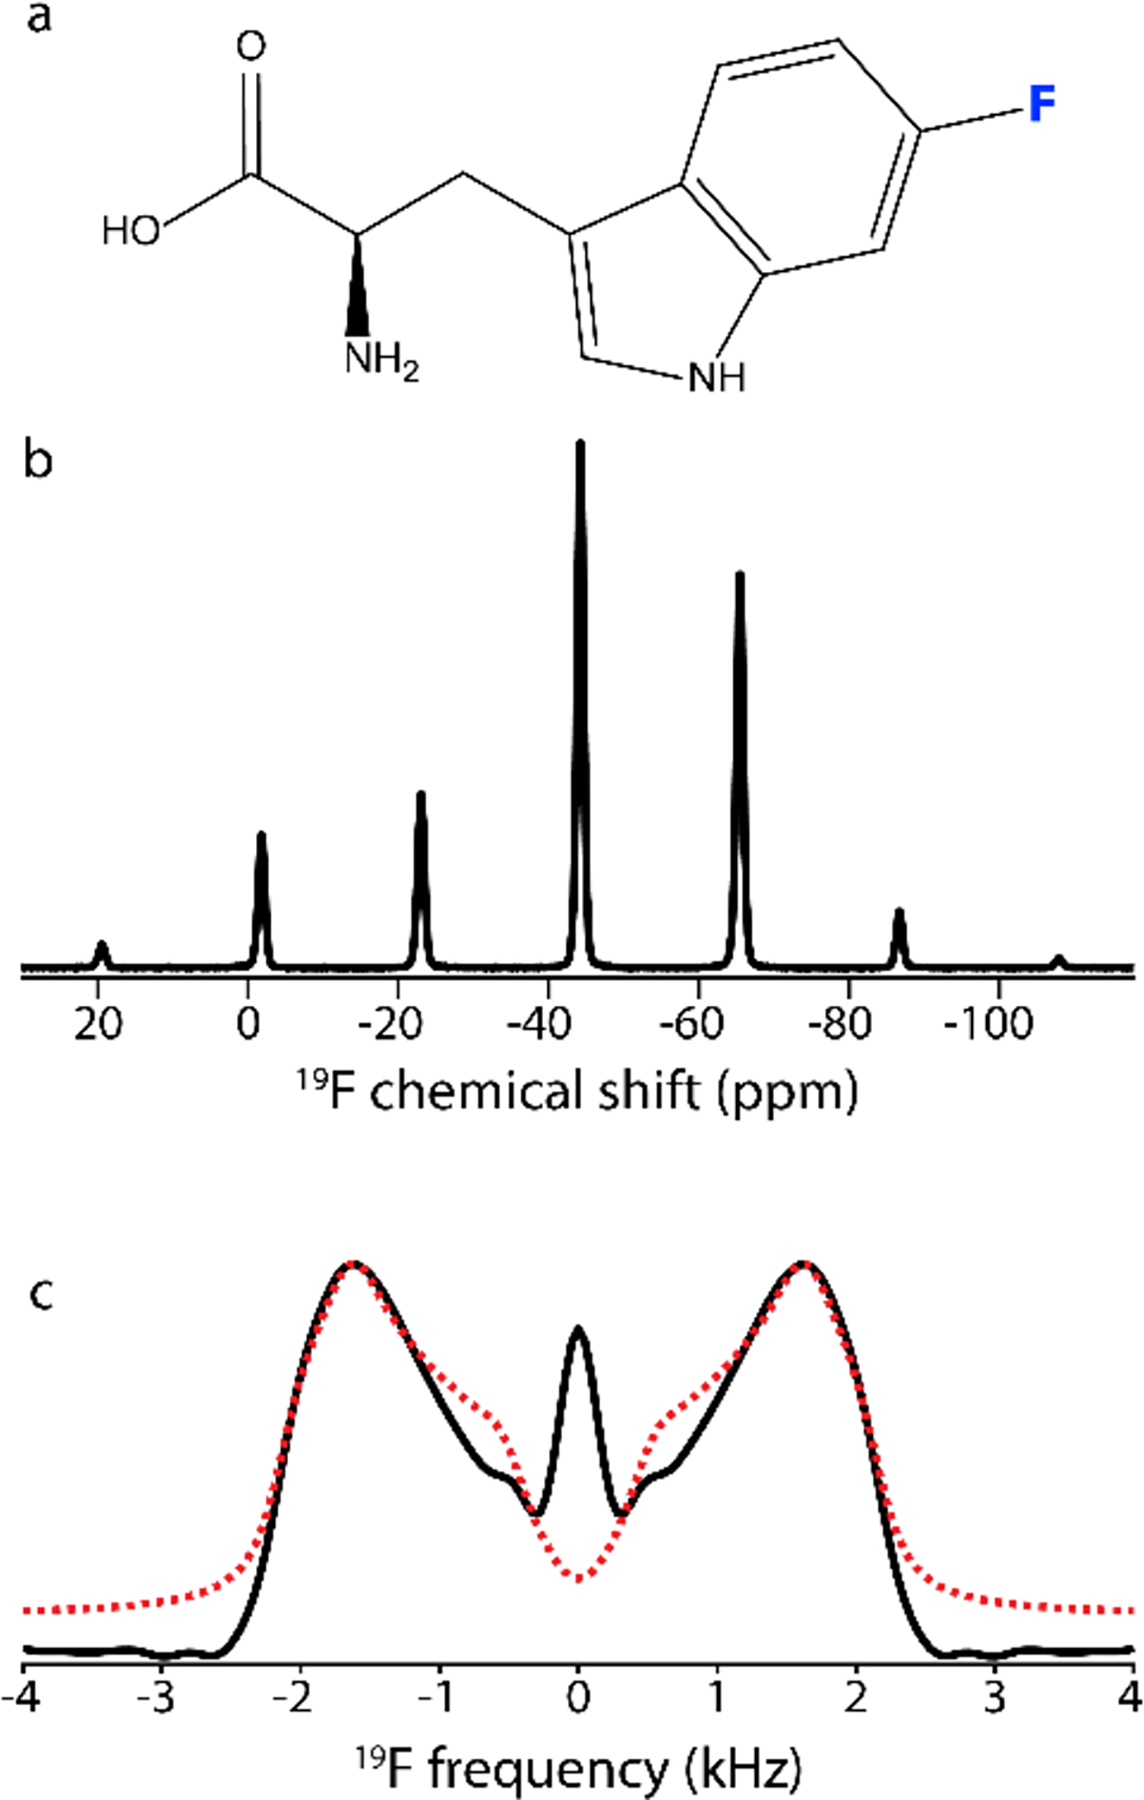
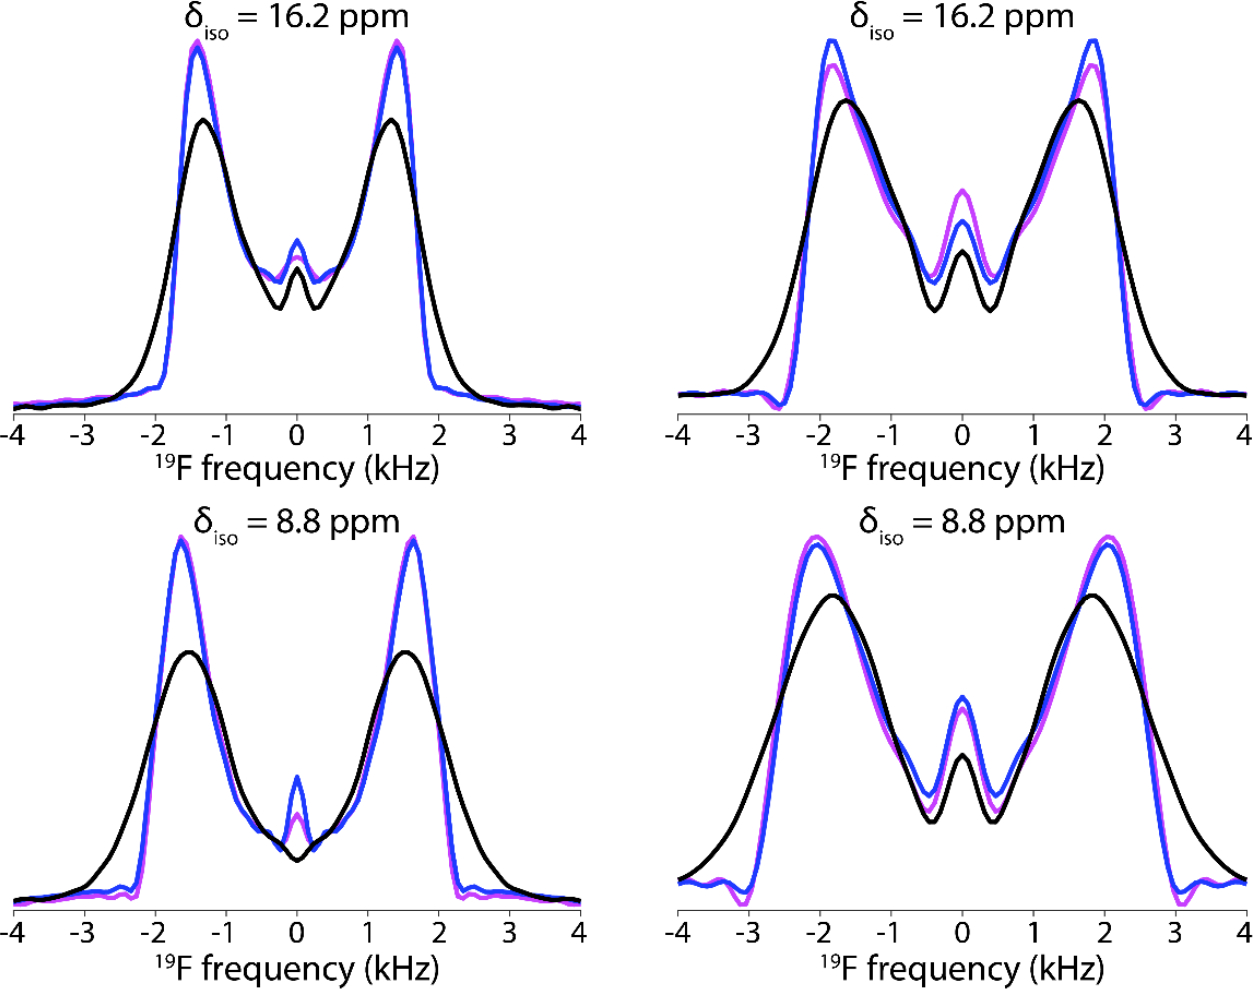
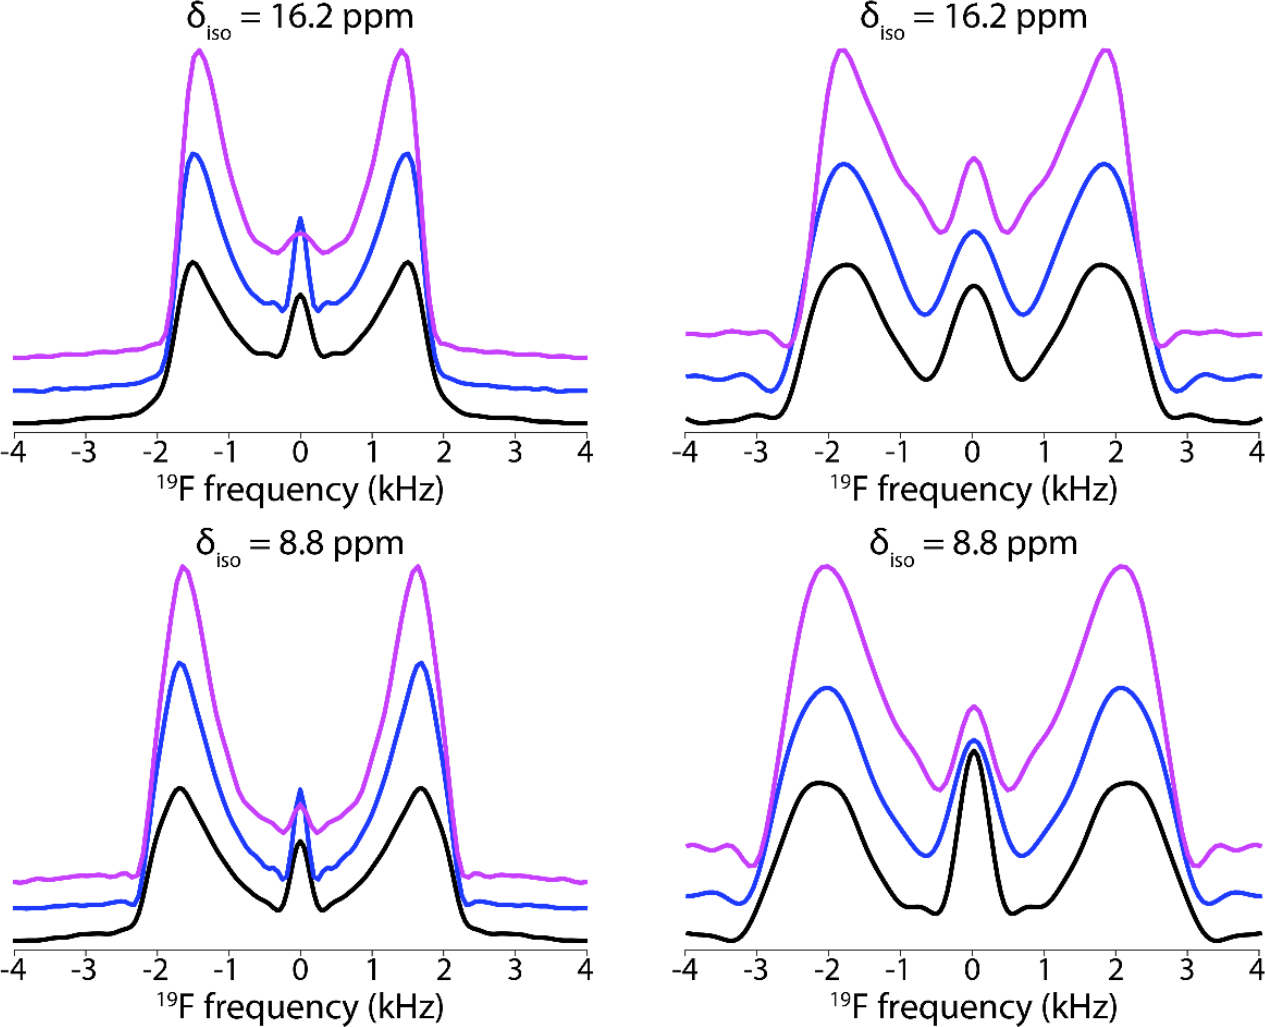
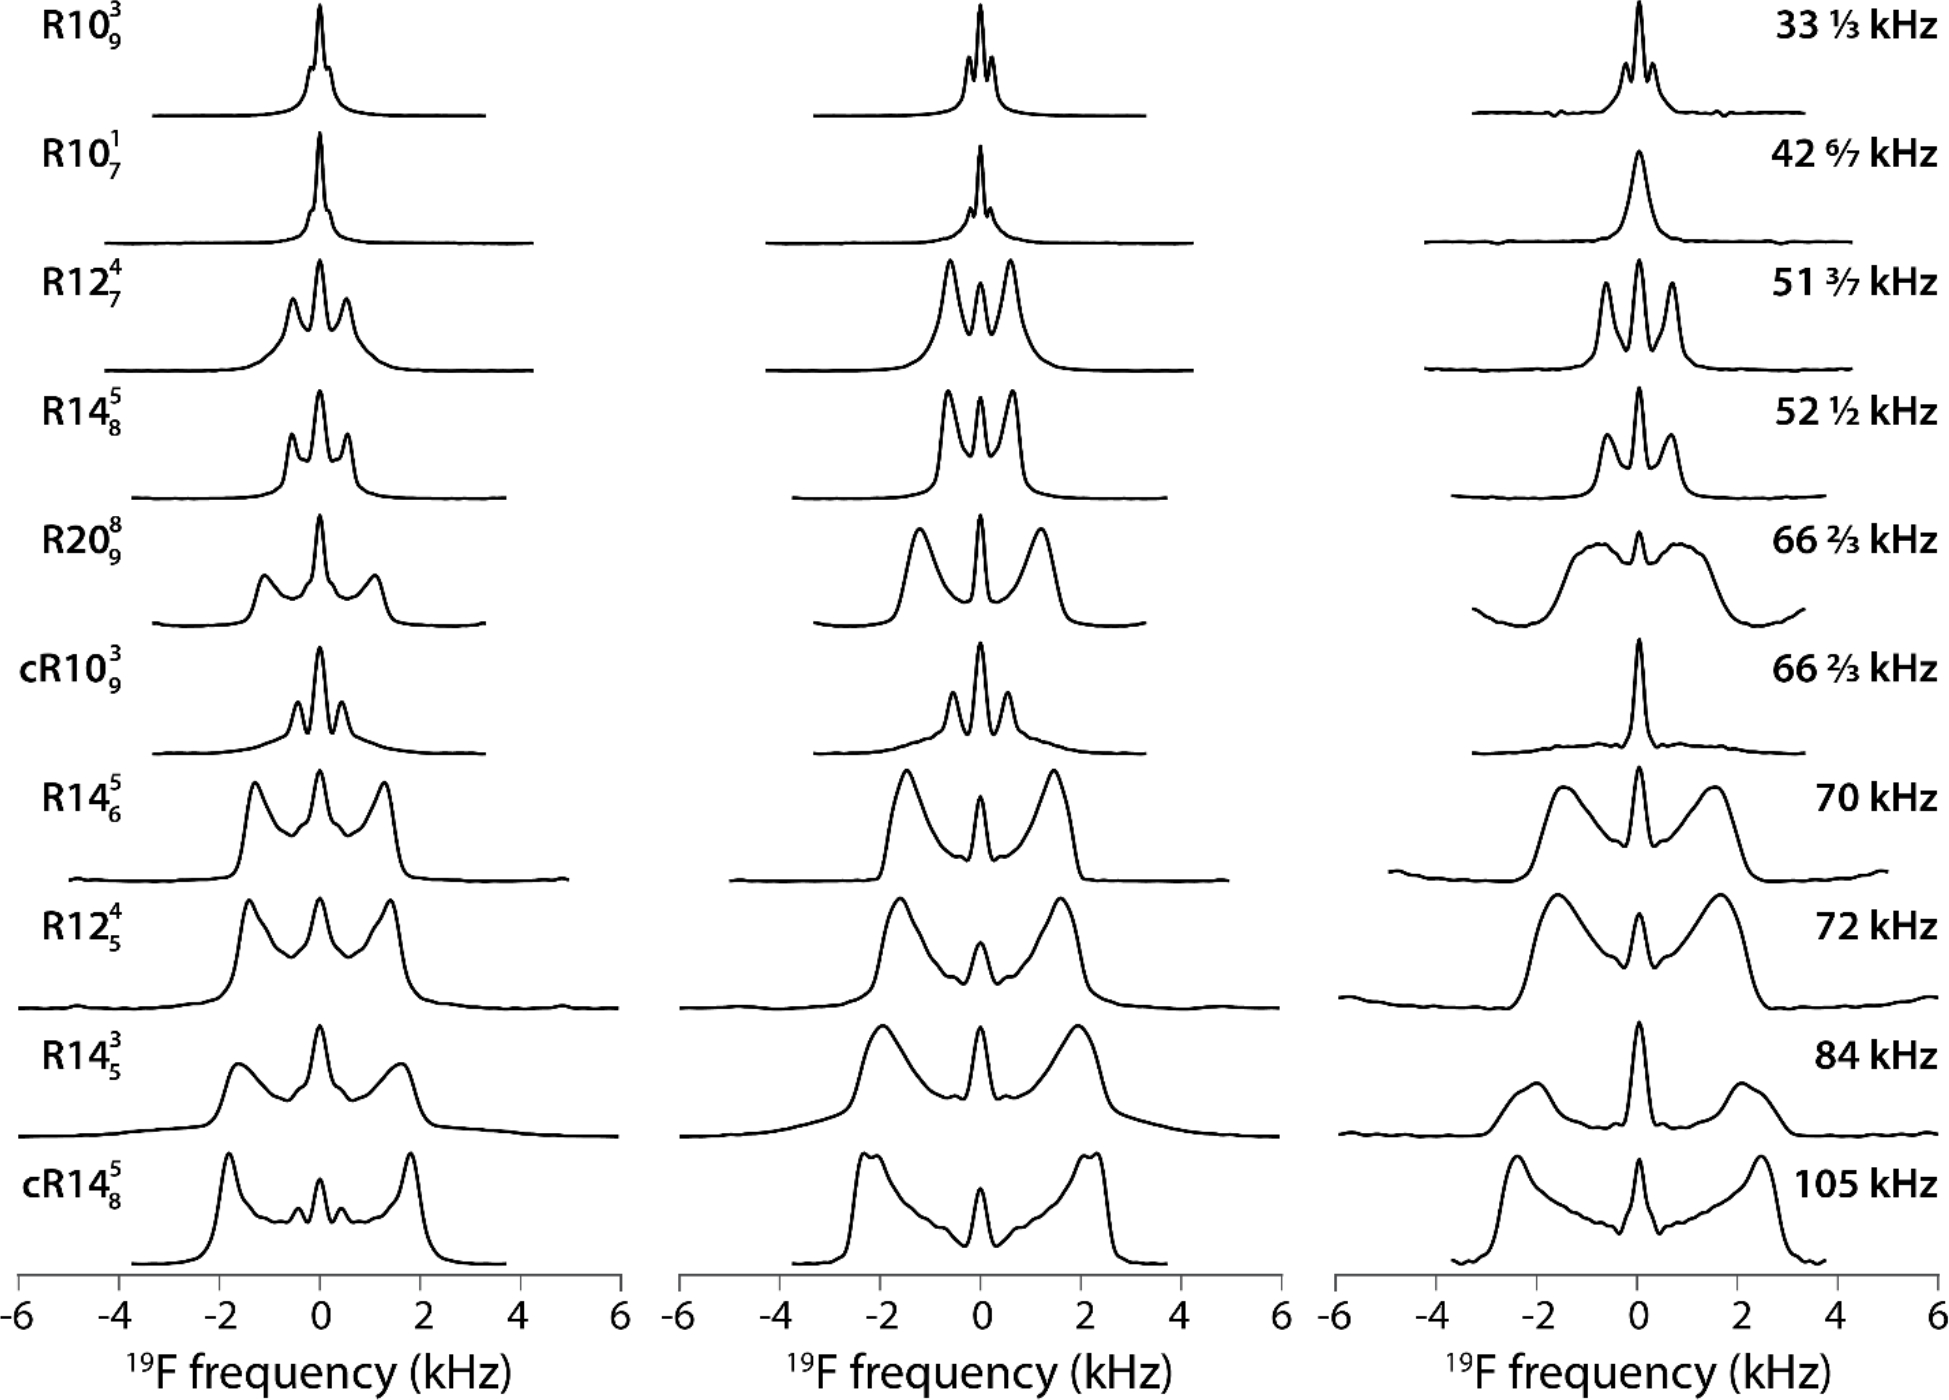
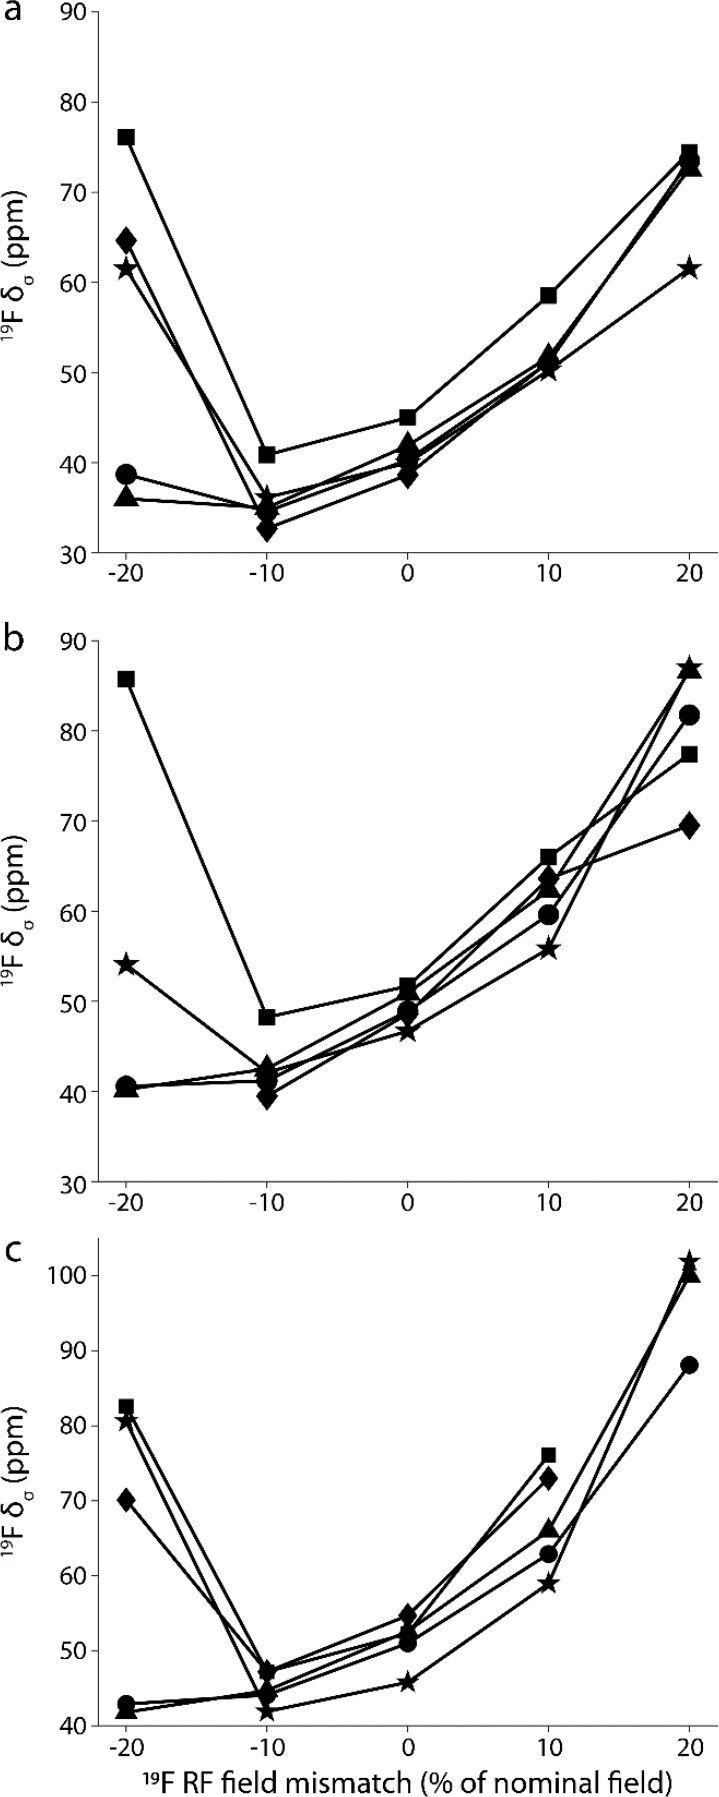
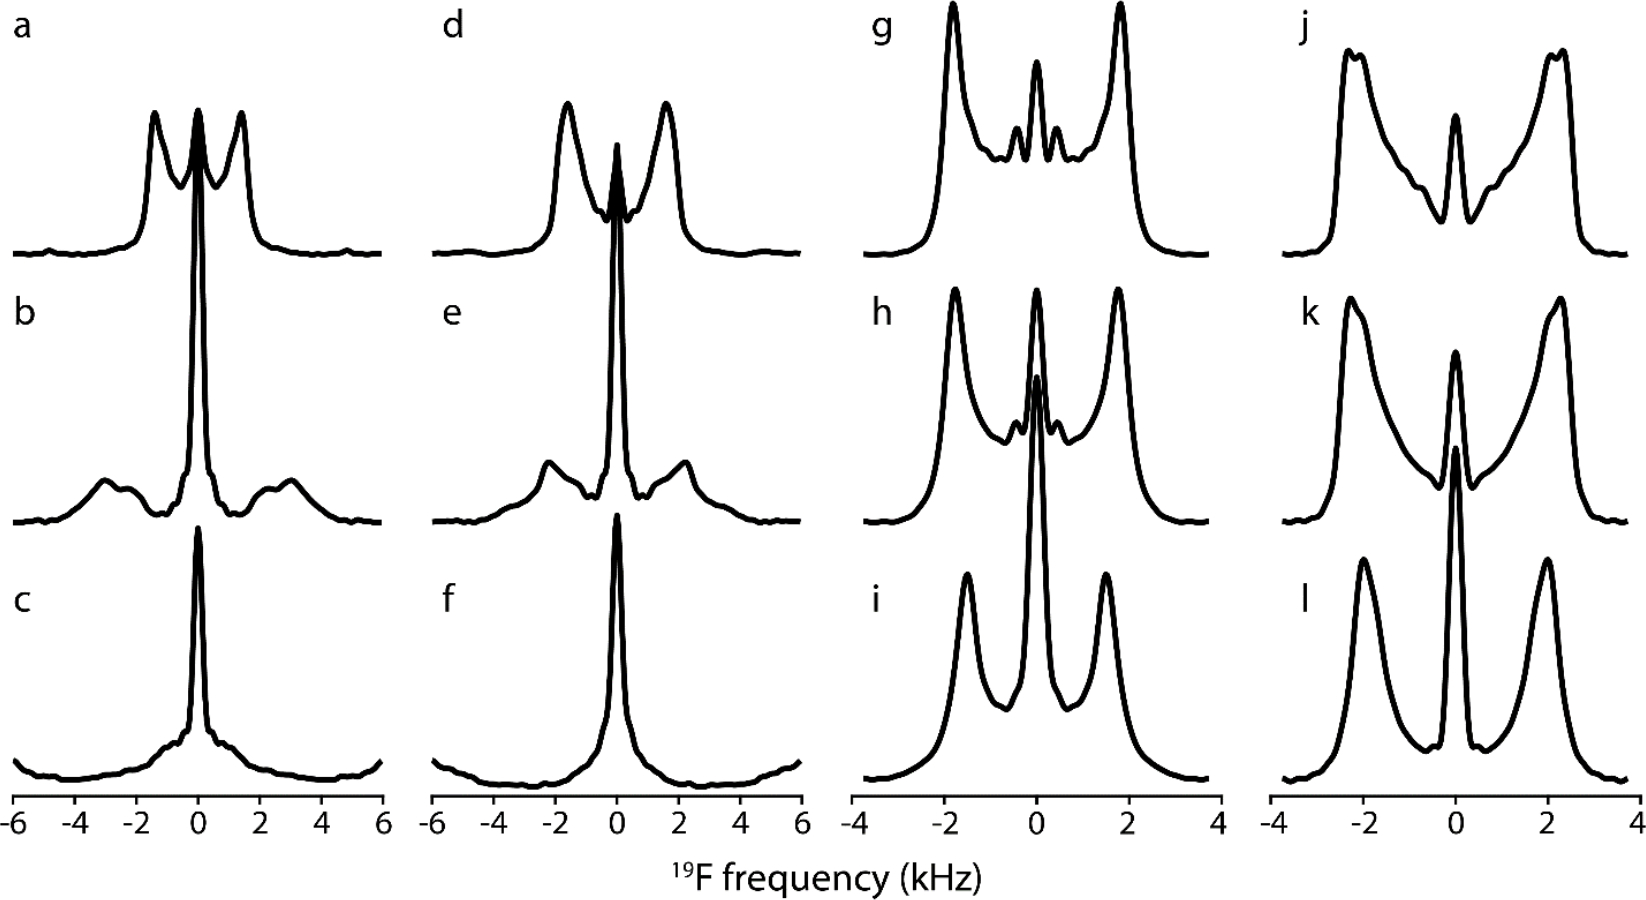
Fluorination is a versatile and valuable modification for numerous systems, and 19F NMR spectroscopy is the premier method for their structural characterization. 19F chemical shift anisotropy is a sensitive probe of structure and dynamics, even though 19F chemical shift tensors have been reported for only a handful of systems to date. Here, we explore γ-encoded R-symmetry based recoupling sequences for the determination of 19F chemical shift tensors in fully protonated organic solids at high, 60-100 kHz MAS frequencies. We show that the performance of 19F-RNCSA experiments improves with increasing MAS frequencies, and that 1H decoupling is required to determine accurate chemical shift tensor parameters. In addition, these sequences are tolerant to B1-field inhomogeneity making them suitable for a wide range of systems and experimental conditions.
Keywords: R-symmetry recoupling; chemical shift anisotropy; high-frequency (19)F MAS NMR.
Copyright © 2022 Elsevier Inc. All rights reserved.
Conflict of interest statement
Declaration of Competing Interest The authors declare that they have no known competing financial interests or personal relationships that could have appeared to influence the work reported in this paper.
Figures

Similar articles
-
Simultaneous recoupling of chemical shift tensors of two nuclei by R-symmetry sequences.J Magn Reson. 2023 Mar;348:107382. doi: 10.1016/j.jmr.2023.107382. Epub 2023 Jan 23. J Magn Reson. 2023. PMID: 36716616 Free PMC article.
-
Recoupling of chemical shift anisotropy by R-symmetry sequences in magic angle spinning NMR spectroscopy.J Chem Phys. 2012 Oct 7;137(13):134201. doi: 10.1063/1.4754149. J Chem Phys. 2012. PMID: 23039592 Free PMC article.
-
Composite-180° pulse-based symmetry sequences to recouple proton chemical shift anisotropy tensors under ultrafast MAS solid-state NMR spectroscopy.J Magn Reson. 2015 Jan;250:45-54. doi: 10.1016/j.jmr.2014.11.002. Epub 2014 Nov 18. J Magn Reson. 2015. PMID: 25497846 Free PMC article.
-
Recent progress in dipolar recoupling techniques under fast MAS in solid-state NMR spectroscopy.Solid State Nucl Magn Reson. 2021 Apr;112:101711. doi: 10.1016/j.ssnmr.2020.101711. Epub 2021 Jan 11. Solid State Nucl Magn Reson. 2021. PMID: 33508579 Review.
-
Solid-State NMR Dipolar and Chemical Shift Anisotropy Recoupling Techniques for Structural and Dynamical Studies in Biological Systems.Chem Rev. 2022 May 25;122(10):9880-9942. doi: 10.1021/acs.chemrev.1c00779. Epub 2022 Jan 10. Chem Rev. 2022. PMID: 35006680 Review.
Cited by
-
Simultaneous recoupling of chemical shift tensors of two nuclei by R-symmetry sequences.J Magn Reson. 2023 Mar;348:107382. doi: 10.1016/j.jmr.2023.107382. Epub 2023 Jan 23. J Magn Reson. 2023. PMID: 36716616 Free PMC article.
-
Cell-free synthesis of amyloid fibrils with infectious properties and amenable to sub-milligram magic-angle spinning NMR analysis.Commun Biol. 2022 Nov 9;5(1):1202. doi: 10.1038/s42003-022-04175-1. Commun Biol. 2022. PMID: 36352173 Free PMC article.
-
19F fast MAS (60-111 kHz) dipolar and scalar based correlation spectroscopy of organic molecules and pharmaceutical formulations.Solid State Nucl Magn Reson. 2022 Dec;122:101831. doi: 10.1016/j.ssnmr.2022.101831. Epub 2022 Sep 23. Solid State Nucl Magn Reson. 2022. PMID: 36182713 Free PMC article.
References
-
- Gakh YG, Gakh AA, Gronenborn AM, Fluorine as an NMR Probe for Structural Studies of Chemical and Biological Systems, Magn. Reson. Chem, 38 (2000) 551–558.
-
- Chen H, Viel S, Ziarelli F, Peng L, 19F NMR: A Valuable Tool for Studying Biological Events, Chem. Soc. Rev, 42 (2013) 7971–7982. - PubMed
-
- Zhou Y, Wang J, Gu Z, Wang S, Zhu W, Aceña JL, Soloshonok VA, Izawa K, Liu H, Next Generation of Fluorine-Containing Pharmaceuticals, Compounds Currently in Phase II–III Clinical Trials of Major Pharmaceutical Companies: New Structural Trends and Therapeutic Areas, Chem. Rev, 116 (2016) 422–518. - PubMed
-
- Mei H, Han J, Fustero S, Medio-Simon M, Sedgwick DM, Santi C, Ruzziconi R, Soloshonok VA, Fluorine-Containing Drugs Approved by the FDA in 2018, Chem. Eur. J, 25 (2019) 11797–11819. - PubMed
Publication types
MeSH terms
Grants and funding
LinkOut - more resources
Full Text Sources
