. 2022 May 12;20(5):e3001588.
doi: 10.1371/journal.pbio.3001588. eCollection 2022 May.

Unusual mammalian usage of TGA stop codons reveals that sequence conservation need not imply purifying selection

Affiliations

Unusual mammalian usage of TGA stop codons reveals that sequence conservation need not imply purifying selection

Alexander Thomas Ho et al. PLoS Biol. .

Abstract

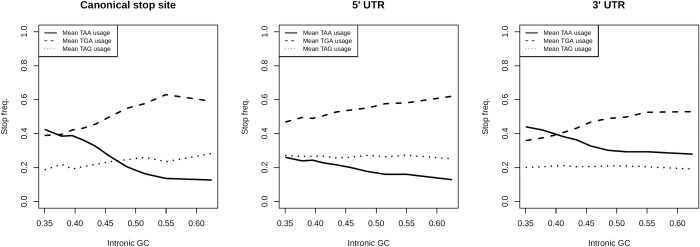
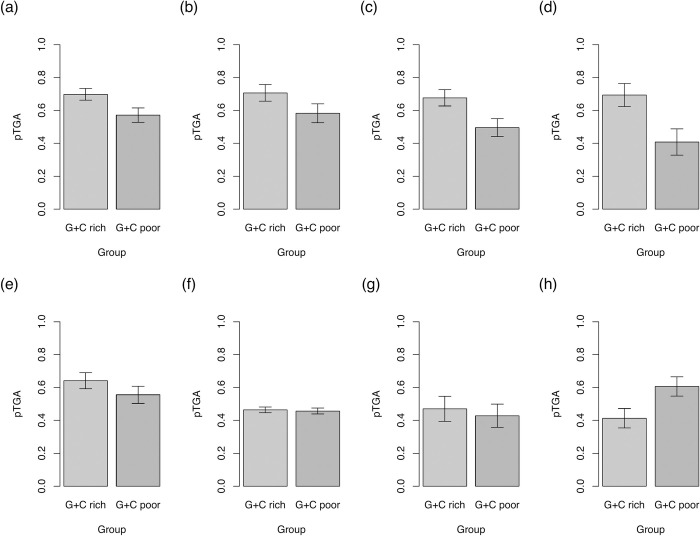
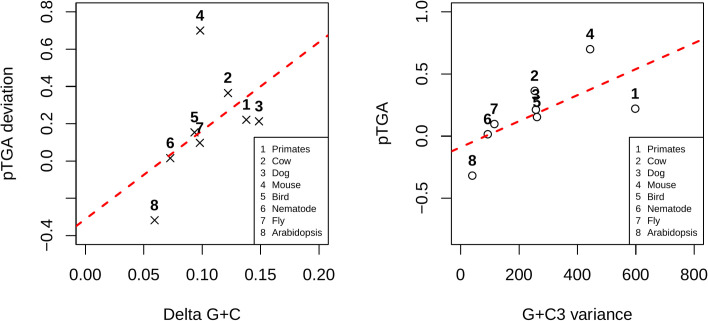
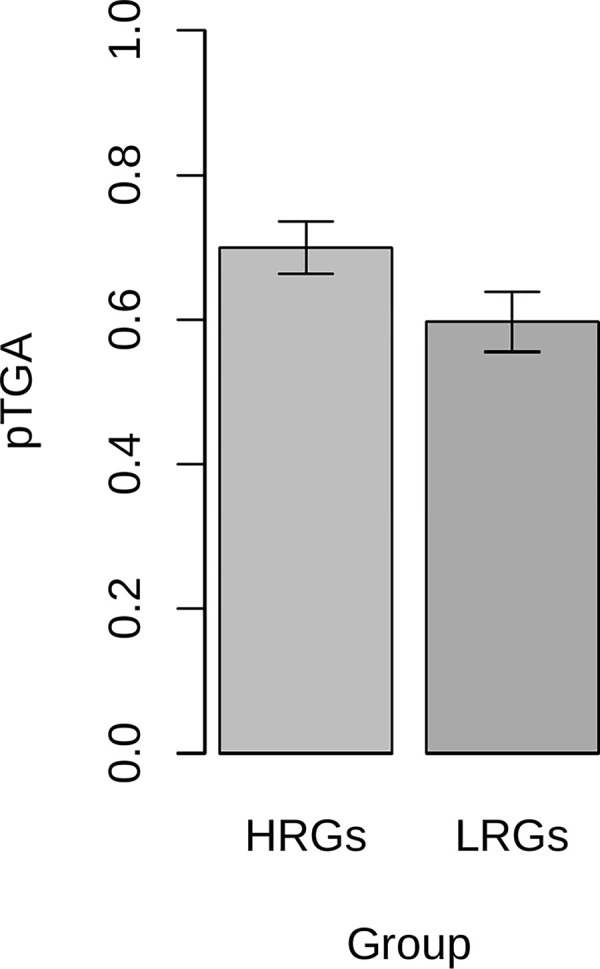
The assumption that conservation of sequence implies the action of purifying selection is central to diverse methodologies to infer functional importance. GC-biased gene conversion (gBGC), a meiotic mismatch repair bias strongly favouring GC over AT, can in principle mimic the action of selection, this being thought to be especially important in mammals. As mutation is GC→AT biased, to demonstrate that gBGC does indeed cause false signals requires evidence that an AT-rich residue is selectively optimal compared to its more GC-rich allele, while showing also that the GC-rich alternative is conserved. We propose that mammalian stop codon evolution provides a robust test case. Although in most taxa TAA is the optimal stop codon, TGA is both abundant and conserved in mammalian genomes. We show that this mammalian exceptionalism is well explained by gBGC mimicking purifying selection and that TAA is the selectively optimal codon. Supportive of gBGC, we observe (i) TGA usage trends are consistent at the focal stop codon and elsewhere (in UTR sequences); (ii) that higher TGA usage and higher TAA→TGA substitution rates are predicted by a high recombination rate; and (iii) across species the difference in TAA <-> TGA substitution rates between GC-rich and GC-poor genes is largest in genomes that possess higher between-gene GC variation. TAA optimality is supported both by enrichment in highly expressed genes and trends associated with effective population size. High TGA usage and high TAA→TGA rates in mammals are thus consistent with gBGC's predicted ability to "drive" deleterious mutations and supports the hypothesis that sequence conservation need not be indicative of purifying selection. A general trend for GC-rich trinucleotides to reside at frequencies far above their mutational equilibrium in high recombining domains supports the generality of these results.


Conflict of interest statement

The authors have declared that no competing interests exist.

Figures

Fig 1
Fig 1. Stop codon frequencies (relative to the usage of all stops) at the canonical stop site, in the 5′ UTR, and in the 3′ UTR at 10 equal-sized bins of various intronic GC contents in the genome.
TAA frequency is negatively correlated with intronic GC content in all 3 sequences (Spearman’s rank; all p < 2.2 × 10‒16, all rho = ‒0.99, n = 10). TGA is positively correlated with intronic GC content in all 3 sequences (Spearman’s rank; all p < 2.2 × 10‒16, rho = 0.99 for CDS, rho = 1 for both UTRs, n = 10). TAG usage is positively correlated with intronic GC content at the canonical stop site (Spearman’s rank; p = 0.0014, rho = 0.89, n = 10) but is uncorrelated with intronic GC content in both 5′ (Spearman’s rank; p = 0.10, rho = 0.55, n = 10) and 3′ UTR sequences (Spearman’s rank; p = 0.61, rho = 0.19, n = 10). Underlying data can be found in S1 Data.
Fig 2
Fig 2. pTGA derived from TAA→TGA and TGA→TAA flux for the top 50% of genes by GC content and bottom 50% of genes by GC content in 4 mammalian (a–d) and 4 nonmammalian (e–h) lineages.
pTGA is calculated as 1/(1+(TGA→TAA/TAA→TGA)) and hence represents the balance between the 2 dominant stop codon flux events. Error bars show standard deviation calculated from 10,000 bootstraps generated by resampling genes in each bin with replacement. Underlying data can be found in S2 Data. Trios analysed are primates (a), dogs (b), cows (c), mice (d), birds (e), nematodes (f), fruit flies (g), and plants (h). Species lists are available at https://github.com/ath32/gBGC.
Fig 3
Fig 3
pTGA deviation between the top 50% and bottom 50% of genes by GC content as a function of (a) the difference in GC content between the 2 gene bins, “delta GC,” and (b) coding sequence GC3 content variance across a sample of 4 mammalian and 4 nonmammalian lineages. pTGA is calculated as 1/(1+(TGA→TAA/TAA→TGA)) and hence represents the balance between the 2 dominant stop codon flux events. pTGA deviation is calculated as (O-E)/E where O is the pTGA score of GC-rich genes and E is the pTGA score of GC-poor genes. pTGA deviation is positively correlated with both delta GC (Spearman’s rank; p = 0.046, rho = 0.74, n = 8) and GC3 variance (Spearman’s rank; p = 0.028, rho = 0.79, n = 8). Underlying data can be found in S3 Data. (O-E)/E, (Observed-Expected)/Expected; pTGA, predicted TGA usage.
Fig 4
Fig 4. pTGA derived from TAA→TGA and TGA→TAA flux for the top 50% of genes by recombination rate (HRGs) and bottom 50% of genes by recombination rate (LRGs) in the human genome.
pTGA is calculated as 1/(1+(TGA→TAA/TAA→TGA)) and hence represents the balance between the 2 dominant stop codon flux events. Error bars show standard deviation calculated from 10,000 bootstraps generated by resampling genes in each bin with replacement. Underlying data can be found in S4 Data. HRG, highly recombining gene; LRG, lowly recombining gene; pTGA, predicted TGA usage.
Fig 5
Fig 5
Predicted GC equilibrium (GC*) and relative TGA equilibrium (TGA*) frequencies across isochore GC contents derived from mononucleotide (orange) and dinucleotide (purple) mutational matrices. Standard deviations for the datapoints are minuscule and hence error bars are not shown (approximately 0.5% for mononucleotide estimates of TGA* and GC*, approximately 0.5% for dinucleotide estimates of TGA*, and approximately 0.1 for dinucleotide estimates of GC*). Underlying data can be found in S5 Data.
Fig 6
Fig 6
Observed (a) CDS, (b) 5′ UTR, (c) 3′ UTR, (d) intronic, (e) ncRNA, (f) CRE trinucleotide frequencies as a function of the expected frequencies of the same trinucleotides derived from a dinucleotide mutational matrix. Expected frequencies were calculated simulated DNA sequences derived from dinucleotide equilibrium frequencies. Dinucleotide frequencies were calculated from a sample of de novo mutations taking place in the bottom 20% of sequences by GC content to avoid potential GC-coupled fixation biases. Expected frequencies accurately predict what is seen in real CDS sequence (linear regression; p = 7.7 × 10⁻¹⁵, adjusted r2 = 0.62), 5′ UTR sequence (linear regression; p < 2.2 × 10‒16, adjusted r2 = 0.90), 3′ UTR sequence (linear regression; p < 2.2 × 10‒16, adjusted r2 = 0.91), intronic sequence (linear regression; p < 2.2 × 10‒16, adjusted r2 = 0.90), ncRNA sequence (linear regression; p < 2.2 × 10‒16, adjusted r2 = 0.90), and CRE sequence (linear regression; p < 2.2 × 10‒16, adjusted r2 = 0.93). Underlying data can be found in S6 Data. CDS, coding sequence; CRE, cis-regulatory element; ncRNA, noncoding RNA.
Fig 7
Fig 7. Deviation scores, (O-E)/E, describing the difference in GC-coupled fixation “boost” for the 4 GC classes of trinucleotides.
Deviation between fixed and mutational equilibrium frequencies for each trinucleotide in the top 20% of sequences by GC content, D1, was calculated as (O-E)/E, where expected is the mutational equilibrium frequency. This was repeated for the bottom 20% of sequences by GC content to receive D2. As we predict GC-rich sequences to be subjected to stronger biased gene conversion, we predict D1 > D2. To compare D1 and D2, we once again calculate (O-E)/E, which we dub the GC-coupled fixation “boost”. In all sequences, GC content is positively correlated with this “boost” metric (Spearman’s rank; all p < 2.2 × 10‒16; rho = 0.92 in CDS, rho = 0.94 in 5′ UTR, rho = 0.90 in 3′ UTR, rho = 0.87 in introns, rho = 0.92 in ncRNA, rho = 0.93 in CREs, n = 64 in all tests). Underlying data can be found in S7 Data. CDS, coding sequence; CRE, cis-regulatory element; ncRNA, noncoding RNA; (O-E)/E, (Observed-Expected)/Expected.
Fig 8
Fig 8
Correlation analysis of trinucleotide ranks (by their gBGC “boost” metric) within the 4 GC classes (a) 0%, (b) 33%, (c) 66%, and (d) 100%. Within the 33% and 66% GC classes, ranks are significantly correlated in all comparisons (p < 0.01). This is not true of the 0% and 100% GC classes, correlation analyses within which are underpowered (n = 8 trinucleotides in each class compared to 24 in the 33% and 66% classes). Correlation statistics were calculated using Pearson’s method. Underlying data can be found in S8 Data. CRE, cis-regulatory element; gBGC, GC-biased gene conversion; ncRNA, noncoding RNA.

Similar articles

Cited by

References

    1. Ponting CP. Biological function in the twilight zone of sequence conservation. BMC Biol. 2017;15(1):1–9. doi: 10.1186/s12915-016-0343-5 - DOI - PMC - PubMed
    1. Nielsen R, Yang ZH. Likelihood models for detecting positively selected amino acid sites and applications to the HIV-1 envelope gene. Genetics. 1998;148(3):929–36. doi: 10.1093/genetics/148.3.929 - DOI - PMC - PubMed
    1. Yang ZH, Bielawski JP. Statistical methods for detecting molecular adaptation. Trends Ecol Evol. 2000;15(12):496–503. doi: 10.1016/s0169-5347(00)01994-7 - DOI - PMC - PubMed
    1. Pond SLK, Frost SDW. Not so different after all: A comparison of methods for detecting amino acid sites under selection. Mol Biol Evol. 2005;22(5):1208–22. doi: 10.1093/molbev/msi105 - DOI - PubMed
    1. Hurst LD. The Ka/Ks ratio: diagnosing the form of sequence evolution. Trends Genet. 2002;18(9):486–7. doi: 10.1016/s0168-9525(02)02722-1 - DOI - PubMed

Publication types

Substances

Grants and funding

This work was supported by the European Research Council (grant EvoGenMed ERC-2014-ADG 669207 to L.D.H.). The funders had no role in study design, data collection and analysis, decision to publish, or preparation of the manuscript.