Motor-Driven Restructuring of Cytoskeleton Composites Leads to Tunable Time-Varying Elasticity
- PMID: 35549081
- PMCID: PMC9239751
- DOI: 10.1021/acsmacrolett.1c00500
Motor-Driven Restructuring of Cytoskeleton Composites Leads to Tunable Time-Varying Elasticity
Abstract
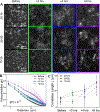
The composite cytoskeleton, comprising interacting networks of semiflexible actin and rigid microtubules, generates forces and restructures by using motor proteins such as myosins to enable key processes including cell motility and mitosis. Yet, how motor-driven activity alters the mechanics of cytoskeleton composites remains an open challenge. Here, we perform optical tweezers microrheology and confocal imaging of composites with varying actin-tubulin molar percentages (25-75, 50-50, and 75-25), driven by light-activated myosin II motors, to show that motor activity increases the elastic plateau modulus by over 2 orders of magnitude by active restructuring of both actin and microtubules that persists for hours after motor activation has ceased. Nonlinear microrheology measurements show that motor-driven restructuring increases the force response and stiffness and suppresses actin bending. The 50-50 composite exhibits the most dramatic mechanical response to motor activity due to the synergistic effects of added stiffness from the microtubules and sufficient motor substrate for pronounced activity.
Conflict of interest statement
Notes
The authors declare no competing financial interest.
Figures


Similar articles
-
Reconstituting and Characterizing Actin-Microtubule Composites with Tunable Motor-Driven Dynamics and Mechanics.J Vis Exp. 2022 Aug 25;(186):10.3791/64228. doi: 10.3791/64228. J Vis Exp. 2022. PMID: 36094259 Free PMC article.
-
Non-monotonic dependence of stiffness on actin crosslinking in cytoskeleton composites.Soft Matter. 2019 Nov 28;15(44):9056-9065. doi: 10.1039/c9sm01550g. Epub 2019 Oct 24. Soft Matter. 2019. PMID: 31647488 Free PMC article.
-
Varying crosslinking motifs drive the mesoscale mechanics of actin-microtubule composites.Sci Rep. 2019 Sep 6;9(1):12831. doi: 10.1038/s41598-019-49236-4. Sci Rep. 2019. PMID: 31492892 Free PMC article.
-
Insights into the mechanisms of myosin and kinesin molecular motors from the single-molecule unbinding force measurements.J R Soc Interface. 2010 Jun 6;7 Suppl 3(Suppl 3):S295-306. doi: 10.1098/rsif.2010.0107.focus. Epub 2010 Mar 31. J R Soc Interface. 2010. PMID: 20356879 Free PMC article. Review.
-
Probing cytoplasmic organization and the actin cytoskeleton of plant cells with optical tweezers.Biochem Soc Trans. 2010 Jun;38(3):823-8. doi: 10.1042/BST0380823. Biochem Soc Trans. 2010. PMID: 20491670 Review.
Cited by
-
Reconstituting and Characterizing Actin-Microtubule Composites with Tunable Motor-Driven Dynamics and Mechanics.J Vis Exp. 2022 Aug 25;(186):10.3791/64228. doi: 10.3791/64228. J Vis Exp. 2022. PMID: 36094259 Free PMC article.
-
Kinesin and myosin motors compete to drive rich multiphase dynamics in programmable cytoskeletal composites.PNAS Nexus. 2023 Jul 31;2(8):pgad245. doi: 10.1093/pnasnexus/pgad245. eCollection 2023 Aug. PNAS Nexus. 2023. PMID: 37575673 Free PMC article.
-
Multiscale architecture: Mechanics of composite cytoskeletal networks.Biophys Rev (Melville). 2022 Aug 26;3(3):031304. doi: 10.1063/5.0099405. eCollection 2022 Sep. Biophys Rev (Melville). 2022. PMID: 38505277 Free PMC article. Review.
-
Active cytoskeletal composites display emergent tunable contractility and restructuring.Soft Matter. 2021 Dec 8;17(47):10765-10776. doi: 10.1039/d1sm01083b. Soft Matter. 2021. PMID: 34792082 Free PMC article.
-
Optical tweezers microrheology maps micro-mechanics of complex systems.Trends Biochem Sci. 2024 Jul;49(7):649-650. doi: 10.1016/j.tibs.2024.04.009. Epub 2024 May 22. Trends Biochem Sci. 2024. PMID: 38782700 No abstract available.
References
-
- Burla F; Mulla Y; Vos B; Aufderhorst-Roberts A; Koenderink G From Mechanical Resilience to Active Material Properties in Biopolymer Networks. Nat. Rev. Phys. 2019, 1, 249.
-
- Blanchoin L; Boujemaa-Paterski R; Sykes C; Plastino J Actin Dynamics, Architecture, and Mechanics in Cell Motility. Physiol. Rev. 2014, 94 (1), 235–263. - PubMed
Publication types
MeSH terms
Substances
Grants and funding
LinkOut - more resources
Full Text Sources

